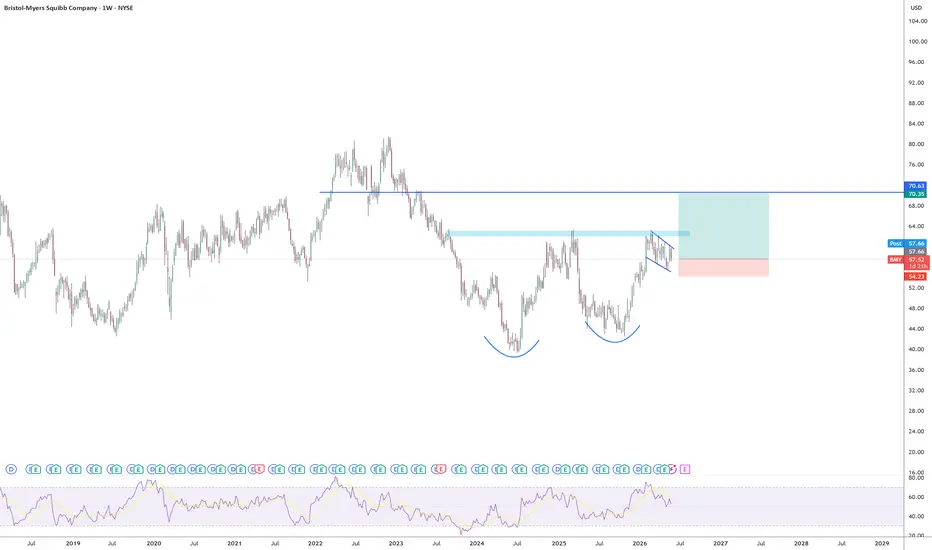
This is massiveMassive setup. Potential double bottom and a bullish flag forming to break out the neck. I have calls 57.5 for 12/18/2026. The trade is invalid if the bullish flag gets busted: a weekly candle closes below it. My TP is shown on the chart but a think it can get even higher. This is a keeper.
Bristol-Myers Squibb Company Shs Cert Deposito Arg Repr 0.333333 Sh
No trades
No trades
Compare with Bristol-Myers Squibb Company Shs Cert Deposito Arg Repr 0.333333 Sh
1,600 ARS
8.79 T ARS
60.02 T ARS
Details
Sector
Industry
CEO
Christopher S. Boerner
Website
Headquarters
Princeton
Founded
1933
IPO date
Jul 5, 1929
ISIN
ARDEUT112877
FIGI
BBG000L7BMZ1
Identifiers
ISIN ARDEUT112877
Bristol Myers Squibb Co. engages in the discovery, development, licensing, manufacture, marketing, distribution, and sale of biopharmaceutical products. It offers small molecules, products produced from biological processes called biologics, and chimeric antigen receptor (CAR-T) cell therapies. The company was founded in August 1933 and is headquartered in Princeton, NJ.
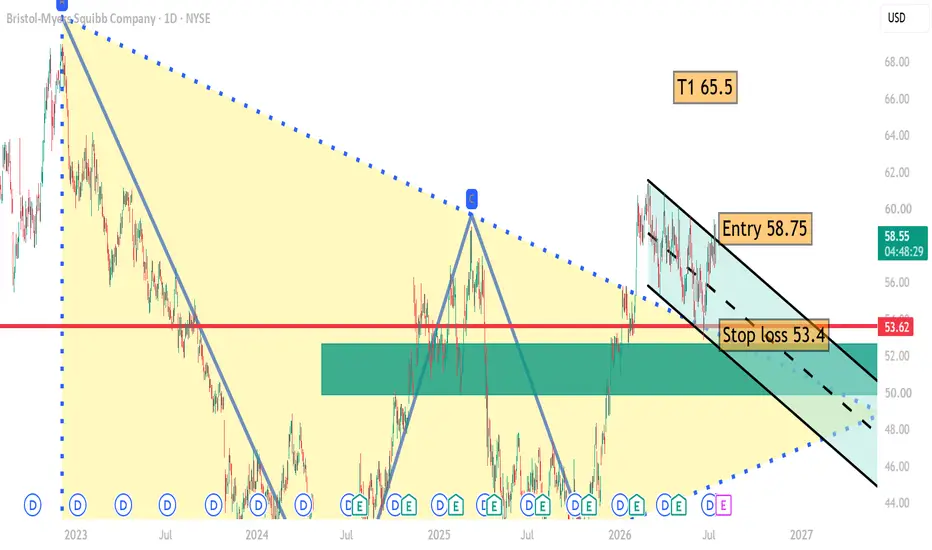
$BMY | Bristol-Myers Squibb | 1D Technical AnalysisThe chart is showing a constructive recovery after breaking out from a long-term accumulation range. Price is currently consolidating inside a descending channel (bull flag), which is typically considered a continuation pattern following a strong impulsive move.
Technical Structure
The stock succes
Bullish potential detected for BMYEntry conditions:
(i) higher share price for NYSE:BMY along with swing up of indicators such as DMI/RSI, and
(ii) observation of market reaction around the potential support/resistance line of $58.61 from the open of 20th May 2024.
Depending on risk tolerance, the stop loss for the trade would be
Bullish ChartReally nice consolidation after the trend break on BMY. Similar names are establishing a nice mini-uptrend.
There is a lot more potential if and when the market starts rotating and/or piling into value/defensive names
Step 1 - truncating the decimal on inflation (today's Fed meeting)
Step 2 - rate
The furniture sector in the UK weak,but Bristol-Myers holds upThe furniture sector in the UK is weak, but Bristol-Myers holds up
Ion Jauregui – Analyst at ActivTrades
The furniture sector in the United Kingdom is weakening due to the slowdown in consumption and the real estate market. The furniture sector in the United Kingdom shows signs of deceleration in
BMY reversal base, range near highs stays constructiveAfter a down phase, BMY built a base that looks like a descending pennant.
The upside breakout flipped structure and released price from the falling framework.
Since the break, price is printing higher highs plus higher lows. That is the new bias.
Price is now in a horizontal bullish consolidatio
BMY at $55: Support Holding Ahead of Earnings – Leaning BullishCurrent Price: 55.05 (Analysis was generated on Monday Morning)
Direction: LONG
Confidence level: 63%(Several traders highlight strong support near $54, limited downside conviction, and constructive sentiment around the pipeline and dividend, but data volume is limited, keeping confidence moderate
Just saying YES to these drugs at 55.26This one is a semi-safety play in an area currently underrepresented in my portfolio. BMY has a lot going for it right now from a technical standpoint.
1 - currently above its 20, 50 and 200d MA. A huge positive in an uncertain environment.
2- it's been in an uptrend since Halloween. The trend
BMY Attracts Buyers at the 20-Day EMA Within a Strong UptrendBristol Myers Squibb (BMY) is seeing renewed demand at the 20-day exponential moving average following a pullback. The stock remains in a strong uptrend, defined by higher highs and higher lows, and continues to trade above its key moving averages, which are positively aligned—reinforcing bullish co
See all ideas
Summarizing what the indicators are suggesting.
Oscillators
Neutral
SellBuy
Strong sellStrong buy
Strong sellSellNeutralBuyStrong buy
Oscillators
Neutral
SellBuy
Strong sellStrong buy
Strong sellSellNeutralBuyStrong buy
Summary
Neutral
SellBuy
Strong sellStrong buy
Strong sellSellNeutralBuyStrong buy
Summary
Neutral
SellBuy
Strong sellStrong buy
Strong sellSellNeutralBuyStrong buy
Summary
Neutral
SellBuy
Strong sellStrong buy
Strong sellSellNeutralBuyStrong buy
Moving Averages
Neutral
SellBuy
Strong sellStrong buy
Strong sellSellNeutralBuyStrong buy
Moving Averages
Neutral
SellBuy
Strong sellStrong buy
Strong sellSellNeutralBuyStrong buy
Displays a symbol's price movements over previous years to identify recurring trends.
6.628% YTM
Maturity dateAug 1, 2097
Coupon6.88% (Fixed)
6.510% YTM
Maturity dateAug 15, 2043
Coupon5.25% (Fixed)
6.465% YTM
Maturity dateFeb 20, 2048
Coupon4.55% (Fixed)
6.375% YTM
Maturity dateNov 15, 2047
Coupon4.35% (Fixed)
6.133% YTM
Maturity dateMay 15, 2044
Coupon4.63% (Fixed)
6.088% YTM
Maturity dateNov 15, 2053
Coupon6.25% (Fixed)
6.061% YTM
Maturity dateMar 15, 2062
Coupon3.90% (Fixed)
6.062% YTM
Maturity dateNov 15, 2063
Coupon6.40% (Fixed)
6.041% YTM
Maturity dateMar 15, 2052
Coupon3.70% (Fixed)
6.037% YTM
Maturity dateNov 13, 2050
Coupon2.55% (Fixed)
6.033% YTM
Maturity dateFeb 20, 2048
Coupon4.55% (Fixed)
See all BMY bonds