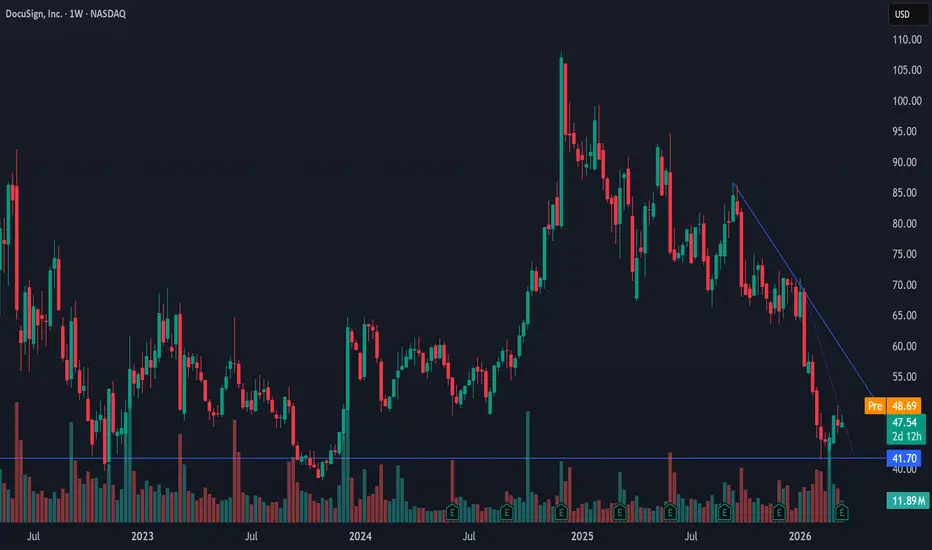
DOCU | The time to go long has come- Timeframe: Weekly
- Trade type: Buy stop order
- Price: 45.33
- Take Profit: Open
- Stop Loss: 42.25 (-6.80 %)
Idea: Long on a breakout above last week's high - bullish momentum continuation.
Entry: Buy stop above last week’s high.
Stop-loss: Below the low of the same candle.
If the weekly candle
DocuSign, Inc. Shs Cert Deposito Arg Repr 0.0454545
No trades
No trades
98.020 ARS
394.93 B ARS
4.11 T ARS
Details
Sector
Industry
CEO
Allan C. Thygesen
Website
Headquarters
San Francisco
Founded
2003
IPO date
Apr 27, 2018
ISIN
ARBCOM4603H9
FIGI
BBG020LN6S87
Identifiers
ISIN ARBCOM4603H9
DocuSign, Inc. engages in the provision of cloud-based electronic signature solutions, which helps companies and individuals securely collect information, automate data workflows, and sign anything. The firm automates manual and paper-based processes allowing users to manage all aspects of documented business transactions including identity management, authentication, digital signature, forms and data collection, collaboration, workflow automation, and storage. Its products include eSignature, CLM, Gen for Salesforce, Document Generation, Standards-Based Signatures, Notary and Web Forms. The company was founded by Thomas H. Gonser and Court Lorenzini in 2003 and is headquartered in San Francisco, CA.
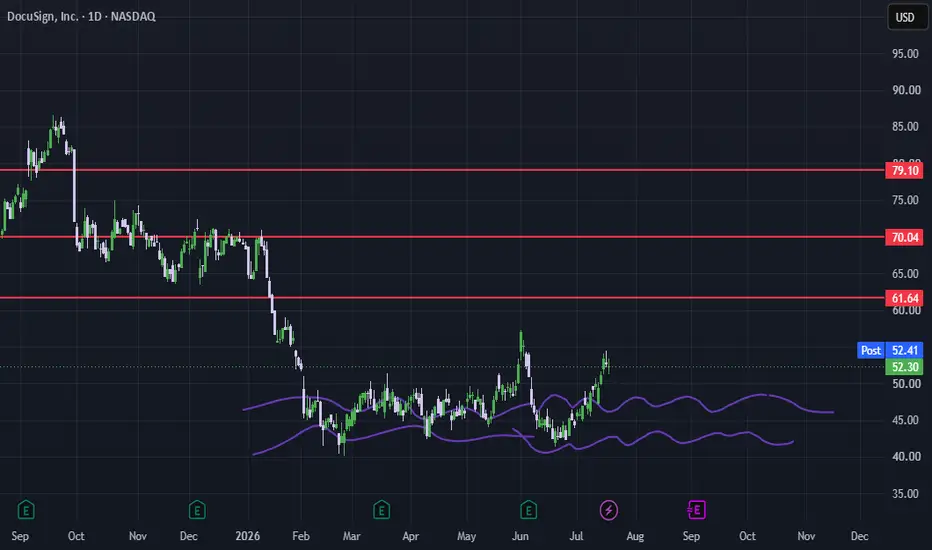
It's a time for DOCUSIGN - POTENTIAL PROFIT 30%Based on the current chart structure, the stock appears to be forming a potential base after an extended downtrend. Price has repeatedly respected the demand zone around $41–43, suggesting that buyers are stepping in and defending this support area. The recent rebound from these lows indicates impro
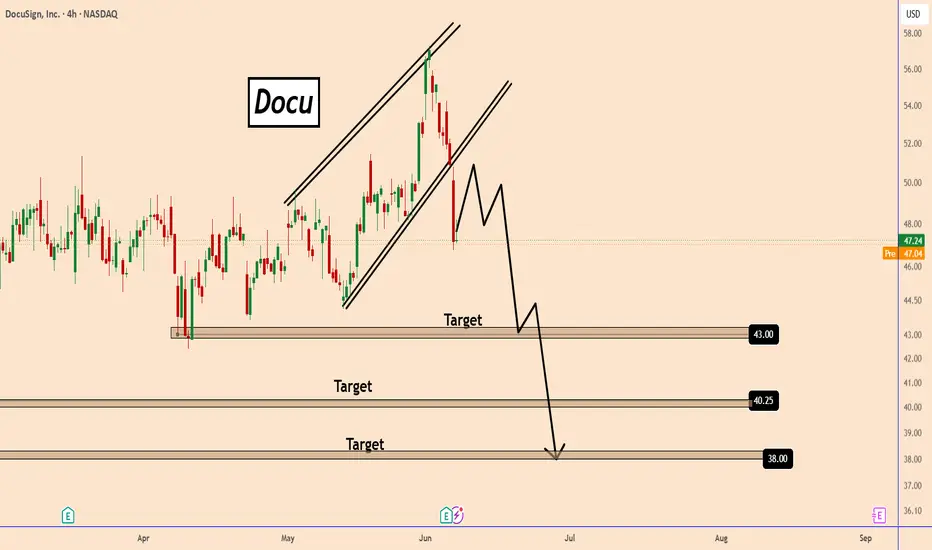
DOCU Rejection Signals Trend Reversal – 43 → 38 in PlayDOCU Rejection Signals Trend Reversal – 43 → 38 in Play
Price recently broke out of an ascending channel Indicating for a possible start of the bearish trend.
It's possible that DOCU price may rise to $50 before it moves down as shown in the chart.
We can see that DOCU is in a strong downtrend fo
DOCU: Ascending Triangle Breakout confirmed by Multi-Timeframe MDocuSign ( NASDAQ:DOCU ) is displaying highly constructive price action on both the daily and weekly timeframes. The stock is currently breaking out out of a well-defined ascending triangle pattern, supported by strong momentum and moving average alignment.
Technical Breakdown:
Chart Pattern: Clea
DOCU DocuSign Options Ahead of EarningsIf you haven`t bought DOCU before the previous earnings:
Now analyzing the options chain and the chart patterns of DOCU DocuSign prior to the earnings report this week,
I would consider purchasing the 65usd strike price Calls with
an expiration date of 2026-7-17,
for a premium of approximately $1.
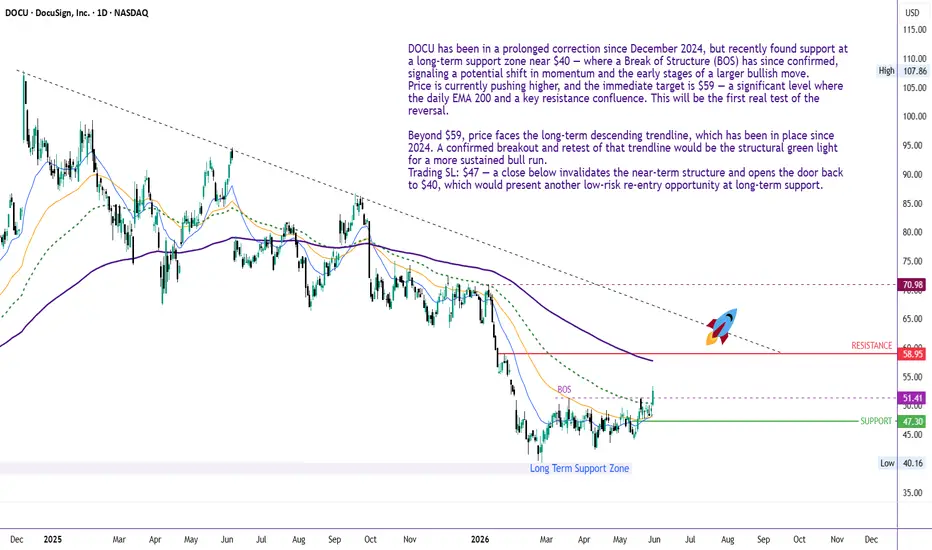
DOCU turns bullish - Short TermDOCU has been in a prolonged correction since December 2024, but recently found support at a long-term support zone near $40 — where a Break of Structure (BOS) has since confirmed, signaling a potential shift in momentum and the early stages of a larger bullish move.
Price is currently pushing highe
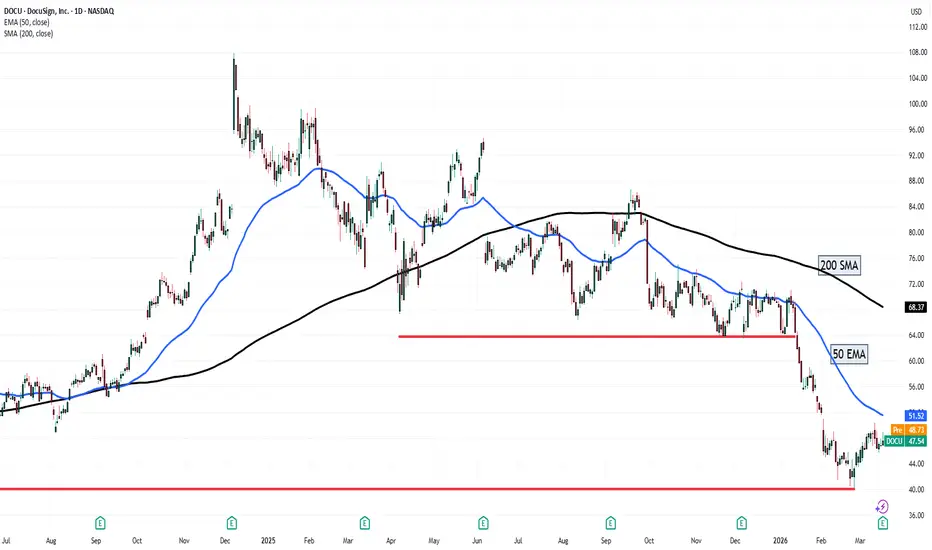
Docusign a >10x or Going to 0?Docusign is a well established company with 8 years history on the Nasdaq. Its performance has it back around ATLs.
It very well could break below those lows and head towards 0.
Look at the company fundamentals though. It has had two red earnings periods in its entire history, both of those with
DocuSign (DOCU)DocuSign, Inc. is an American company that provides digital signature and agreement management solutions in the cloud. The company enables businesses and individuals to sign, send, and manage documents securely and digitally, and is part of the eSignature and Agreement Cloud sector. (Wikipedia)
The
DocuSign Strategy: AI Innovation and $2 Billion BuybacksDocuSign recently stunned Wall Street with a massive earnings beat. The company authorized a $2 billion share buyback program. This move signals management’s immense confidence in long-term value. Investors responded by driving the stock higher. DocuSign is now evolving from a signature tool into an
See all ideas
Summarizing what the indicators are suggesting.
Oscillators
Neutral
SellBuy
Strong sellStrong buy
Strong sellSellNeutralBuyStrong buy
Oscillators
Neutral
SellBuy
Strong sellStrong buy
Strong sellSellNeutralBuyStrong buy
Summary
Neutral
SellBuy
Strong sellStrong buy
Strong sellSellNeutralBuyStrong buy
Summary
Neutral
SellBuy
Strong sellStrong buy
Strong sellSellNeutralBuyStrong buy
Summary
Neutral
SellBuy
Strong sellStrong buy
Strong sellSellNeutralBuyStrong buy
Moving Averages
Neutral
SellBuy
Strong sellStrong buy
Strong sellSellNeutralBuyStrong buy
Moving Averages
Neutral
SellBuy
Strong sellStrong buy
Strong sellSellNeutralBuyStrong buy
Displays a symbol's price movements over previous years to identify recurring trends.