
 Long
Long0.90 USD
1.10 B USD
19.04 B USD
Details
Sector
Industry
CEO
Jeffrey Allen Miller
Website
Headquarters
Houston
Founded
1919
IPO date
Sep 15, 1948
ISIN
ARBCOM4603E6
FIGI
BBG020LML9N7
Identifiers
ISIN ARBCOM4603E6
Halliburton Co. engages in the provision of products and services to the energy industry. It operates through the Completion and Production, and Drilling and Evaluation segments. The Completion and Production segment focuses on cementing, stimulation, specialty chemicals, intervention, pressure control, artificial lift, and completion products and services. The Drilling and Evaluation segment provides field and reservoir modeling, drilling, fluids, evaluation, and wellbore placement solutions that enable customers to model, measure, drill, and optimize well construction activities. The company was founded by Erle P. Halliburton in 1919 and is headquartered in Houston, TX.
Long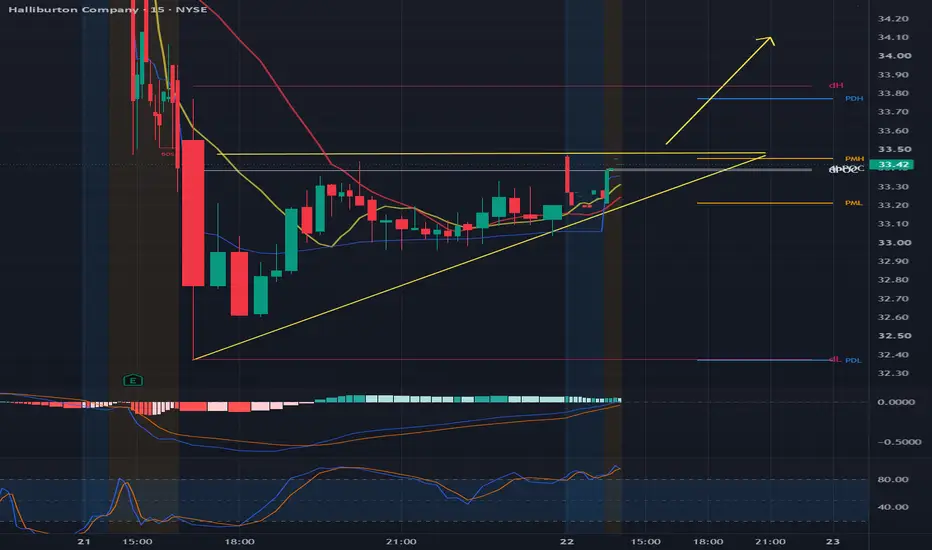
HAL Testing Key Support After Multiple Failed Breakout AttemptsNSE:HAL remains in a longer-term uptrend, trading above its rising 100 EMA (gray) and 200 EMA (green), but recent price action is showing signs of weakening momentum near resistance.
Price has formed a series of lower highs in the $41.00–$43.50 zone, highlighted by multiple failed breakout attempt
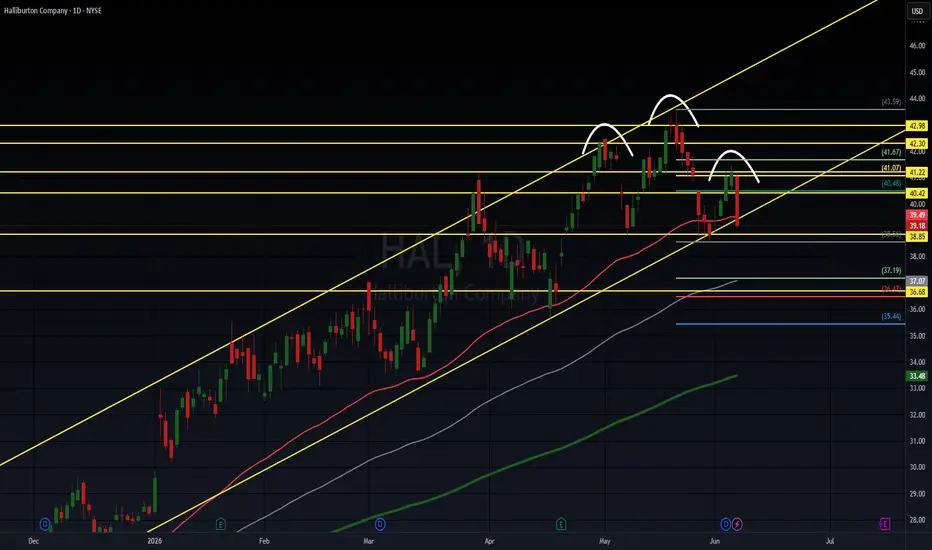
$HAL - 50 SMA Support and Potential ReversalSwing setup idea
50 SMA bullish reversal
Analysis summary:
The stock is getting support at the 50 SMA and holding a strong level around $38.72.
After 8 days of selling, buyer volume is starting to step in. With higher lows, higher highs, and a doji candle at support, this could be a capitulation
Long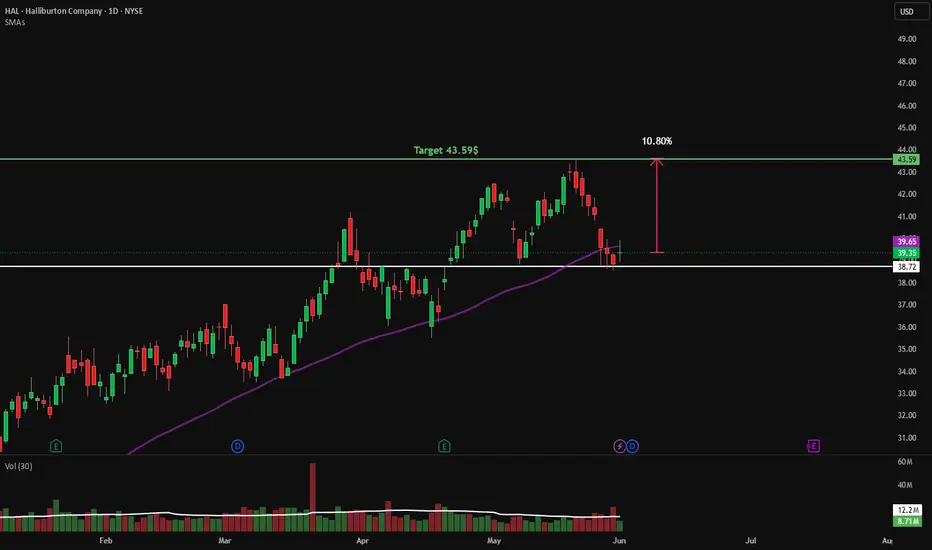
Long Setup with Technical & Fundamental BackingHalliburton (HAL) – Long Setup with Technical & Fundamental Backing
Entry: $41.90
StopLoss: $38.50
Take Profit: $48.80
Risk/Reward: ~1:2.4
Technical View:
HAL is recovering firmly, with an upward trend holding as long as price stays above key support near $40.07.
The stock is consolidating on su
Long
HAL Expansion Setup as Late Buyers Step InAnalysis
Price has closed above the green Value Triangle (VT), confirming acceptance in a late-stage migration. Structure remains valid above the red Boundary Line (BL), with prior VT behaviour supporting continuation. T1 projected from VT; a close below the red BL invalidates the structure.
Secto
Long
Halliburton Wave Analysis – 20 April 2026
- Halliburton reversed from support area
- Likely to rise to resistance level 38.70
Halliburton recently reversed from the support area between the key support level 36.00 (former resistance from February), support trendline of daily up channel from December and the 61.8% Fibonacci correction of t
Long
You Left Without a Reason and So Did Your ProfitsThe trade didn’t fail when price pulled back. It failed when the plan stopped being followed.
On the chart, the trade is defined clearly. The entry is taken at a level where the setup is valid. The stop sits below structure, marking the point where the trade is invalid. Price moves in your favor. T

HAL — Squeeze FIRED at ATH, Volume Divergence Needs WatchingHAL is trading at 40.42 with no futures market. Pure spot read with 618.62M in dollar volume. Price is printing at all-time highs with multiple BOS confirmations stacked on the daily and Demand zones providing structural support well below current price. The chart has been in a sustained uptrend sin
Long
HAL - Halliburton Company
Halliburton Company played a significant role during the Space Race era, contributing to the mission that took astronauts to the moon. Since then, Halliburton has also experienced multiple surges in the stock market, achieving impressive highs reminiscent of lunar landmarks. As it stands, the com
Short
HAL: mid-term and macro structureWatching for price to make at least one more higher-high attempt toward 38–43–46 resistance as long as it holds above 32.
Chart:
While I remain bullish on the macro structure (potential to exceed the 2014 ATH in coming years), price may need more time to digest and form a larger-degree highe

See all ideas
Displays a symbol's price movements over previous years to identify recurring trends.
7.161% YTM
Maturity dateAug 15, 2096
Coupon7.60% (Fixed)
6.183% YTM
Maturity dateNov 15, 2045
Coupon5.00% (Fixed)
6.136% YTM
Maturity dateAug 1, 2043
Coupon4.75% (Fixed)
5.947% YTM
Maturity dateNov 15, 2041
Coupon4.50% (Fixed)
5.871% YTM
Maturity dateSep 15, 2039
Coupon7.45% (Fixed)
5.792% YTM
Maturity dateSep 15, 2038
Coupon6.70% (Fixed)
5.503% YTM
Maturity dateNov 15, 2035
Coupon4.85% (Fixed)
4.989% YTM
Maturity dateMar 1, 2030
Coupon2.92% (Fixed)
4.978% YTM
Maturity dateFeb 1, 2027
Coupon6.75% (Fixed)
See all HALC bonds