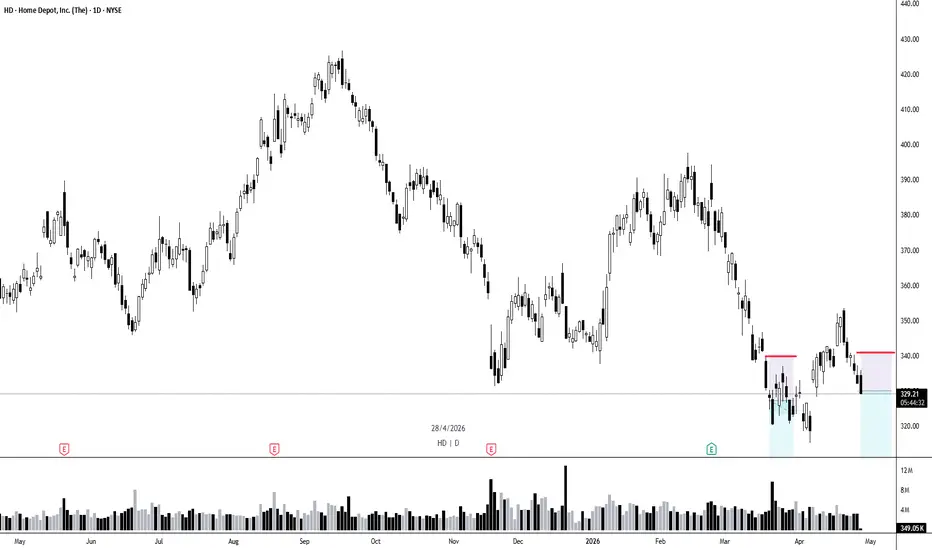
Home Depot: Potential DowntrendHome Depot has struggled for months, and some traders may discern a potential downtrend.
The first pattern on today’s chart is the series of lower highs since last September. Combined with lower lows, those could suggest that sellers are active.
Second, the home-improvement chain’s 50-day simple m
Home Depot, Inc. Shs Cert Deposito Arg Repr 0.03125 Shs
No trades
No trades
590.45 ARS
18.09 T ARS
210.42 T ARS
Details
Sector
Industry
CEO
Edward P. Decker
Website
Headquarters
Atlanta
Founded
1978
IPO date
Apr 19, 1984
ISIN
ARDEUT111705
FIGI
BBG000HGVYW1
Identifiers
ISIN ARDEUT111705
The Home Depot, Inc. engages in the sale of building materials and home improvement products. Its products include building materials, home improvement products, lawn and garden products and décor products. The firm operates through the following geographical segments: U.S., Canada and Mexico. It offers home improvement installation services, and tool and rental equipment. The company was founded by Bernard Marcus, Arthur M. Blank, Kenneth Gerald Langone and Pat Farrah on June 29, 1978 and is headquartered at Atlanta, GA.
Home Depot, Inc. (HD) – Bearish Setup | Target: 332.60 #34Based on my Fibonacci ARC analysis, Home Depot, Inc. (HD) has generated a bearish setup. Price is expected to decline toward 332.60 if the current scenario remains valid.
This analysis is based on the interaction between price and time using Fibonacci ARCs and represents a technical market scenario
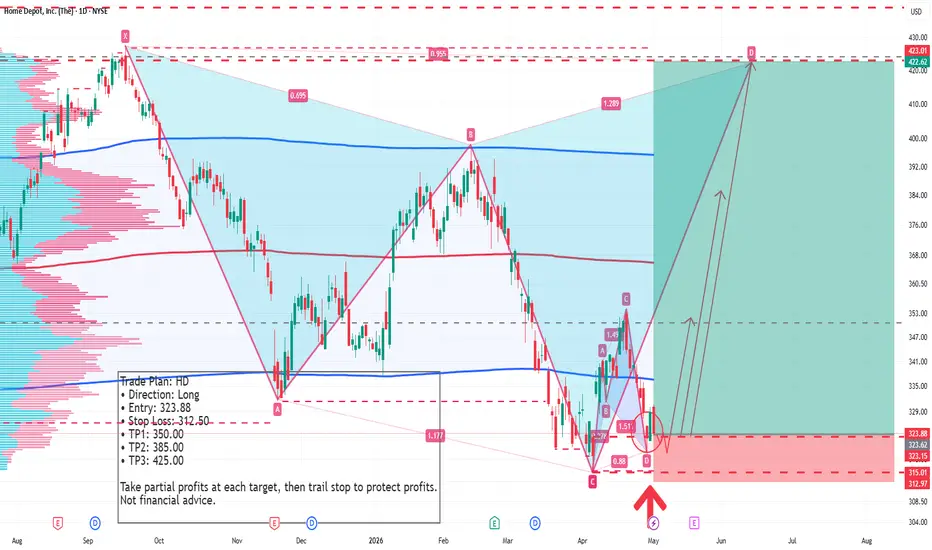
HD Weekly Long Trading PlanHD Weekly Long Trading Plan
Symbol: HD
Timeframe: Weekly Chart
Trade Direction: Long
Entry: Enter long on lower timeframe pullback near $293.95
Stop-Loss: $269.00
Take Profit & Position Management:
1. First target near $350.00: Reduce half position and adjust stop loss for profit protection.
2.
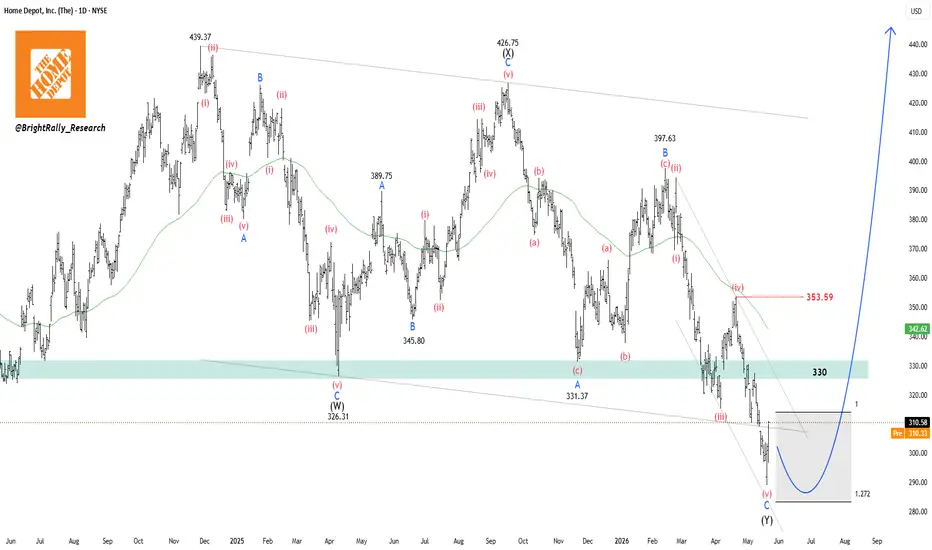
NYSE Home Depot Still Trapped Inside a Corrective ChannelNYSE:HD is still trading under pressure after breaking below the 330 support area. Price continues to make lower highs and lower lows, which keeps the short-term trend weak.
The current decline is now moving into the 300–285 support zone, where the correction could start slowing down. This are
HD is about to test its resistancesHD is in a late-stage Accumulation / early Phase B-C structure. The 52-week low of $289 hit intraday on earnings day before recovering to close at $302 — a textbook Spring or Selling Climax (SC) action. The oversold bounce on heavy volume is consistent with Composite Operator absorption: institution
Home Depot reaffirms guidance despite housing headwindsHD | 4H Technical Analysis — May 20, 2026
Home Depot beat Q1 estimates on both revenue and earnings, and reaffirmed its full-year guidance despite rising oil prices, weakening consumer confidence, and a sluggish housing market. However, same-store sales grew only 0.6% YoY, while transactions decli
HD - A Compelling Bullish Case Ahead of EarningsWith Home Depot (HD) set to release its quarterly earnings report in just a few hours, the market is buzzing. An analysis of both the technical chart and the company's fundamental health reveals a highly favorable confluence of factors for investors seeking a bullish entry. While near-term growth ha
HD TREND BULLISH Home depot - Bullish
Key points :
Tech View :
Weekly - Uptrend and Strong Support Level
Day - Higher High Makes ( Uptrend )
Wait for Little Bit Correction .
Entry - 398 $
Stoploss - 379 $
Target - 429 $
This is Not a Recommendation . Only for Educational Purpose ..
Thank You .. Happy
See all ideas
Summarizing what the indicators are suggesting.
Oscillators
Neutral
SellBuy
Strong sellStrong buy
Strong sellSellNeutralBuyStrong buy
Oscillators
Neutral
SellBuy
Strong sellStrong buy
Strong sellSellNeutralBuyStrong buy
Summary
Neutral
SellBuy
Strong sellStrong buy
Strong sellSellNeutralBuyStrong buy
Summary
Neutral
SellBuy
Strong sellStrong buy
Strong sellSellNeutralBuyStrong buy
Summary
Neutral
SellBuy
Strong sellStrong buy
Strong sellSellNeutralBuyStrong buy
Moving Averages
Neutral
SellBuy
Strong sellStrong buy
Strong sellSellNeutralBuyStrong buy
Moving Averages
Neutral
SellBuy
Strong sellStrong buy
Strong sellSellNeutralBuyStrong buy
Displays a symbol's price movements over previous years to identify recurring trends.
6.025% YTM
Maturity dateJun 25, 2064
Coupon5.40% (Fixed)
6.008% YTM
Maturity dateDec 6, 2048
Coupon4.50% (Fixed)
5.999% YTM
Maturity dateSep 15, 2051
Coupon2.75% (Fixed)
5.985% YTM
Maturity dateJun 15, 2047
Coupon3.90% (Fixed)
5.982% YTM
Maturity dateJun 25, 2054
Coupon5.30% (Fixed)
5.981% YTM
Maturity dateApr 15, 2050
Coupon3.35% (Fixed)
5.976% YTM
Maturity dateApr 15, 2052
Coupon3.63% (Fixed)
5.971% YTM
Maturity dateSep 15, 2052
Coupon4.95% (Fixed)
5.970% YTM
Maturity dateDec 15, 2049
Coupon3.13% (Fixed)
5.954% YTM
Maturity dateMar 15, 2051
Coupon2.38% (Fixed)
5.936% YTM
Maturity dateApr 1, 2046
Coupon4.25% (Fixed)
See all HD.CI bonds