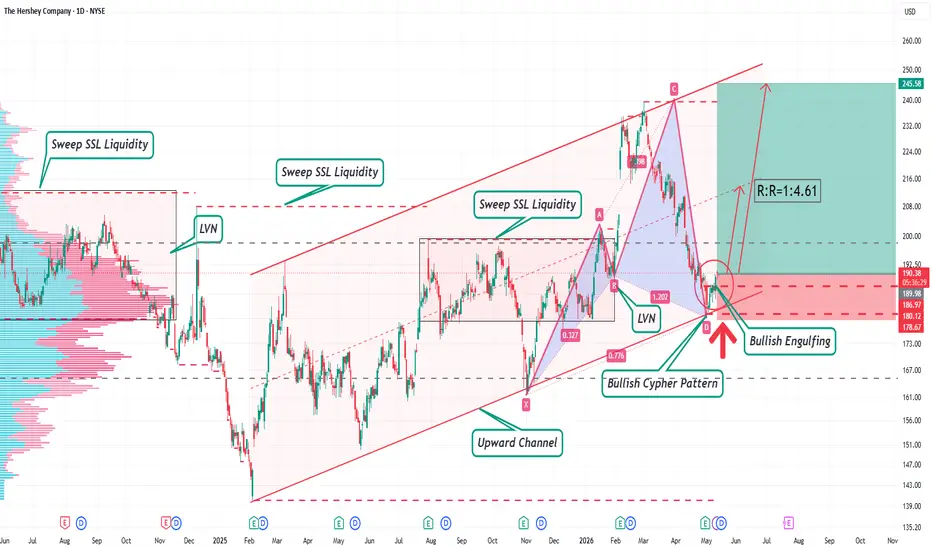
HSY Daily Long Trading PlanHSY Daily Long Trading Plan
Symbol: HSY
Timeframe: Daily
Direction: Long
Entry Price: 190.34
Stop Loss: 178.50
Take Profit & Position Management
1. First Target: 215.00 - Reduce half position, move stop loss to breakeven
2. Second Target: 245.00 - Reduce half of remaining position, adjust prote
Hershey Co Shs Cert Deposito Arg Repr 0.047619047 Shs
No trades
No trades
Compare with Hershey Co Shs Cert Deposito Arg Repr 0.047619047 Shs
350 ARS
1.10 T ARS
14.56 T ARS
Details
Sector
Industry
CEO
Kirk C. Tanner
Website
Headquarters
Hershey
Founded
1894
IPO date
Dec 1, 1927
ISIN
ARDEUT111127
FIGI
BBG000HFP7F8
Identifiers
ISIN ARDEUT111127
The Hershey Co. engages in the manufacture and marketing of chocolate, sweets, mints and confectionery products. The firm operates through the following segments: North America Confectionery, North America Salty Snacks and International. The North America Confectionery segment is responsible for the traditional chocolate and non-chocolate confectionery market position of the company, as well as its grocery and snacks market positions, in the United States and Canada. The North America Salty Snacks segment is responsible for the salty snack products in the United States. The International segment includes the combination of all other operating segments, including those geographic regions where the company operates outside of North America. Its brands include Hershey's, Reese's, and Kisses. The company was founded by Milton S. Hershey in 1894 and is headquartered in Hershey, PA.
HSY rebound setup: traders eye short‑term push above $186Current Price: 182.34 (Analysis was generated on Monday Morning)
Direction: LONG
Confidence level: 45%(Trader snippets contained minimal directional commentary, but available X sentiment was bullish and recent news included an analyst upgrade and earnings beat. With limited but positive signals, a
Sweet Spot: A wrapped gift or a concerning retracement?NYSE:HSY
> This is a retracement down to the 200-W EMA, the quarterly pivot point, COVID's VWAP, and not far off from 23' October lows. With so many confluences, this is indeed a sweet spot!
> But why the drop? at a quick glance i can see that it is EA/fundamentals related, but it may also relat
HSY – Earnings changed the narrativeHershey’s latest earnings were a turning point, not because the quarter was perfect, but because forward expectations moved up.
Management guided 2026 EPS meaningfully above prior consensus, confirming that 2025 is likely the margin trough and that pricing, productivity and cost actions are expecte
HSY in BUY ZONEMy trading plan is very simple.
I buy or sell when either of these events happen:
* Price tags the top or bottom of parallel channel zones
* Money flow volume spikes beyond it's Bollinger Bands
So...
Here's why I'm picking this symbol to do the thing.
Price in buying zone at bottom of channels
M
The Hershey Company (HSY) Leads Global Confection MarketThe Hershey Company (HSY) is one of the world’s most iconic confectionery brands, producing chocolate, candy, snacks, and baking products loved by consumers globally. Beyond its flagship Hershey’s chocolate, the company’s portfolio includes Reese’s, Kit Kat, and SkinnyPop. Hershey’s growth is fueled
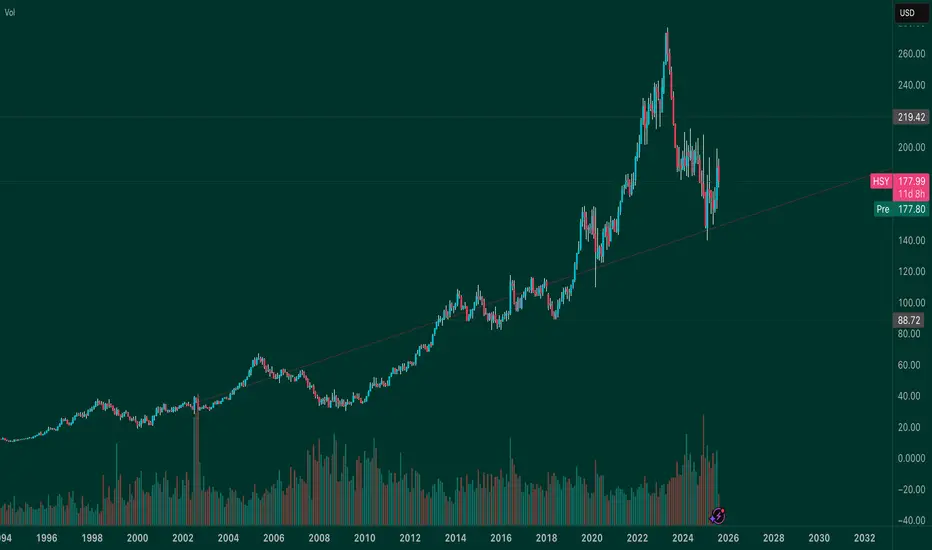
Time to buy more chocolates - HSYFor nearly 2 years, the price of HSY has been falling , from a high of 280 to a 50% fall of 141 before it climb back up recently to 175. It is still in the downtrend as shown on the weekly chart.
Yesterday, it rally near 6% , a welcoming surprise to its shareholders. With continuing drop in cocoa p
Hershey about to get sweet! NYSE:HSY has been under pressure for the last 3 months since it put in the mega monthly reversal candle.
This is a clinical retrace and backtest of a key upsloping trend line and monthly bullish reversal.
It was good to see Hershey remaining strong and closing positive while markets were under
See all ideas
Summarizing what the indicators are suggesting.
Oscillators
Neutral
SellBuy
Strong sellStrong buy
Strong sellSellNeutralBuyStrong buy
Oscillators
Neutral
SellBuy
Strong sellStrong buy
Strong sellSellNeutralBuyStrong buy
Summary
Neutral
SellBuy
Strong sellStrong buy
Strong sellSellNeutralBuyStrong buy
Summary
Neutral
SellBuy
Strong sellStrong buy
Strong sellSellNeutralBuyStrong buy
Summary
Neutral
SellBuy
Strong sellStrong buy
Strong sellSellNeutralBuyStrong buy
Moving Averages
Neutral
SellBuy
Strong sellStrong buy
Strong sellSellNeutralBuyStrong buy
Moving Averages
Neutral
SellBuy
Strong sellStrong buy
Strong sellSellNeutralBuyStrong buy
Displays a symbol's price movements over previous years to identify recurring trends.
5.958% YTM
Maturity dateAug 15, 2046
Coupon3.38% (Fixed)
5.886% YTM
Maturity dateNov 15, 2049
Coupon3.13% (Fixed)
5.787% YTM
Maturity dateJun 1, 2050
Coupon2.65% (Fixed)
5.078% YTM
Maturity dateFeb 24, 2035
Coupon5.10% (Fixed)
4.904% YTM
Maturity dateMay 4, 2033
Coupon4.50% (Fixed)
4.862% YTM
Maturity dateFeb 24, 2032
Coupon4.95% (Fixed)
4.790% YTM
Maturity dateJun 1, 2030
Coupon1.70% (Fixed)
4.688% YTM
Maturity dateNov 15, 2029
Coupon2.45% (Fixed)
4.688% YTM
Maturity dateFeb 24, 2030
Coupon4.75% (Fixed)
4.685% YTM
Maturity dateMay 4, 2028
Coupon4.25% (Fixed)
4.457% YTM
Maturity dateAug 15, 2027
Coupon7.20% (Fixed)
See all HSY bonds