Shopify, Inc. Cert Deposito Arg Repr 0.0093458 Sh -A-
No trades
No trades
0.010โฏUSD
โช1.06โฏBโฌโฏUSD
โช9.92โฏBโฌโฏUSD
โ
Details
๏ปฟSector
CEO
Tobias Albin Lรผtke
Website
Headquarters
Ottawa
Founded
2004
IPO date
May 21, 2015
ISIN
ARBCOM460341
FIGI
BBG020MGGRC7
Identifiers
ISIN ARBCOM460341
Shopify, Inc. is a global commerce company that provides essential internet infrastructure for commerce, offering trusted tools to start, scale, market, and run a retail business of any size. The Company's software enables merchants to run their business across all of their sales channels, including web and mobile storefronts, physical retail locations, social media storefronts and marketplaces. The Shopify platform provides merchants with a single view of their business across all of their sales channels and enables them to manage products and inventory, process orders and payments, fulfill and ship orders, build customer relationships, source products, leverage analytics and reporting and access financing, all from one integrated back office. The company was founded on September 28, 2004 and is headquartered in Ottawa, Canada.
$SHOP: Two Locks Overhead. 172 First, Then 183TSX:SHOP has been quietly building something. Bullish RSI divergence at the May low near 130. Price made a lower low, RSI made a higher low. That was the warning. The bounce that followed wasn't random.
Since then it reclaimed the 20, 50 and 100 EMAs one by one. Now there are two locks overhead,
Shop ready to break towards the highNASDAQ:SHOP
Looking at 8/21 135c at EOD assuming this doesn't completely reverse.
This looks good sitting on a high time frame trendline. It was ranging right on top of the 50% drawdown area. It dropped into a target fib area, reclaimed the range and held. It looks ready to break now. I would expec
$SHOP mapping a bearish ๐๐=๐๐ off the June 15 high.๐ฆ๐๐ข๐ฃ ยท ๐ญ๐ฑ๐บ ยท June 21, 2026
NASDAQ:SHOP mapping a bearish ๐๐=๐๐ off the June 15 high.
๐ฆ๐๐ฟ๐๐ฐ๐๐๐ฟ๐ฒ
A = 114.95
B = 106.19
C = 109.66 (0.618 retrace of AB, current rejection)
D = ๐ญ๐ฌ๐ฌ.๐ฑ๐ณ (target)
The D level is confluent two ways. It marks the 1.618 extension of the AB swing and the 2.618 reciprocal o
SHOP โ Daily/15m โ Bearish lean, level-gatedSHOP โ Daily/15m โ Bearish lean, level-gated
Reading the weight of evidence as down-leaning here, but gated on one level. Direct on the bias, honest on the invalidation.
BEAR CASE โ confluence:
1. Structure: rejection at ~114 โ lower high โ break under 0.702 fib (108.54). A-B-C topping into double
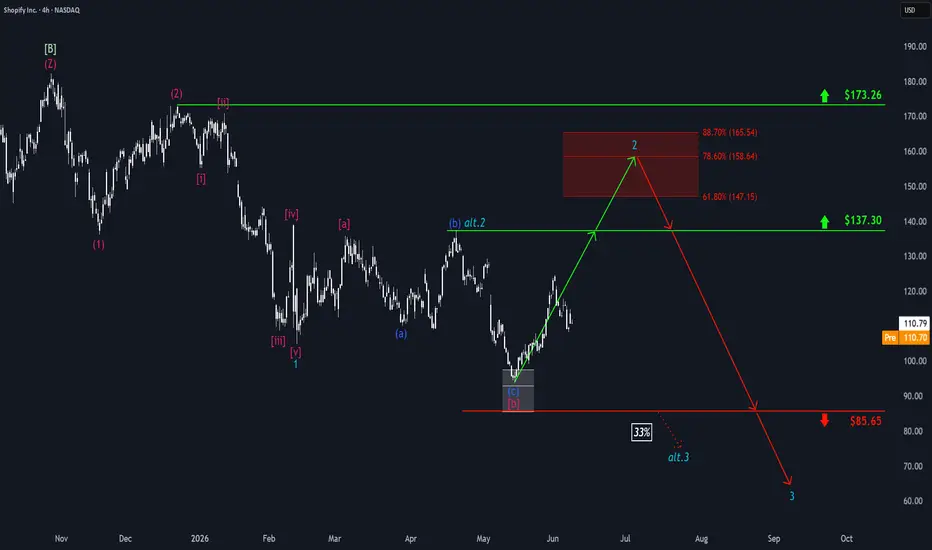
Shopify: Moved Higher, Then SlippedShopify was recently able to achieve further gains but then lost its footing and slipped noticeably lower. Only recently did the first signals to the upside begin to emerge again. We currently see SHOP in a corrective upward movement, which should fade in our red Target Zone ($147.15โ$165.54). After
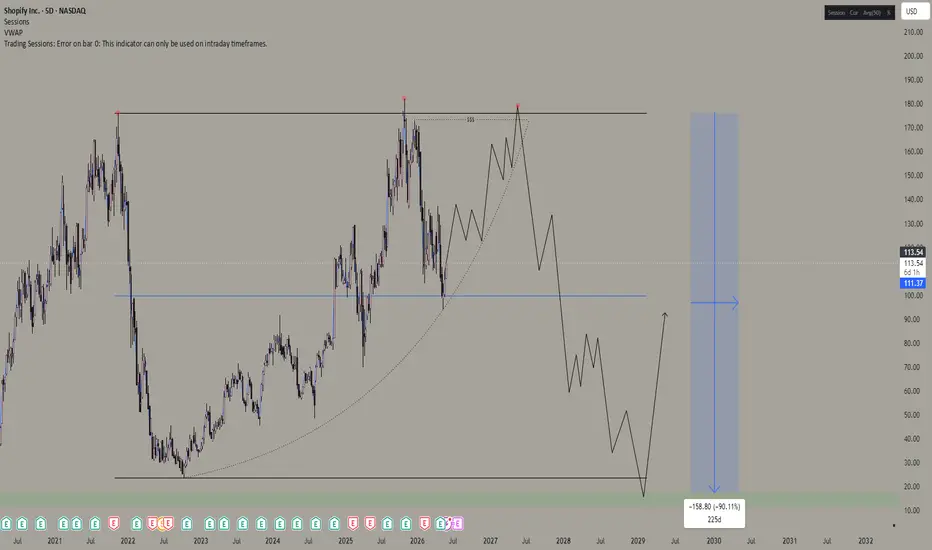
Shopify - Potential 90% drop ???Shopify is showing a clean macro liquidity curve that could be developing into a much larger distribution model.
If this structure confirms with a clear HTF bearish close / structural breakdown , the downside potential could be brutal โ possibly even a 90% macro reset from the highs.
I know tha
Shopify long tailed monthly candleNASDAQ:SHOP is forming a long tailed monthly candle, historically that has indicated a trend reversal
* 115 will be a big resistance as 50DSMA and 100WSMA are present there and about to cross
* looking for it to test the upper descending trendline at 124 ish which also lines up with 100DSM
SHOP - RejectSHOP is currently a clear rejection. The stock has broken below all its major moving averages with relative strength failing across the board and zero bullish alignment showing up. Distribution is dominating as the structure sits broken beneath the SMA20 and SMA50 cluster with no relative strength s
Shopify: Strong Company Below Key Moving Averages
One of the names Iโve been watching closely is Shopify ( NASDAQ:SHOP ) on the weekly chart.
We are currently in a resistance zone with a bullish trend trying to develop. The stock is still trading below the 200-day, weekly, and monthly moving averages. Personally, I like buying quality blue chips
See all ideasย
Summarizing what the indicators are suggesting.
Oscillators
Neutral
SellBuy
Strong sellStrong buy
Strong sellSellNeutralBuyStrong buy
Oscillators
Neutral
SellBuy
Strong sellStrong buy
Strong sellSellNeutralBuyStrong buy
Summary
Neutral
SellBuy
Strong sellStrong buy
Strong sellSellNeutralBuyStrong buy
Summary
Neutral
SellBuy
Strong sellStrong buy
Strong sellSellNeutralBuyStrong buy
Summary
Neutral
SellBuy
Strong sellStrong buy
Strong sellSellNeutralBuyStrong buy
Moving Averages
Neutral
SellBuy
Strong sellStrong buy
Strong sellSellNeutralBuyStrong buy
Moving Averages
Neutral
SellBuy
Strong sellStrong buy
Strong sellSellNeutralBuyStrong buy
Displays a symbol's price movements over previous years to identify recurring trends.