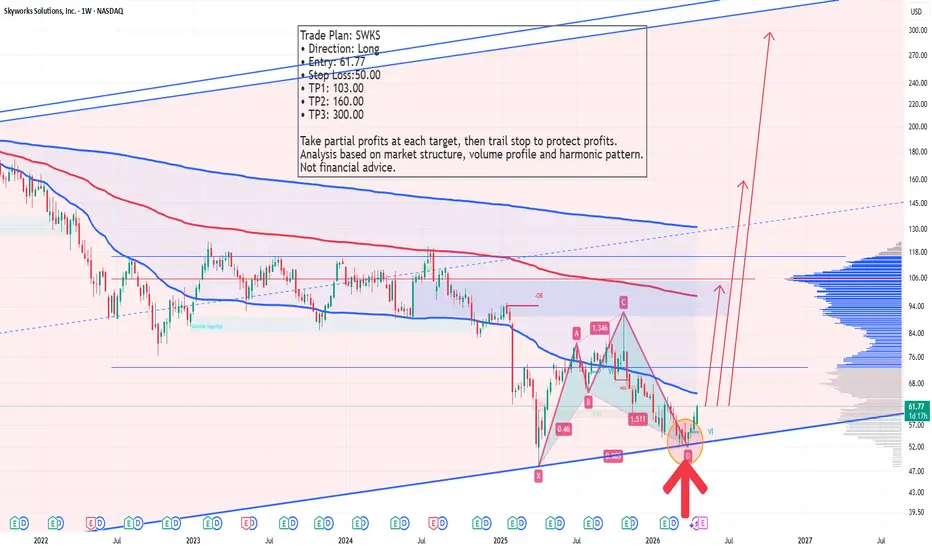
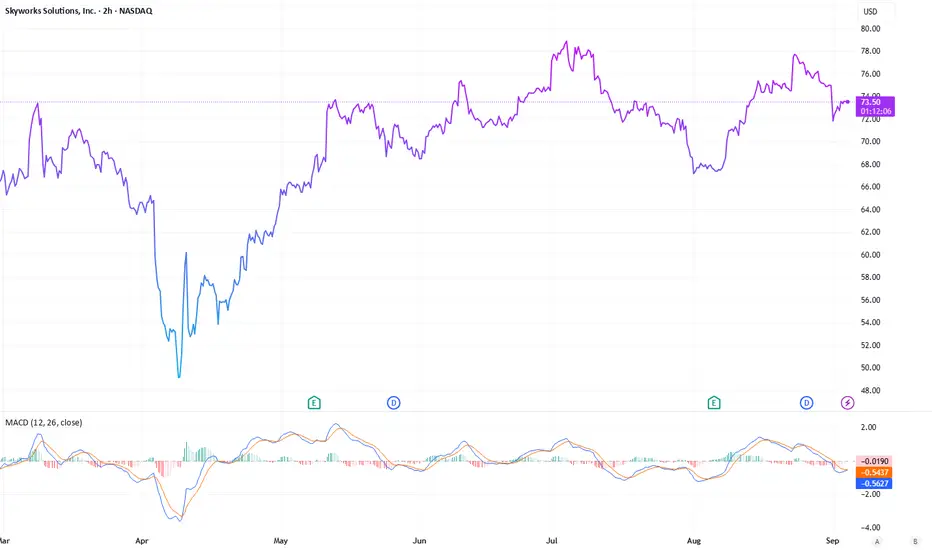
SWKS | June, 2026 | Continued stock growth- Timeframe: Weekly
- Trade type: Buy stop order
- Price: 78.89
- Take Profit: Open
- Stop Loss: 69.37 (-12.10 %)
Idea: Long on a breakout above last week's high — bullish momentum continuation.
Entry: Buy stop above last week’s high.
Stop-loss: Below the low of the same candle.
If the weekly candle closes below this level, the trade is invalidated.
Take Profit: Trailing stop following the lows of new weekly candles.
Feel free to like and share your thoughts in the comments! ❤️
Skyworks Solutions, Inc. Shs Cert Deposito Arg Repr 0.0476190476 Shs
No trades
No trades
In-depth trading ideas
Skyworks Solutions (SWKS)Skyworks Solutions (SWKS) — Buy Idea (Trend Reversal)
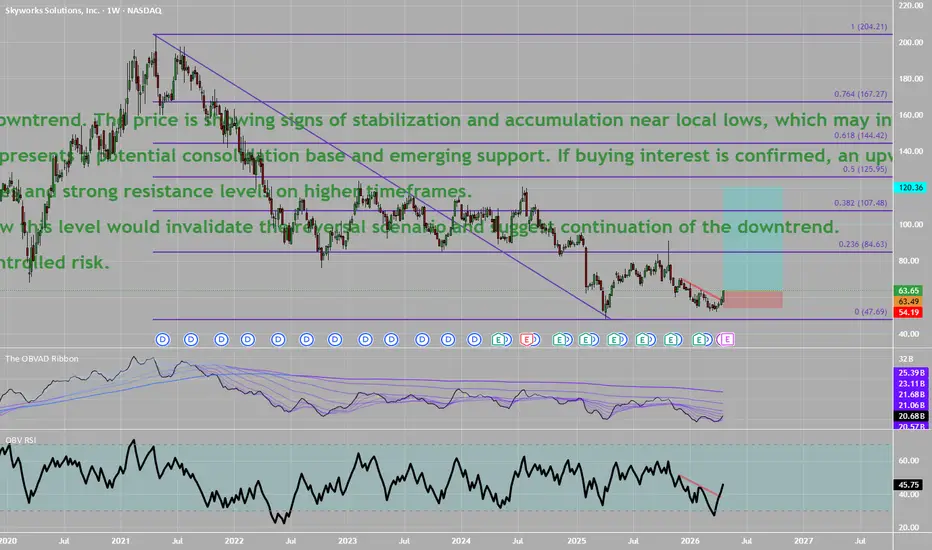
A potential mid-term reversal scenario is being considered after a prolonged downtrend. The price is showing signs of stabilization and accumulation near local lows, which may indicate weakening selling pressure and a gradual shift in control toward buyers.
The 63–65 zone is viewed as an attractive area to build a long position, as it represents a potential consolidation base and emerging support. If buying interest is confirmed, an upward impulse could develop, leading to a sustained move higher.
The target is set at 120, corresponding to a return to previous distribution zones and strong resistance levels on higher timeframes.
Risk is managed with a stop-loss at 54, below a key support level. A break below this level would invalidate the reversal scenario and suggest continuation of the downtrend.
Idea: early positioning for a trend reversal with strong upside potential and controlled risk.
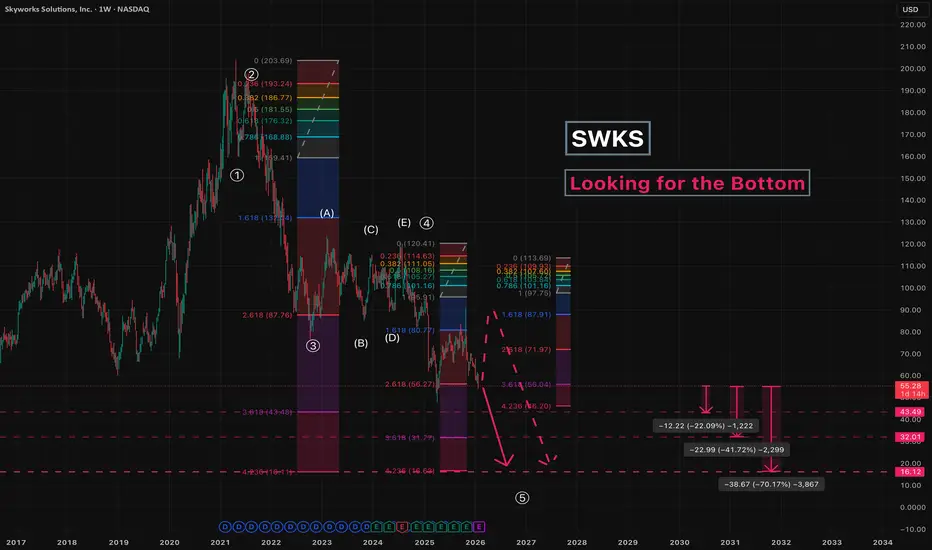
SWKS - Looking for the BottomSince April 2021, a five -wave impulsive decline has been developing.
Only the fifth wave and its internal sub-waves remain to be completed.
At this stage, caution is advised - price may rebound toward the 91 area before starting the final leg down.
Key targets:
43
32
16
Estimated downside potential from current levels:
22–70%
---
Please subscribe and leave a comment!
You’ll get new information faster than anyone else.
---
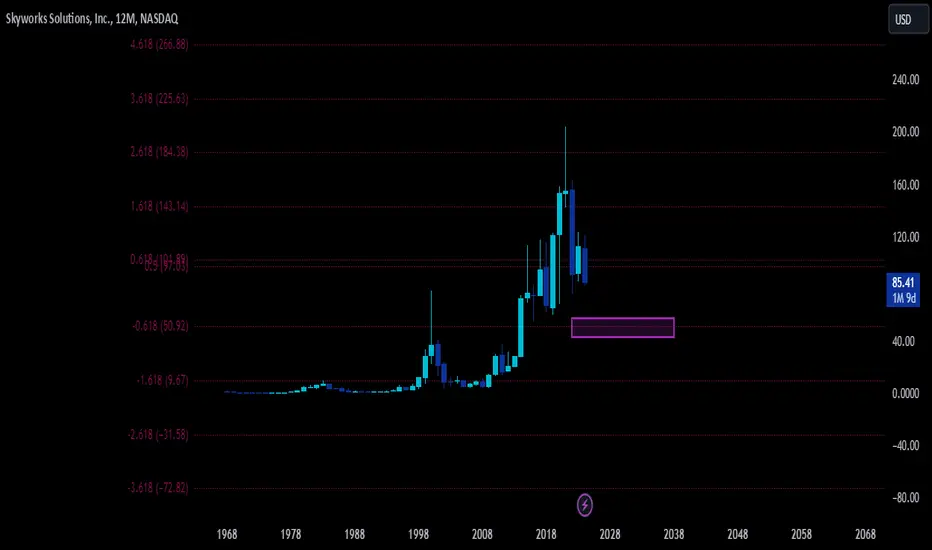
SWKS Monthly: Cycle Low Testing NowSWKS monthly structure is deeply bearish, with price in a multi-year downtrend from 2021–2022 peaks above $180, now grinding toward the low $50s after a series of lower lows and closes below key monthly moving averages. Oversold conditions are extreme, but lack of higher highs keeps sellers in control until structural support at prior cycle lows is tested
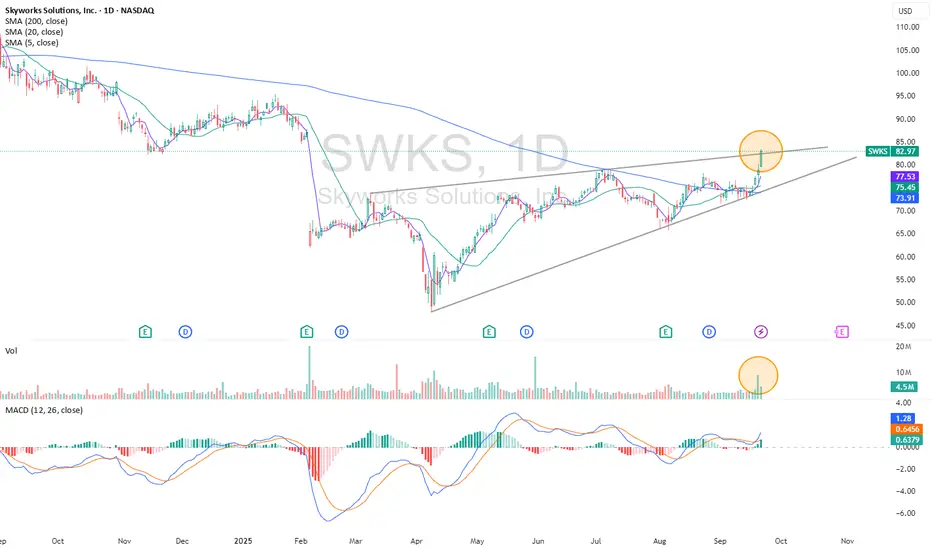
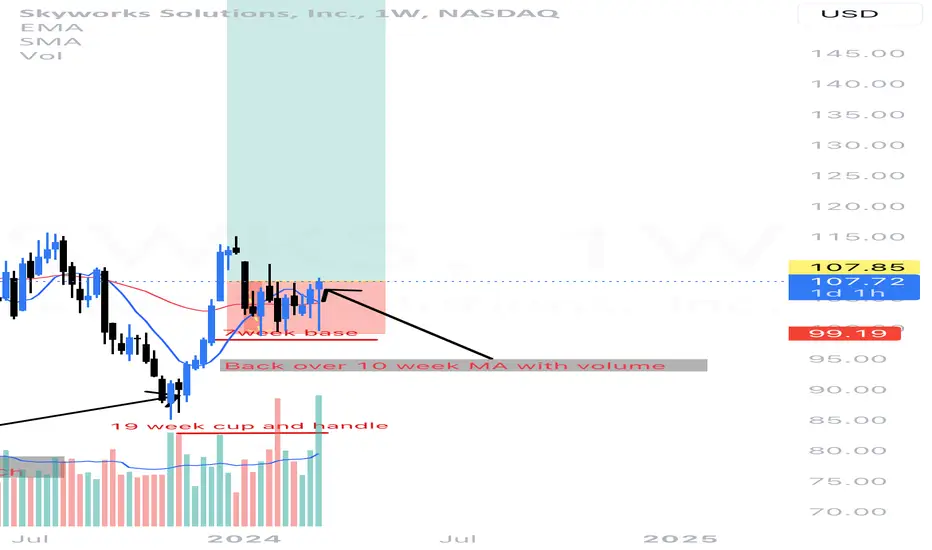
SWKS: Bullish continuation triangleSWKS has been on an upward momentum in recent days after reclaiming its 200dma. It has also broken out of its bullish continuation triangle with healthy volume. It has also filled its previous gap down in February this year after disappointing results. As its 200dma line starts to flatten and potentially curves upward, it is likely SWKS could continue its bullish path.
Skyworks Solutions & Semiconductor OpportunitiesLet’s also consider semiconductor firms, with a focus on those I’m currently monitoring. The initial company is Skyworks Solutions NASDAQ:SWKS .
I recall observing it previously, and recently, I noted its price has dropped further than expected. The stock has declined from a high of $200 to a low near $50, occasionally dipping below, representing a nearly fourfold reduction over roughly three years. A potential speculative upturn or a resumption of its long-established growth pattern may be on the horizon.
Notably, its Forward P/E ratios stand at 30 and 18. This company recently announced that its chief financial officer, who previously held this position, will be returning. He left, worked at AMD NASDAQ:AMD for a while, and then returned to Skyworks. The market views this news as positive. So, what do Skyworks do? They specializes in producing digital radio receivers, antenna tuners, demodulators, detectors, filters, front-end modules, and low-noise amplifiers. Its products serve industries like aerospace, automotive, and defense. Currently, it holds a notable position, with both strengths and weaknesses relative to competitors, including Qorvo NASDAQ:QRVO , Murata TSE:6981 , Qualcomm NASDAQ:QCOM , and Broadcom NASDAQ:AVGO .
It commands a 16% market share, an average figure, with Murata showing stronger metrics and Broadcom at 22%. The expansion of 5G technology presents Skyworks an opportunity to grow its share, leveraging unique advancements not held by leaders like Murata. However, its reliance on smartphone sales, a stable demand driver, is offset by risks. For instance, Apple’s in-house development could erode Skyworks’ revenue, given Apple NASDAQ:AAPL accounts for 59% of its income-a significant dependency also seen with Qorvo (30%), Broadcom (15%), and Qualcomm (20%).
Turning to price trends, both Qorvo and Skyworks lag behind their historical peaks. This led me to explore ETFs covering this sector, identifying three major options. I selected the VanEck fund, ticker SMH, which is currently at its high. This fund includes Broadcom, Skyworks, Qualcomm, and others, dominated by strong performers like NVIDIA NASDAQ:NVDA , TSMC BCBA:TSMC , Broadcom, and AMD. Given their market weight, investing via SMH may be prudent, despite its elevated level.
Target prices include $110 for Qorvo. For Skyworks, Goldman Sachs estimates $70, below the current price, advising against purchase. Nonetheless, the company warrants attention. A cautious approach might favor the SMH ETF over direct stock investment.
2/6/25 - $swks - Premkt $63, why not swing long2/6/25 :: VROCKSTAR :: NASDAQ:SWKS
Premkt $63, why not swing long
- did a (private) review of the semis names i've tracked over the years in early Jan to get a start on the year... and NASDAQ:SWKS was a pass
- that being said, 10% fcf yield *seems* to be the place where markets trade stocks (at least in today's tape) WITH growth/and or terminal value issues, more the thumb than the rule and definitely not the rule of thumb (which is interesting and a bit odd if you've ever looked into that... i digress)
- swinging this only
- with such a dramatic move, vol at open could be huge but i think i probably lose 5% at most near $63 and perhaps the upside should be back toward -20% so it's a 2-1 look for me more or less.
- small position. licking wounds at the moment but still net net a good YTD performance (though we always measure ourselves from the high water mark). NASDAQ:PI is going to murder me today - i'll probably blow out of that and just wait out the storm without the distraction on my PnL... again digress.
whatchu think anon?
V
Trade filter with volumeNASDAQ:SWKS
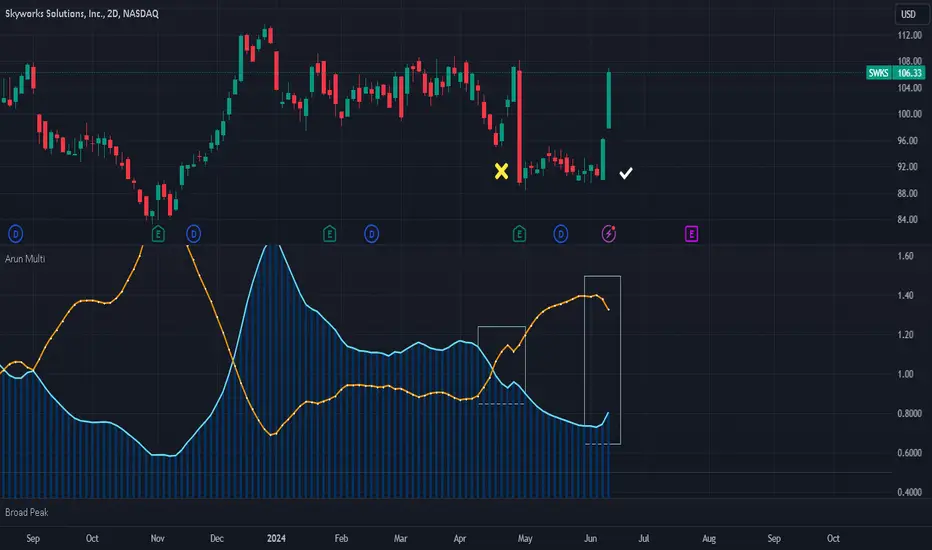
Chart shows NASDAQ:SWKS with 2 similar long breakout patterns. So why we take one trade but ignore the other? The answer is volume. We want volume to be on our side or otherwise the price maynot be "ready" for the move.
For volume we need to look at the daily timeframe.
Using a customized volume oscillator bassed on Chaikin Money Flow and On Balance, we filter trades whereby volume must be ascending at the time of long entry and vice versa for shorts.
We note that the first move failed also in part due to the release of quarterly results so it is nartual that volume during the week prior is relatively low.
SWKS Foresight BullishAssalamualaikum
Hi there, this is my technical analysis point of views. There are some factor that i consider that SWKS going for Bullish.
- As per Risk Reward ratio is 4.33
- Uptrend is intact
- Price currently setting up symmetrical triangle
- Enough 5 waves in the symmetrical triangle
- Detect hidden bullish divergence.
SWKS Skyworks Solutions Options Ahead of EarningsAnalyzing the options chain and the chart patterns of SWKS Skyworks Solutions prior to the earnings report this week,
I would consider purchasing the 105usd strike price at the money Calls with
an expiration date of 2024-2-2,
for a premium of approximately $2.85.
If these options prove to be profitable prior to the earnings release, I would sell at least half of them.
SKYWORKS Stock Chart Fibonacci Analysis 122123 Trading Idea
1) Find a FIBO slingshot
2) Check FIBO 61.80% level
3) Entry Point > 115/61.80%
Chart time frame : C
A) 15 min(1W-3M)
B) 1 hr(3M-6M)
C) 4 hr(6M-1year)
D) 1 day(1-3years)
Stock progress : B
A) Keep rising over 61.80% resistance
B) 61.80% resistance
C) Hit the bottom
D) Hit the top
Stocks rise as they rise from support and fall from resistance. Our goal is to find a low support point and enter. It can be referred to as buying at the pullback point. The pullback point can be found with a Fibonacci extension of 61.80%. This is a step to find entry level. 1) Find a triangle (Fibonacci Speed Fan Line) that connects the high (resistance) and low (support) points of the stock in progress, where it is continuously expressed as a Slingshot, 2) and create a Fibonacci extension level for the first rising wave from the start point of slingshot pattern.
When the current price goes over 61.80% level , that can be a good entry point, especially if the SMA 100 and 200 curves are gathered together at 61.80%, it is a very good entry point.
As a great help, tradingview provide these Fibonacci speed fan lines and extension levels with ease. So if you use the Fibonacci fan line, the extension level, and the SMA 100/200 curve well, you can find an entry point for the stock market. At least you have to enter at this low point to avoid trading failure, and if you are skilled at entering this low point, with fibonacci6180 technique, your reading skill to chart will be greatly improved.
If you want to do day trading, please set the time frame to 5 minutes or 15 minutes, and you will see many of the low point of rising stocks.
If want to prefer long term range trading, you can set the time frame to 1 hr or 1 day.
BatM pattern that landed near the .886. Peak 2 is lower than peak 1.
Since this is a crooked M pattern it can be called Bullish as it reverses UP at the end of the 4th leg which is Down.
Symmetrical triangle noted at price is at the resistance line with more resistance overhead.
If one ere in this stock already, one may hang on to see if resistance is broken.
I like this stock but will watch to se if the resistance can be broken.
Financially healthy company that has not performed as well as many Semiconductor stocks this year.
No recommendation.
52 Week Range
76.16
123.69
Day Range
107.80
110.62
EPS (FWD)
8.39
PE (FWD)
13.10
Div Rate (FWD)
$2.48
Yield (FWD)
2.26%
Short Interest
2.85%
Market Cap
$17.49B
Volume
869,606