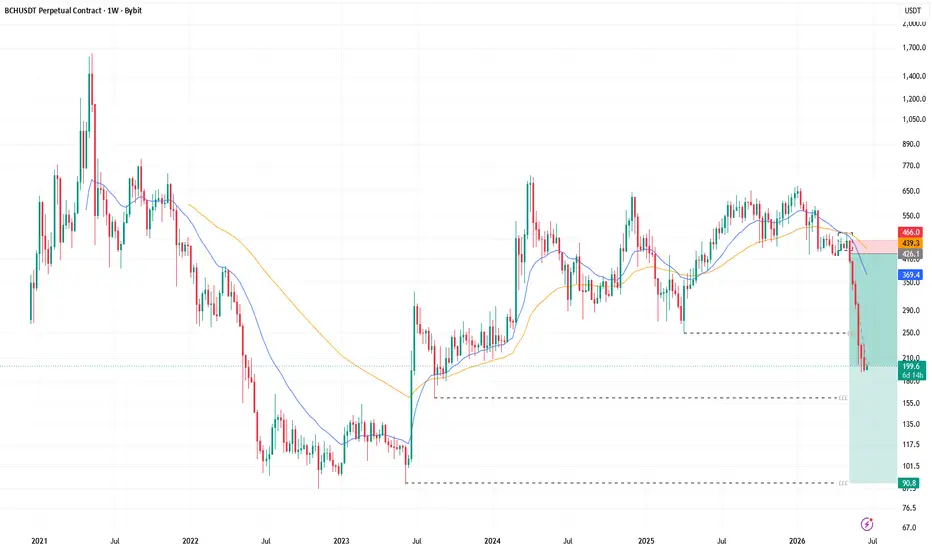
BCHBITCOIN CASH BUY zone 150-200 SL 140 TP 500 TP 850 TP 1050 TP 1350 TP 1500 reason confluX OTE FVGLongby ASHxBILLIONAIRE2
$BCH/USDT ANALYSISBitcoin Cash remains in a long-term bearish trend after breaking down from a large rising wedge. The sharp decline has already met its projected downside target, and price is now moving sideways, suggesting a period of accumulation rather than a confirmed trend reversal. 📍 Current Price: ~215 USDT 🟢 Major Support: 180 USDT 🔴 Immediate Resistance: 240–250 USDT Bullish Scenario If BCH breaks above the current consolidation range with strong volume, it could begin a recovery toward higher resistance levels. 🎯 Target 1: 250 USDT 🎯 Target 2: 300 USDT 🎯 Major Target: 360 USDT Bearish Scenario If the 180 USDT support fails, sellers could regain control and push BCH toward fresh lows. 📉 Key Support: 180 USDT ⚠️ Invalidation: Daily close below 180 USDT Market Outlook: Neutral. The rising wedge breakdown played out as expected, and BCH is now consolidating near a major support area. A breakout above 240–250 USDT would be the first sign that bullish momentum is returning.Shortby crypto_vulture_signals1
BCH’s Trap Is Almost Ready - Will Bulls Take Control Next?Yello Paradisers! Are you prepared for a potential sharp move on #BCH, or are you still underestimating what’s quietly building behind the scenes? At first glance, this structure might seem like a simple and healthy pullback. But when we strip away emotions and analyse the chart objectively, a completely different narrative emerges. This is not random price action — this is a high-risk, high-opportunity zone where discipline matters far more than opinions. 💎#BCH has recently printed a classic Selling Climax, followed by a Climactic Action candle backed by ultra-high volume. This is a textbook probability that accumulation may be developing. Historically, this type of behaviour often appears when smart money starts positioning before a larger move. To inexperienced traders, it may look like noise. But for experienced traders, this kind of volume reaction carries serious weight. 💎#BCH swept the Selling Climax with an Automatic Rally structure and then aggressively breaking above the Automatic Rally trend-line with strong momentum. This is a key probability. It suggests weak hands are being forced out of the market while stronger participants continue accumulating positions with confidence. 💎#BCH breaks above the upper trigger line of selling climax with a strong momentum candle adding more confluence for the bullish probability. If the prices sustain this momentum, the next upside path can open toward 251, which is currently acting as a major structural resistance level. 💎#BCH The broader structure has now shifted toward the bullish side. During the retracement, prices tested the four-hour order block, while momentum gradually began turning upward again. 💎A clear RSI divergence is also visible, adding further confirmation to the bullish probability. As long as prices holds momentum inside the order block and fair value gap zone, the structure remains constructive. The first major resistance level to monitor is 238. A decisive break and sustained acceptance above this area would strengthen the probability of further continuation toward 251. 💎If #BCH fails to hold bullish momentum and a momentum candle closes below 208, the current bullish probability becomes invalid. In that case, we could see further downside pressure. That is why Paradisers, we are playing it safe right now. If you want to be consistently profitable, you need to be extremely patient and always wait only for the best, highest probability trading opportunities only on confirmations. MyCryptoParadise iFeel the success🌴Longby MyCryptoParadise4
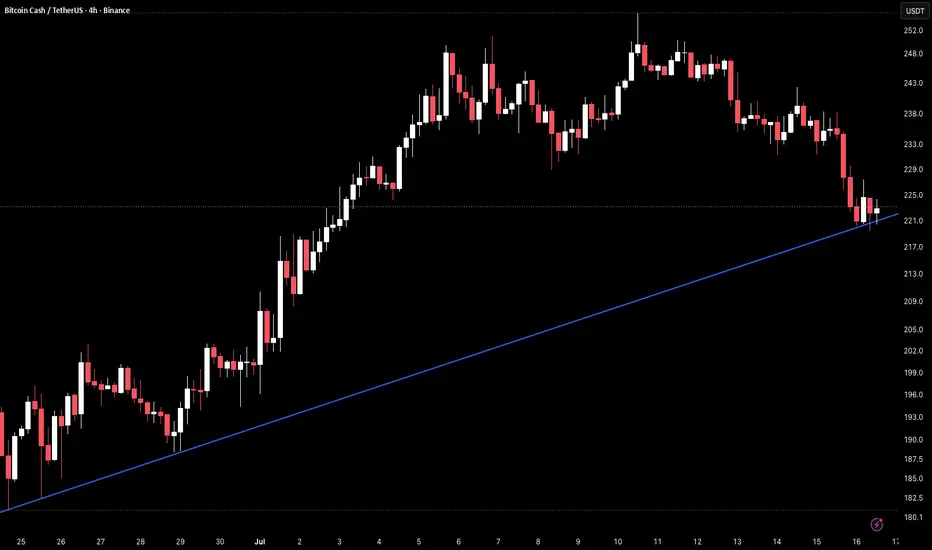
BCH 4H – Rising Trendline Test After Pullback From HighsBCH on the 4H timeframe is currently trading around 223.3 after pushing from the rising trendline near 190 in late June all the way to a high near 252 on July 10 before sellers pushed price back through the 225.0 horizontal level, with the rising trendline now climbing into the 217–220 area and approaching as the next key test. The chart shows a rising trendline originating from the late June low near 182–184, connecting the June 29 higher low near 190 and continuing to climb steeply through the entire visible structure. Price broke above the 225.0 horizontal level in early July on a sustained rally that reached 252 before rolling over. The selloff from that high has been steady, pulling price back through 238, 233, and now below 225.0 which had previously acted as a consistent pivot across the left side of the chart and is now being lost. The rising trendline is currently climbing into the 217–220 zone and is the only remaining upward structure beneath current price, with no meaningful horizontal support between the 225.0 broken level and the trendline below. Price has lost the 225.0 horizontal level and is now approaching the rising trendline with momentum still pointing lower, making the trendline test the most important level to watch on this chart. Key Levels To Watch → 250.0–252.0 – July high, major resistance above → 243.0–246.0 – Prior consolidation zone, resistance → 233.0–235.0 – Mid-range resistance zone → 225.0–227.0 – Broken horizontal support, now resistance → 221.0–223.0 – Current price, minor support → 217.0–220.0 – Rising trendline, dynamic support (climbing) → Below 210.0 – Trendline breakdown, extended downside A hold at the rising trendline near 217–220 and a recovery back above 225.0–227.0 would confirm the trendline as active support and reopen the path toward 233–235 and potentially a retest of the July high near 250–252 on continuation. A confirmed 4H close below the rising trendline near 217–220 would break the only upward structure on this chart, removing the trendline that has defined every significant low since late June and opening downside toward 210 and below with no clear support in between. Pullback from July high now pressing into rising trendline, key test approaching. Hold 217–220 trendline and reclaim 225.0 → recovery resumes, eyes on 233–252. Lose trendline → structure broken, downside toward 210 and below. Bias bullish above rising trendline. Shift only on confirmed close below 217–220.by BKVIP1
#BCHUSDT ANALYSIS (1D Timeframe)BCHUSDT is trading inside a descending channel, indicating that the broader trend remains bearish. Price recently faced rejection near the upper channel resistance and is now drifting back toward the middle of the channel. 📍 Current Price: ~212 USDT 🟢 Key Support: 180–190 USDT 🔴 Key Resistance: 224–245 USDT Bullish Scenario A daily close above the descending channel resistance would invalidate the bearish structure and could trigger a stronger recovery. 🎯 Breakout Target: 224.49 USDT 🎯 Extended Target: 245–260 USDT if bullish momentum continues. Bearish Scenario As long as BCH remains below the channel resistance, sellers retain control. 📉 Downside Target: 190 USDT 📉 Major Support: 180 USDT ⚠️ Invalidation: A daily close above 245 USDT would invalidate the bearish outlook. Market Outlook: Bearish to Neutral. BCH remains trapped inside a descending channel. Until buyers reclaim the upper trendline, the probability favors continued consolidation or another move toward the lower support zone.by crypto_vulture_signals0
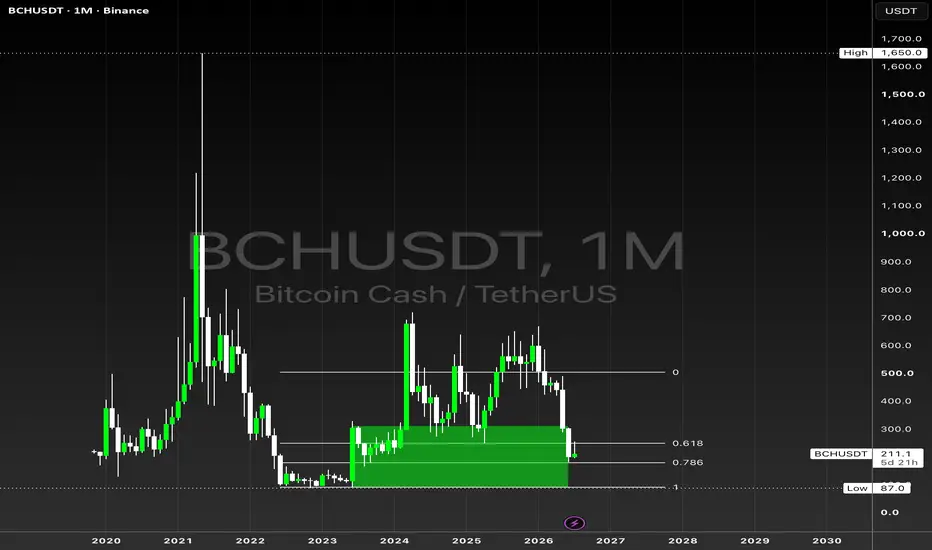
Bitcoin Cash (BCH): Accumulation Zone Before the Next Bull CycleBitcoin Cash is approaching a major long-term support area while trading inside what could become a new accumulation range. The focus should not be on predicting the exact bottom, but on observing how price behaves inside the highlighted box. If BCH spends time building a base in this region, history suggests it could be preparing for a new bullish cycle. The key confirmation will come only after: Price stabilizes inside the accumulation zone. A bullish market structure develops. The long-term descending trendline is broken. A breakout above the downtrend would be a strong technical signal that accumulation has ended and a new uptrend may be beginning. For now, I see this area as an opportunity to gradually accumulate, rather than chase higher prices after confirmation. Patience is essential. Markets often spend months building a foundation before the next major move. Watch the box. If accumulation develops here and the long-term downtrend breaks, BCH could be entering a new bull cycle. This is not financial advice. Always do your own research and manage your risk.by finalmenterico0
$BCH: Buyers Stepped In and Price Didn't Move. PDL Is NextSET:BCH 15m look. Price is in a range on the lower timeframes and on the higher ones too. We have two levels right now, the previous day high and the previous day low. Price already came into PDL and got an aggressive reversal from there, one that couldn't break structure. It all ended in a plain sweep around 237.48 and a return to 0.5. Same thing the second time. Right now we've got signs of weakness and price is going to check the level near PDL once more. For a better RR a good entry would be the zone near SIBI (236.25) with invalidation above 238.22. Invalidation means a hold above, specifically. Price holds above 238.22 and the scenario is dead. Taker delta flipped positive locally but price is barely reacting. If buyers can't push price up hard and we get absorption near SIBI, the scenario with another visit to PDL stays live.by flipondip1
BCH Ready for Its Next Expansion?Yello Paradisers, Are traders waiting for confirmation while #BCH is already displaying a textbook Wyckoff accumulation before its next expansion? 💎#BCHUSDT has completed a high-quality Wyckoff Accumulation. After the Selling Climax (SC) and Automatic Rally (AR) in Phase A, price spent several weeks in Phase B absorbing supply, followed by a successful Spring that trapped late sellers and confirmed strong demand. 💎The breakout above the range established a clear Break of Structure (BOS), and every retracement since has formed a Last Point of Support (LPS) a classic sign that smart money is defending higher prices and accumulation is transitioning into Phase D. 💎The $234.9-$220 demand zone is now the key support area. As long as #BCH holds above this region, the bullish Wyckoff structure remains valid and favors continuation toward higher levels. 💎The first obstacle is the $250-$252 resistance. A decisive breakout above this level would likely accelerate momentum toward the $289.3 internal resistance, with the major Wyckoff markup target near $327.5 if buying pressure remains strong. 💎Healthy pullbacks into the demand zone should be viewed as normal retests rather than signs of weakness. However, a decisive close below $201.8 would weaken the bullish outlook, while a break below $181.6 would invalidate the current accumulation scenario. 💎For now, the combination of a Spring, BOS, multiple LPS formations, and sustained trading above the accumulation range strongly suggests that smart money accumulation is complete and BCH may be entering the early stages of its markup phase. 🎖 Strive for consistency, not quick profits. Treat the market as a businessman, not as a gambler. MyCryptoParadise iFeel the success🌴 Longby MyCryptoParadise5
The key is whether it can rise beyond Zone 3 Hello. Nice to meet you, fellow traders. If you "follow" me, you can always get new information quickly. Have a great day today. ------------------------------------ I believe that BTC is the only one that has survived among Bitcoin-based tokens. Therefore, if you trade Bitcoin-based tokens, you must trade by increasing the quantity corresponding to your profits. In other words, you need a trading strategy that can protect your original investment capital even if the price plummets. - Looking at the BCH chart, it can be broadly divided into four sections. Among these, the most important section is Section 2. This is because there is a possibility of a significant upward trend when the price rises above Section 2 and maintains that level. Therefore, you should consider Section 2 and below as areas for medium-to-long-term investment and observe the situation with patience. For Bitcoin-based cryptocurrencies other than BTC, it is advisable to adopt a trading strategy that increases the quantity corresponding to the profits, or, if possible, secures cash profits. In other words, this refers to a method similar to trading in the stock market, where you sell 100% to realize a profit when the price rises to a reasonable level. However, if you do not follow this approach and proceed with medium-to-long-term investment, it is essential to recover your principal by retaining a quantity corresponding to the profits. To do this, you should engage in day trading and sell only the quantity corresponding to your principal when the price rises and shows signs of falling. At this point, while calculating the transaction fee rate at 0.4% is considered ideal, you can simply sell at a minimum of 0.1%. It is advisable to set the stop-loss at 0.4% or more above the purchase price if possible. If you buy and the price falls without holding above 0.4%, it is best to cut your losses. However, if you bought when the price showed signs of support near the HA-Low or DOM(-60) indicators, there is no need to strictly cut your losses. This is because a decline from the HA-Low or DOM(-60) indicators can lead to a stepwise downtrend. A stepwise downtrend eventually forms a bottom and reverses into an upward trend. However, if your investment weighting is set too high, you must cut your losses on a portion to secure cash. This is because doing so allows you to buy again when the price meets the HA-Low or DOM(-60) indicators once more. - When prices rise above a certain level, there are times when you buy unconditionally, feeling as though you must buy immediately. While this should technically be considered the peak, this phenomenon becomes more pronounced when the cryptocurrency market enters a bull market. Therefore, in such situations, you must engage in day trading to focus on recovering your principal. For your main purchase, simply hold the quantity made when the HA-Low or DOM (-60) indicators are encountered. Then, when it seems unlikely to rise further, you can sell to recover your principal. If you wish to generate cash profit, you can sell accordingly. Unlike the stock market, the cryptocurrency market allows for free trading in fractional units, making the barrier to entry low. Therefore, even if you sell a large quantity to generate cash profit, there is the advantage of being able to increase your holdings at any time. In that case, there is no need to conduct this type of trading—that is, accumulating the quantity corresponding to your profits—for every coin (token). You should use this when trading coins you intend to invest in for the medium to long term, such as BTC, ETH, and BNB. - BCH is currently exhibiting a stair-step downtrend. To transition from a stair-step downtrend to an uptrend, the price must rise above the previous HA-Low indicator level and maintain that level. In other words, it must rise above 460.1 and hold. Therefore, until then, it is advisable to engage in day trading to increase your holdings based on your profits. However, it is not easy to increase your holdings solely based on your profits. This is because the remaining quantity is small. Therefore, a selling strategy is necessary. Once the price rises above a certain level—that is, if it has increased by more than 0.4%—set a stop-loss around the 0.4% mark and wait. Then, when you encounter the DOM (60) or HA-High indicators, sell a portion or sell an amount equivalent to your principal purchase, and then release the stop-loss. Since the average purchase price of the remaining quantity after recovering the principal is 0, it will always remain in a profitable state until the coins (tokens) disappear. Because this remaining quantity can confuse the average price in the investment history provided by the exchange, you should store it separately in another wallet or ignore the average price provided by the exchange thereafter. - The circles marked on the chart correspond to important support and resistance zones. Among them, points 1 through 4 correspond to buying times, while points 5 and 6 correspond to selling times. However, since there is a possibility of a full-scale uptrend if the price rises above the M-Signal indicator on the 1M chart and maintains that level, it is ambiguous to consider section 4 as a buying time. Therefore, you must respond according to the situation. Therefore, we need to consider how to proceed with buying around zones 1 through 3 to increase our holdings and close our main position. However, since a stair-step downtrend may continue, it is necessary to trade while securing cash. - Thank you for reading to the end. I wish you a successful trade. -------------------------------------------------- by readCrypto6660
Bitcoin Cash is currently in a bearish cycle (3D)A large and time-consuming Diametric pattern has been completed on Bitcoin Cash. Following the completion of Wave G, which marked the final leg of the pattern, the price entered a corrective phase that currently appears to be forming a Diamond Diametric structure. There is a possibility that the price will rebound from the green zone and move toward the red box. However, once it reaches that area, a stronger decline could follow. The medium-term outlook for Bitcoin Cash remains bearish, and the current recovery is likely part of a larger corrective structure rather than the start of a sustained bullish trend. If you have a symbol you want analyzed, first hit the like button and then comment its name so I can review it for you. Do you also think Bitcoin Cash is bullish?by behdarkUpdated 1114
Is BCH Ready for a Move Toward $270?SET:BCH is showing a strong rebound from the lower support zone, suggesting buyers are stepping back in. If this momentum continues, price could push toward the next major resistance around the $270 level. DYOR, NFA Longby unichartz7
Bitcoin Cash—BCHUSDT 4X LONG with 1,520% profits potentialBitcoin Cash was really stable on its last bullish cycle, it went on from late 2023 through early 2024 then nothing more. 2025 saw only mild bullish action. No new all-time high nor anything out of the ordinary. This time it will be much different. We will have a bull market like in the past but many times better, think 2017, 2021, etc. A new all-time high is possible long-term, keep this in mind. The targets for this trade show only a medium size wave lasting 1 year, the complete bull market on this project can last 3 years or more. The correction was quite straight forward and fast, it produced the lowest prices since September 2023 and here we have our new entry. This is a strong chart setup but there can be some fluctuations before the start of the next wave. It can start within a few days or within two weeks at the most, or, if the consolidation period expands, 2-3 months. My main view is that we will see strong bullish action in the coming weeks, marketwide. _____ LONG BCHUSDT Leverage: 4X Potential: 1520% Allocation: 5% Entry zone: $180 - $205 Targets: 1) $262 2) $304 3) $342 4) $374 5) $431 6) $487 7) $567 8) $666 9) $782 10) $852 11) $965 Stop-loss: Close weekly below $178 _____ Thank you for reading. Your continued support is highly appreciated. I hope you find the content useful and great timing on these trades. I am wishing you tons of luck, good health, wealth and success. Namaste.Longby MasterAnandaUpdated 119
Satoshi Frame | BCH Builds 4H Consolidation Box🦉 Welcome Yo SatoshiFrame Tradingview Channel. ⛳️ Lets dive into a Bitcoin Cash analysis. ⚰️ Bitcoin Cash is building a 4-hour consolidation box after its recent decline, and a breakout from this box could trigger the next price move. 🛍 If buyers manage to break above 203 USD, the chance of breaking 252.5 USD increases, and clearing that resistance could lead to a solid recovery in price. ☠️ If buyers fail to break 203 USD, sellers could regain control, and if the weekly support at 186.7 USD breaks, price could move down to the next support levels. 🧮 The RSI oscillator currently sits at 56 and doesn't have a clear overbought level since the trend is bearish, while it has an oversold level around 41.06. ⚠️ Risk management and capital management are essential in trading. Always trade based on your own strategy and risk tolerance. Every trading decision and its outcome are entirely your own responsibility. by satoshiframee1
$BCH 2H🟢 Bitcoin Cash (BCH) is showing signs of breaking its descending trendline on the 2H timeframe. 📈 This could present a solid opportunity to consider a long entry. ✅ 🎯 The marked take-profit zone is a relatively safe area to secure profits. ⚠️ However, it's better to wait for the **2-hour candle to close** first. If the breakout is confirmed and the price reacts well, you can then consider entering the trade. Longby Alireza_kamali3
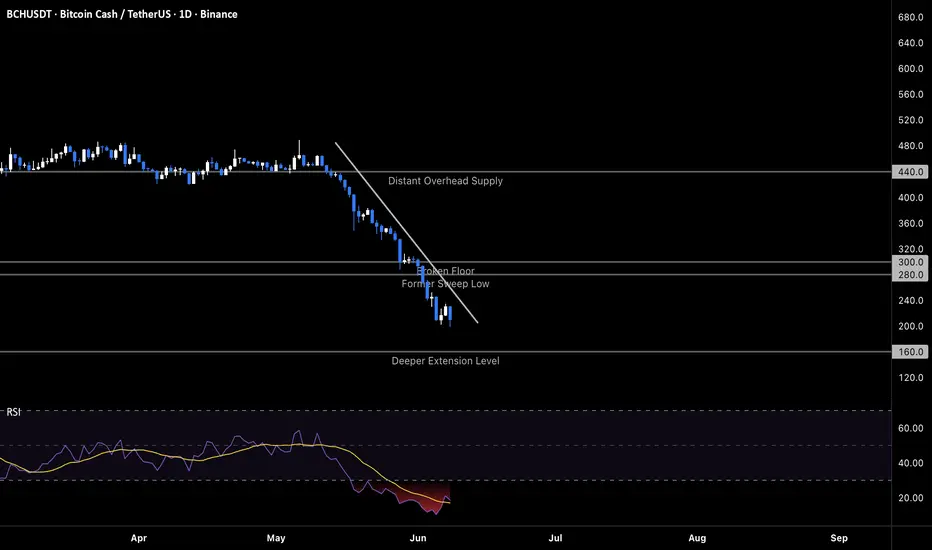
BCHUSDT post-flush base: targeting $230 reclaimThe Macro Picture 🗺️ Bitcoin Cash has now spent over a month grinding inside a tight structural base after the descending leg from $440 finally exhausted itself near the macro lows. The flush deeper into the sub-$200 zone failed to produce sustained downside extension, and price has stabilized in the $190–$215 corridor with bulls absorbing every wick into the lower bound. RSI has carved a clean multi-touch bullish divergence — climbing from sub-20 to near 30 even as price tested marginal new lows — the textbook momentum signature of a trend exhausting itself ahead of a structural rotation. The path of least resistance is gradually shifting from extension lower toward post-flush reclaim, and the only thing missing is the trigger that confirms the rotation. The Setup ⚙️ The Floor: The $200 former floor is now the active battleground. Bulls keep defending this level on closing basis even after the deeper wicks below, converting it from a broken support reference back into a contested demand shelf. Holding above $200 on closes is the first signal that the base has resolved its lowest test. The Trigger: The $215 mid-range pivot is the immediate ceiling that gates the next structural leg. A clean daily close above this level confirms the base has resolved bullish, shorts begin to cover, and momentum traders flip directional bias — the moment the corridor breaks open and the path of least resistance shifts vertical. The Reaction: RSI's lift from sub-20 to 30 while price has ground sideways is the cleanest multi-touch bullish divergence of the entire descending cycle. Momentum is no longer confirming the downside, and that exhaustion footprint typically precedes the reversal trigger by sessions, not weeks. The Roadmap: Primary target on a confirmed $215 reclaim sits at $230 — the failed breakout shelf where the prior bounce got rejected, and the first overhead supply test where reclaim sellers will defend their positioning. Beyond that, the $266.3 broken floor becomes the next structural ceiling for any extended reversal. Invalidation: a sustained daily close below the recent base lows would invalidate this post-flush base thesis and reopen the path toward the $160 deeper-extension level.Longby 3Commas3
BCHUSDT: local squeeze with $280 destinationThe Macro Picture 🗺️ After nearly three weeks of compression near the structural floor, Bitcoin Cash is showing the textbook footprint of a market transitioning from capitulation into accumulation. The descending leg from the $440 distribution range that defined May has fully exhausted itself at $190, and bulls have now defended this local sweep low across multiple sessions without allowing extension into the $160 deeper-extension territory. RSI has lifted from its sub-20 cycle low back through 30, building a clean multi-touch bullish divergence as price has refused to extend lower. This is the high-confluence base where the descending cycle resolves, and the longer the squeeze persists at the floor, the more energy gets stored for the eventual release. The Setup ⚙️ The Floor: The $190 local sweep low has now held across multiple defense tests. Each rejection from this level converts it from "transit zone" to "confirmed demand", and every session that closes above strengthens the structural case that the descending phase is complete. The Squeeze: Price is coiled between the defended $190 floor and the $215 mid-range pivot, exactly the kind of tight compression that resolves with directional momentum rather than further chop. Tight range plus exhausted RSI builds the asymmetric setup where the eventual breakout direction collects all the stored energy. The Trigger: The $215 mid-range pivot is the immediate ceiling that gates the next structural leg. A clean daily close above this level confirms the squeeze has resolved bullish, shorts begin to cover, and momentum traders flip directional bias — the moment the path of least resistance shifts from sideways inside the floor to vertical reclaim of broken supply. The Roadmap: Primary target on a confirmed $215 reclaim sits at $280 — the former sweep low that capped the prior leg down, and the first overhead supply test where reclaim sellers will defend their positioning. Beyond that, $300 broken floor becomes the structural ceiling for any extended reversal. Invalidation: a sustained daily close below $190 would invalidate this base-building thesis and reopen the path toward the $160 deeper-extension level.Longby 3Commas2
BCH ShortTrading gets easier when you stop trying to be right. BCH presented an opportunity. I executed. Win or lose, I follow the system. That's the edge. Shortby kyle95200110
BCHUSDT at macro floor: accumulation toward $280 reclaimThe Macro Picture 🗺️ The $200 macro floor that was framed five sessions ago has now passed its first real defense test. Instead of extending into the $160 deeper-extension territory, price has carved a tight consolidation between $200 and $215 — the textbook signature of a market transitioning from capitulation into accumulation. The descending leg from $440 has lost its velocity, RSI has curled up from its sub-20 extreme back through 25, and every session that closes above $200 strengthens the floor as confirmed demand rather than transit. This is the build-up phase that precedes the next structural move, and the path of least resistance is shifting upward by default the longer the floor holds. The Setup ⚙️ The Macro Floor: $200 is the confirmed demand zone that bulls have now defended across multiple sessions of testing. Every wick into the $195–$200 band gets absorbed rather than extended, validating this as the high-confluence floor where the descending cycle resolves rather than continues lower. The Squeeze: The $200–$215 range is the compression chamber where bulls and bears are trading liquidity inside the macro floor. Tight range plus exhausted RSI creates the asymmetric setup where a break of the $215 range top releases the stored energy as directional momentum — the longer the squeeze persists, the cleaner the eventual breakout. The Reaction: RSI has lifted from sub-20 back through 25 while price has refused to extend lower — the bullish divergence is now confirmed structurally. This is the exact exhaustion signature where bearish momentum unwinds even before price breaks higher, and it's the strongest tell that the next leg is asymmetric to the upside. The Roadmap: Primary target on a confirmed $215 break sits at $280 — the broken sweep low and first overhead supply test where reclaim sellers will defend their positioning. Beyond that, the $300 broken floor becomes the structural ceiling for any extended reversal. Invalidation: a sustained daily close below $195 would invalidate this base-building thesis and reopen the path toward the $160 deeper-extension level.by 3Commas4
BCH 4H – Lower Channel Boundary at New LowsBCH on the 4H timeframe is currently trading around 204.7 inside a steep descending parallel channel that has been guiding price lower since the May highs near 380. Price has been making lower highs and lower lows consistently inside the channel, with every recovery attempt capped by the descending resistance and every bounce from the lower boundary quickly sold. The sell-off from 380 to current levels represents a drop of nearly 46% in under a month. Price is now pressing directly on the lower channel boundary near 186.5–200, which is the lowest level on this chart, while the horizontal support floor near 200–205 is also being tested simultaneously. Key Levels To Watch 380 → Prior high, major resistance above 310–320 → Prior range, key resistance zone 268–280 → Prior support zone, now resistance 248–256 → Prior consolidation zone, now resistance 230–238 → Descending resistance trendline, overhead ceiling 214–222 → Prior support, now resistance 200–205 → Horizontal floor, current test 186.5–192 → Lower channel boundary, final structural floor Below 186.5 → Channel breakdown, no support visible The descending channel has defined this entire move since May and the lower boundary has now been approached for the third time, with each previous test producing only a small bounce before the downtrend continued. A hold above the lower channel boundary near 186.5–192 would be the minimum requirement for any meaningful bounce, with the first target being the mid-channel area near 230–248. A confirmed close below 186.5 and breakdown of the lower channel boundary would push price into new low territory with no visible structural support below. This is the last support inside the descending channel. Hold 186.5–200 → channel bounce possible, eyes on 230–248 mid-channel. Lose 186.5 → channel breaks down, new lows with no support below. Fully bearish inside descending channel. Structure only shifts on confirmed break above descending resistance.by BKVIP1
Bch vs btcBy looking at this chart bch is at its lowest level compared to btc. I would like to see it touch the bottom red line. Which means i expect the price for bch to fall further.Shortby ArslankhanMarwat1
Bch may touch 190-194I use these circles to gauge the moves in coins that move within a certain range and to determine the extent of the fall. I believe bch will fall down yo 190-194 range. This is the zone that will be respected. I warned about the drop in the price of bch earlier, when people were bullish on this. Shortby ArslankhanMarwatUpdated 559
BCHUSDT at macro floor: trendline break opens reversalThe Macro Picture 🗺️ The descending leg that began at the broken $440 distribution range has now driven price into the high-confluence $200 macro floor — the exact target framed in the prior idea as the level "where a real liquidity hunt is more likely to produce a meaningful reversal." Five sessions of relentless selling have reached the structural anchor, and the falling channel that has guided every leg lower is now compressing against the macro demand zone. RSI is printing its deepest oversold reading of the entire cycle and starting to curl off the floor — the first sign that bearish momentum is exhausting itself. The structural reset has reached the point where bulls either organize a defense or the trend extends into the $160 deeper-extension territory. The Setup ⚙️ The Macro Floor: $200 is the structural anchor where this entire descending cycle resolves. Bulls need to defend this level on a closing basis to validate it as a high-confluence demand zone — every wick that holds above $200 strengthens the reversal case, every close below opens the $160 extension target. The Trigger: The descending trendline sits as the immediate ceiling for any bounce attempt. A clean daily close above this falling line is the first structural confirmation that the bearish leg has broken — the moment when shorts begin to cover and momentum traders flip directional bias. Without this trigger, every bounce remains a fade opportunity inside the channel. The Reaction: RSI is sub-20 and curling up — the bullish divergence signature that typically marks late-stage exhaustion in a descending trend. Combined with the macro-floor defense, it's the strongest momentum tell that the next high-confluence move is asymmetric to the upside. The Roadmap: Primary target on a confirmed trendline break sits at $280 — the broken sweep low and former demand pocket where the first wave of reclaim sellers will defend. Beyond that, $300 broken floor becomes the structural ceiling for any extended reversal. Invalidation: a sustained daily close below $200 would invalidate this bullish reversal thesis and reopen the path toward the $160 deeper extension level.by 3Commas3
Bitcoin Cash (BCH): Buy & Accumulation ZoneBitcoin Cash (BCHUSDT) just entered the accumulation zone. At current levels, buying can be done for weeks or months before the market enters a new cycle and produces a new trend. This project at this point in time should be approached through spot trading, buy as much as you can. The market crashed and BCH remained strong. The market moved up in unison, some move ahead but the rest always follow. The market crashed in unison, some move early while others get there late. Bitcoin Cash remained strong but it went down to match the rest of the market, the April 2025 low has been breached as support. The current range is the same one that worked as accumulation in 2022, 2023 and some of early 2024 before massive growth. No new all-time high = no new all-time low. Will Bitcoin Cash continue lower to produce the same pattern as the smaller projects? What about Bitcoin and Ethereum? It is possible, the market tend to take its time to recover. The weekly RSI hit the lowest point since July 2022, the all-time low. This can be used as a very strong bottom and reversal signal. The reversal can start within weeks just as it can take months. Easy money. The market crashes before lower interest rates. The market sells to pay off debt with high interest rates. When the interest is lowered, people get new cheaper loans and buy everything back at a discount. It happened in 2020. This is the setup that will support a major long-term bull market. The crash happens before the event. Everything is being prepared for what comes next and it isn't long-term bearish action, we are looking at years of sustained growth. We just saw a capitulation event on Bitcoin Cash and now we have some 3 months of accumulation before the market fully turns. Each trading pair and project is different and should be considered in isolation. Each project can produce its very own and unique cycle. Generalizations are not possible anymore. Namaste.Longby MasterAnanda553

 Long
Long