TradeCityPro | Bitcoin Cash (BCH): More Downside?Bitcoin Cash (BCH) remains under significant bearish pressure following the breakdown of its previous bullish market structure. With price approaching a critical weekly support level, the next move could determine whether BCH enters another major bearish wave.
BCH Weekly Analysis: Bearish Trend Confirmed
After reaching the $653.9 resistance level, Bitcoin Cash lost its bullish momentum and began showing signs of a potential trend reversal.
The decisive breakdown below $423.5 confirmed the bear
Bitcoin Cash/USD Tether Spot
No trades
No trades
In-depth trading ideas
Bitcoin Cash Price Prediction: BCH/USDT Headed Toward SupportOverview: BCHUSDT Perpetual Contract (4h Chart)
Bitcoin Cash (BCH) on the 4-hour timeframe is showing clear signs of weakness after breaking below local trendline support. Following a prolonged consolidation inside a descending channel and a minor breakdown through the $275 zone, price action is signaling a potential corrective leg downward.
Will buyers step in at the blue demand blocks, or will BCH sweep lower liquidity zones before recovery? Let's analyze the critical levels and probable pric
BCH 1D – Testing Triangle SupportBitcoin Cash is trading around 247.2 on the daily timeframe after a steep slide from the November 3 high near 291, with the November 7 wick tagging the ascending trendline near 244 at the lower boundary of a symmetrical triangle.
The triangle began with the August 8 low near 200.5, where the rising trendline originates. BCH broke out with a vertical leg in late August, built a range between roughly 240 and 290 through early September, and tagged the trendline again with the September 16 low nea
BCHUSDT Daily: $256.20-$304.80 Range Still IntactBCH has spent 20 1D candles, from Oct 15 to Nov 3, moving sideways rather than trending, building a defined range on the daily chart. The high of the range sits at $304.80, printed on Oct 28, while the low sits at $256.20, printed on Oct 15. Measured from the low, the range height works out to 19.0%, and the midpoint lands at $280.50.
Both edges have been tested more than once. The $304.80 area was reached 2 times as swing highs formed there, while the $256.20 area was reached 3 times as swing
BCH | The Liquidity Below Comes FirstBitcoin Cash flipped its trend months ago. What it has not done yet is take the liquidity it needs before the next leg.
━━━━━━━━━━━━━━━━━━━━
THE STRUCTURE
━━━━━━━━━━━━━━━━━━━━
The downtrend ended in sequence, not in a single candle. Price printed a bullish MSS in June, followed it with a BOS in July, and then delivered a second BOS in September on heavy displacement that carried it to $366.7 .
MSS, then BOS, then BOS. That is a trend change confirmed three separate times, and it
BITCOIN CASH (BCHUSD) - MACD INDICATOR SETUPThe resistance level is marked at 411.20. Although we are patiently waiting for a break out to the UPSIDE, the break-out confirmation to the DOWNSIDE is at the price level of 260.00. We are targeting an entry price of 295.30 and trailing profits to 349.00.
Type of trade: Day Trade
Option: BUY
Take profit: 332.30
Stop loss: 20%
NEWS: BITCOIN CASH (BCHUSD): Q4 MARKET OUTLOOK
Bitcoin Cash (BCH) has declined approximately 53% year-to-date, presenting a potential opportunity for an upside recove
BCH - A Major Breakout Ahead? Potential Target at $655!💵 Coin: Bitcoin Cash / TetherUS — SET:BCH #BCHUSDT
⏳ Timeframe: 3D (3-Day Chart)
📈 Pattern: Symmetrical Triangle / Converging Trendlines
🎯 Potential Upside Targets: $339 → $421 → $483 → $568 → $655
📍 Current Price: Around $297.9
## 🔍 Pattern Analysis — Symmetrical Triangle
Bitcoin Cash is forming a large symmetrical triangle pattern on the 3-day timeframe following a significant decline from its 2026 high near $669 toward a low around $181.
The pattern is defined by two converging trendline
BCH is trying to breakout📊 #BCH / USDT
Bitcoin Cash is attempting to break above its descending trendline. 👀
The previous breakouts from a similar patterns triggered a strong bullish rallies. 🚀
While historical price action doesn’t guarantee the same outcome, another rally could be possible if the breakout is confirmed and the bullish structure remains intact.
⚠️ Keep BCH on your watchlist
BCHUSDT 4H: Volume Pocket at $276.04-$278.62Mapping volume across the last 90 4-hour candles on BCHUSDT, a window stretching back to Oct 11 and covering 15 days, shows price ranging between $256.20 and $290.70. Within that span, the heaviest-traded zone sits between $276.04 and $278.62, the tightest cluster of volume on the chart. Around it, a broader value area holds about 70% of the window's total volume, running from $271.72 up to $286.39.
The single heaviest candle in the window printed on Oct 13, a green candle spanning $257.40 to $
BCH Analysis: Breakdown Could Open the Door to Lower PricesBCH Analysis: Breakdown Could Open the Door to Lower Prices 📉
Let's take a look at the #BCH chart.
As you can see, BCH is currently trading within a clear range between $274 and $281.
A breakdown below the $274 support level could create an opportunity to look for short positions.
🎯 Downside Targets:
- TP1: $270.62
- TP2: $263.58
- TP3: $255.57
- TP4: $242.19
❌ Invalidation Level: $281.40
BCH · Bitcoin Cash · Support and high potential for growthBitcoin Cash. The chart is being kept simple for convenience, the analysis short.
BCHUSDT saw a flash down-wave hitting bottom late June then started rising.
This chart shows the contrast between the down-wave (left side) vs the transition period and initial recovery (right side).
Notice I don't mention the word "uptrend" even though there are higher highs and higher lows. I think we can talk more of an uptrend once BCHUSDT reaches above $500 and continues higher. After $500 retraces just to
BCH: why the rotation radar flagged relative strengthAt the 16 October 2026, 16:00 UTC 4H close, the rotation radar flagged BCH at 277.8 USDT: rank 3/8 in radar basket 2. Reported confirmation: top-30% membership for three consecutive closes, positive BTC-relative returns over seven and 30 days, and a positive 30-day USDT return.
The payload records +19.54% versus BTC over 30 days, +2.99% over seven days, and +28.31% against USDT over 30 days. These combined conditions explain the selection.
Crypto Rotation Map confirms rounded closed-bar readin
BCH: Is a Major Bullish Breakout Coming?Yello Paradisers! Could #BCH be approaching a significant bullish reversal while the majority of market participants remain focused on the recent correction? The latest 8-hour technical structure is revealing several important developments that deserve close attention, particularly as #BCH approaches a critical support region.
💎#BCH is currently trading near $275, following a corrective movement from its recent high around $370. Despite the recent selling pressure, the broader price structure r
BCHUSDT 4H: Trend Line From $212.80 Still HoldingDrawing a trend line under the rising lows on the BCHUSDT 4-hour chart gives a clean reference for the current leg up. Anchor A sits on Sep 15 at $212.80, the candle low that started the sequence, and anchor B sits on Oct 8 at $268.40. The two points are 139 4H candles apart, roughly 23 days, which gives the line a gentle, steady slope rather than a steep one.
The line has done more than connect two points. Between the anchors, 1 other swing low formed right on the trend line, confirming the sl
BCH – Levels to watch BCH – Is this the retrace or the reclaim?
Most of the liquidity below has already been taken and BCH has now pushed back above the previous resistance.
But here’s the key question: is this simply the logical retrace into the 0.5 Fib, or can BCH actually hold this level and continue higher?
What I’m watching:
$316 area → current resistance / 0.5 Fib area
Hold above → strengthens the case for a bullish S/R flip
Lose the level → current move could simply be a retracement
$239 → important support
Bitcoin Cash vs The Altcoins Market · Can You Follow & Trust?BCH (Bitcoin Cash) is a reflection of the altcoins market. Last week BCHUSDT did the highest volume since March 2025. To complete a crash that started January 2026. The crash ended with a strong market reaction that led to a 100% bullish jump. This jump ended with last week's candle, the one with high volume and 100%+. This is a bullish signal and trend reversal confirmation, a young one.
The trend reversal is young here but not on other pairs. See the advantage of keeping an eye on the entire
Bitcoin Cash Retest: How Deep Could BCH Correct?
📈 Bitcoin Cash After the EMA 200 Breakout: How Deep Could the Retest Go?
Bitcoin Cash has finally given us something technically interesting after spending a long period under pressure.
On the daily chart, BCH managed to reclaim the 200-day EMA and then accelerated sharply higher. That move changed the character of the chart and established a more constructive rising structure.
But strong moves rarely continue in a straight line.
After the breakout, BCH became stretched, the RSI pushed i
BCHUSDT — Bullish Divergence + Structure BreakBCHUSDT was previously trading in a clear bearish structure. A bullish RSI divergence then developed, with price forming a lower low while RSI formed a higher low, indicating weakening bearish momentum.
Rather than entering solely on the divergence, I waited for confirmation on the 1H timeframe. Price subsequently broke the previous lower high, signalling a potential shift in market structure.
After the 1H confirmation, I moved to the 15M timeframe for execution. The stop loss was positioned b
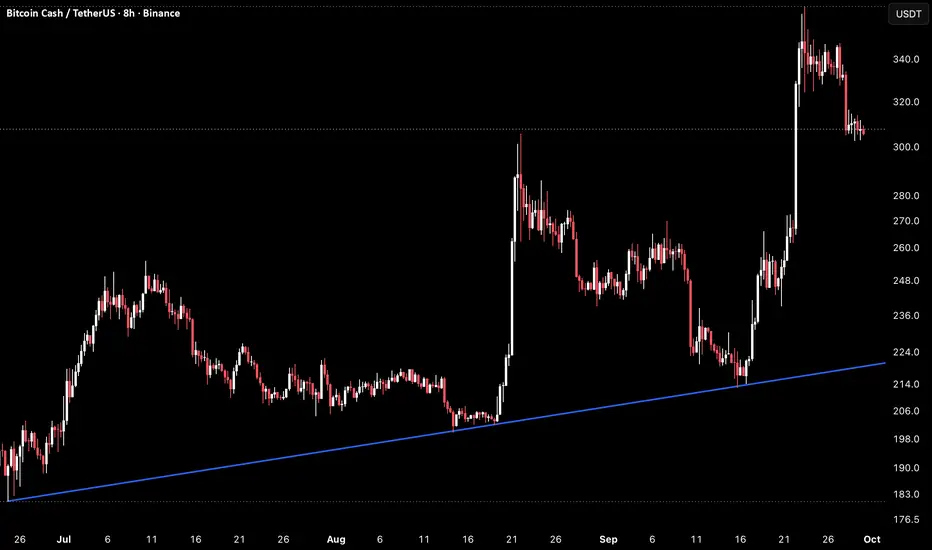
BCH 8H – Sharp Pullback From Spike High Testing SupportBitcoin Cash is trading around 305.5 on the 8H timeframe after a steep pullback from the recent spike high near 350, retracing a significant portion of the aggressive rally that carried price from the low 220s to that fresh high in just a matter of days.
The broader structure here traces back to a long term ascending trendline from the June low near 183, which has held through every major pullback across this entire uptrend. Price spent July and August ranging between roughly 200 and 250, punct
$BCH — Buyers Are Trying To Break The Downtrend !!SET:BCH has bounced from the demand zone twice, showing that buyers are still defending this area. But even after the recovery, price is still trading below the descending trendline, which remains the main barrier for the bullish move.
Now BCH is trying to push higher again. The key confirmation is a strong green candle breaking the descending trendline and the nearby resistance together. If buyers can close above that area and hold it, the current recovery can develop into a stronger upside m
Bitcoin Cash (BCH): Big vs Small, Comparing Profits PotentialGood Sunday my fellow reader, next week will be great.
BCHUSDT (Bitcoin Cash) is on the best week, the biggest candle, since February 2024. This week also has the highest trading activity, the highest volume, since March 2025. These two signals clearly show that something is happening, market conditions are changing fast toward the positive side.
Bitcoin Cash is big. When it comes to profits potential, big means heavy. A heavy project needs lots of capital to move. The best example is Bitcoin