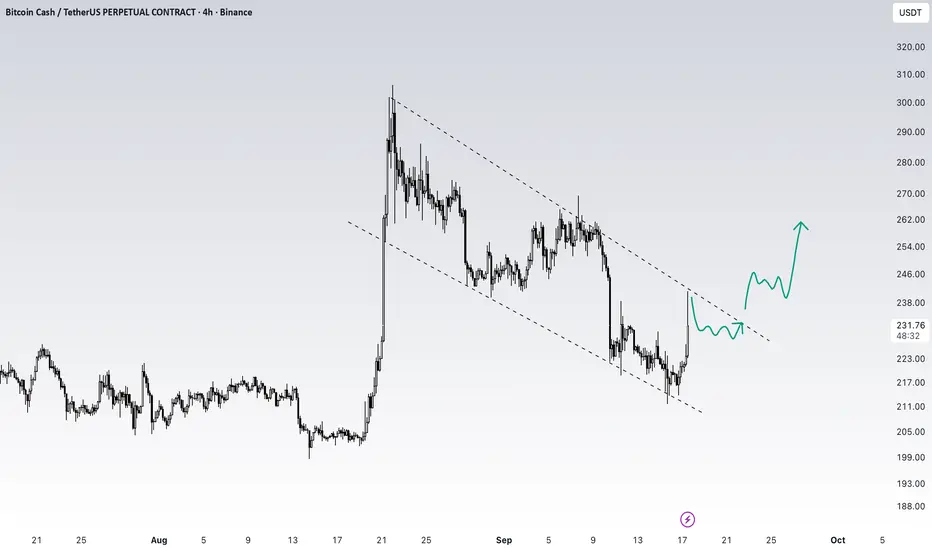
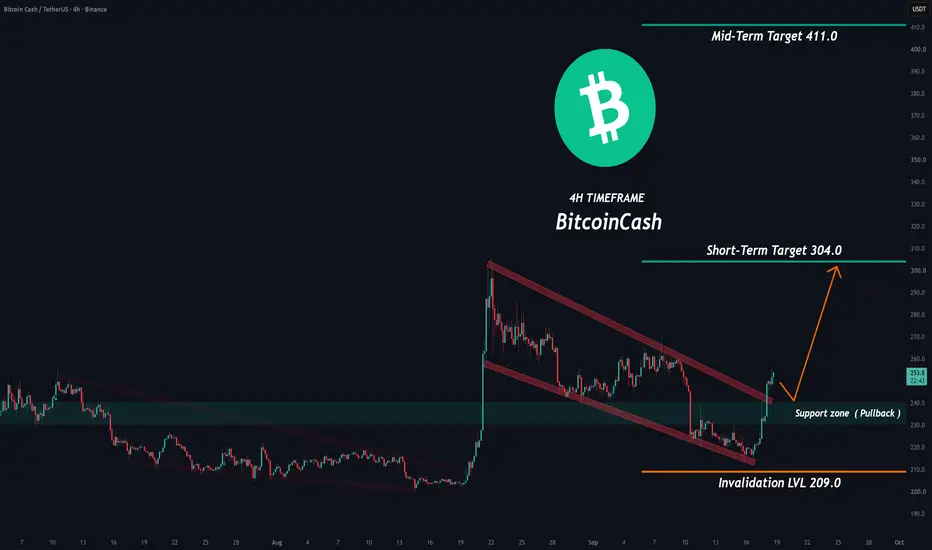
Bitcoin Cash (BCH): Big vs Small, Comparing Profits PotentialGood Sunday my fellow reader, next week will be great.
BCHUSDT (Bitcoin Cash) is on the best week, the biggest candle, since February 2024. This week also has the highest trading activity, the highest volume, since March 2025. These two signals clearly show that something is happening, market conditions are changing fast toward the positive side.
Bitcoin Cash is big. When it comes to profits potential, big means heavy. A heavy project needs lots of capital to move. The best example is Bitcoin
In-depth trading ideas
$BCHUSDT Rising Wedge BreakdownBCHUSDT — 1D Binance
The chart shows a Rising Wedge formation, with price making higher highs and higher lows inside converging upward trendlines. The pattern becomes significant after price breaks below the lower wedge boundary.
Current price zone: approximately 332.81 USDT.
Resistance levels:
• 360–380 USDT — nearby overhead resistance
• 440–460 USDT — previous consolidation/resistance zone
• 540–550 USDT — major wedge breakdown/structure area
Support levels:
• 320–330 USDT — current price
BCHUSDT Larger Wave May Be DevelopingThe long-term structure is becoming interesting. Following the completion of the ABC corrective structure, price has reacted from the $184–$235 demand zone and is now attempting to develop a new impulsive advance.
The current structure is also forming beneath a major descending resistance line, with $621.79 acting as the key breakout level. A confirmed breakout and sustained acceptance above this level could open the path toward $1,417, followed by the larger projected target around $3,154.
F
BCHUSDT Long: Bulls Ready to Strike?Yello Paradisers! is #BCH preparing for its next bullish impulse from this key retracement zone?
💎#BCH has started showing several signs that the bearish pressure may be weakening. Price first formed a hidden bullish divergence near the bottom and then shifted from printing lower lows into a higher-high structure. This change was followed by a strong bullish impulse, suggesting that momentum may be starting to shift in favor of buyers.
💎What makes the current structure even more interesting is
$BCH — Buyers Are Trying To Break The Downtrend !!SET:BCH has bounced from the demand zone twice, showing that buyers are still defending this area. But even after the recovery, price is still trading below the descending trendline, which remains the main barrier for the bullish move.
Now BCH is trying to push higher again. The key confirmation is a strong green candle breaking the descending trendline and the nearby resistance together. If buyers can close above that area and hold it, the current recovery can develop into a stronger upside m
BCH: The Wedge Has Finally BrokenAfter spending time inside the corrective wedge, BCH has finally broken out of the structure.
This is the part of the chart I was waiting to see.
The breakout doesn't mean the entire move is guaranteed from here. What matters now is whether BCH can hold the breakout and continue building momentum above the pattern.
For the mid-term view, there is one important resistance ahead.
That resistance is where I want to see how the market reacts.
If BCH reaches that area with strong momentum and break
BCH / BCHUSDT Long Setup | Breaker Block ReclaimMARKET ANALYSIS
BCH is currently reacting from a key technical area highlighted on the chart.
As long as the protected support zone remains intact, the bullish market structure remains valid and higher liquidity targets may continue to attract price action.
A breakdown below the invalidation level would weaken the current bullish scenario and require a reassessment of market conditions.
📍 Entry, Stop Loss and Take Profit levels are marked directly on the chart.
━━━━━━━━━━━━━━
⚠️ DISCLA
Bitcoin Cash Retest: How Deep Could BCH Correct?
📈 Bitcoin Cash After the EMA 200 Breakout: How Deep Could the Retest Go?
Bitcoin Cash has finally given us something technically interesting after spending a long period under pressure.
On the daily chart, BCH managed to reclaim the 200-day EMA and then accelerated sharply higher. That move changed the character of the chart and established a more constructive rising structure.
But strong moves rarely continue in a straight line.
After the breakout, BCH became stretched, the RSI pushed i
BCHUSDT — Bullish Divergence + Structure BreakBCHUSDT was previously trading in a clear bearish structure. A bullish RSI divergence then developed, with price forming a lower low while RSI formed a higher low, indicating weakening bearish momentum.
Rather than entering solely on the divergence, I waited for confirmation on the 1H timeframe. Price subsequently broke the previous lower high, signalling a potential shift in market structure.
After the 1H confirmation, I moved to the 15M timeframe for execution. The stop loss was positioned b
BCH 8H – Sharp Pullback From Spike High Testing SupportBitcoin Cash is trading around 305.5 on the 8H timeframe after a steep pullback from the recent spike high near 350, retracing a significant portion of the aggressive rally that carried price from the low 220s to that fresh high in just a matter of days.
The broader structure here traces back to a long term ascending trendline from the June low near 183, which has held through every major pullback across this entire uptrend. Price spent July and August ranging between roughly 200 and 250, punct
BCH Forecast 15 minBINANCE:BCHUSDT
The logic behind this trade is based on the higher-timeframe bearish trend. The bearish impulses remain strong, while the bullish corrective moves are relatively slow and weak.
On the lower timeframe, we can also see a strong bearish move followed by a slow bullish correction, which increases the probability of another bearish leg.
⚠️ Risk Disclaimer
All analyses, market views, and scenarios presented on this page are provided for informational and educational purposes only a
$BCH: Chart breakdown 11/09
Unfortunately, yesterday's altcoin dump hit our stop. Bummer.
Per subscribers' request, here's the situation breakdown.
First, what 🧩IMA data says: throughout yesterday's session, 🐋large players were reducing longs. US session was also exiting longs. A slight (practically neutral) short bias was noted.
Capital outflow from both spot and futures. No full short reversal yet, but buyers lost the initiative. Bottom line — neutral situation.
Now let's look at the chart.
After breaking monthly suppor
$BCH PRICE PREDICTION | 10X–20X POTENTIAL?SET:BCH PRICE PREDICTION | 10X–20X POTENTIAL?
#BCH Is Trading Inside A Multi-Year Accumulation Structure On The Weekly Chart, With Price Currently Retesting A Major HTF Demand Zone.
After Years Of Distribution And Decline, BCH Has Built A Broad Base And Is Now Approaching A Critical Structural Inflection Point.
Current Technical Structure:
✅ Multi-Year Accumulation Structure
✅ Major HTF Demand Zone Holding ($220–$170)
✅ Long-Term Descending Resistance Still In Play
✅ $300–$320 Reclaim Would
$BCHUSDT : Long entry on support retestBYBIT:BCHUSDT.P
One of the few coins that still has solid upside potential. 🧩IMA data confirms: 🐋large players have a strong long bias.
Right now, price is trading at monthly support 📊M-Levels and came to retest weekly support 📊W-Levels $248–$254.
🟡 Trade plan (Long)
🟢 1. Entry: current levels
🟢 2. Entry: $249
🛑 Stop: $225
Recommendation: order size 50% of standard. The market hasn't had a serious pullback yet to shake out the passengers.
⚠️If the idea was useful — glad to have your support 🚀.
BCHUSDT.P: short setup from support at 260.90Trade idea:
Following a strong rally fueled by Bitcoin's growth, BINANCE:BCHUSDT.P has entered a consolidation phase. In my opinion, buyers will not be able to hold the price above the key level of 260.9, so I expect a decline in the near future.
The ideal scenario would be for the consolidation to continue right above the level for a few more hours — this will build up liquidity and create the perfect conditions for a breakdown.
Current facts on the chart:
clear path beyond level
pr
BCHUSDT ForecastBINANCE:BCHUSDT After a strong growth and correction, we expect another growth.
Very Simple ;)
I would greatly appreciate hearing your technical opinions and insights on this potential scenario.
⚠️ Risk Disclaimer
All analyses, market views, and scenarios presented on this page are provided for informational and educational purposes only and should not be considered financial advice or a recommendation to buy or sell any financial instrument.
Financial markets involve substantial risk, and no
BCHUSDT - Bull market!Take BCH, for example.
It had been in a strong downtrend for quite some time, until the price stabilized around $185 and started forming an accumulation range in that area.
Eventually, it formed a Higher Low (HL), and the market structure shifted from bearish to bullish.
Now, it has also printed a Break of Structure (BOS) with extremely high volume.
The pullback on the latest candle could be a solid buying opportunity.
I expect BCH to move above $500 over the coming period, so try not to mi