BEAMX Descending Trendline, Breakout or Rejection?📊 Technical Analysis
💵 Pair: BEAMX/USDT
⏳ Time Frame: 4D
📉 Pattern: Descending Trendline
📍 Condition: Price is still under pressure from the descending trendline.
The chart shows a Descending Trendline formed by a series of lower highs since the peak around 0.041090 USDT. The yellow trendline has repeatedly acted as dynamic resistance and kept the overall price structure bearish.
However, price has now moved closer to the lower section of the trendline and is beginning to show a consolidation phase. This makes the trendline increasingly important because a breakout could potentially signal a significant structural change.
---
📉🔻 Descending Trendline Structure
🔸 Dynamic Resistance: The yellow trendline is the main barrier preventing further upside.
🔸 Lower Highs: Previous rebounds have generally failed to form higher highs, meaning the bearish structure remains visible.
🔸 Consolidation: Recent price movement appears narrower than the previous decline, indicating a temporary balance between buyers and sellers.
🔸 Breakout Pressure: The closer price gets to the trendline, the more important the 4D candle reaction to this resistance becomes.
---
🟢📈 Bullish Scenario — Descending Trendline Breakout
If BEAMX manages to break through and achieve a valid 4D close above the Descending Trendline, the long-term bearish structure could receive an initial reversal confirmation.
🎯 Resistance Target 1: 0.002078 USDT
🎯 Resistance Target 2: 0.002621 USDT
🎯 Resistance Target 3: 0.003132 USDT
🎯 Resistance Target 4: 0.004612 USDT
🎯 Resistance Target 5: 0.009113 USDT
📈 After the breakout, the trendline that previously acted as resistance could potentially turn into support if a retest occurs and buyers are able to defend it.
🔥 If breakout momentum becomes stronger, the higher resistance levels could become the next areas of interest.
⚠️ Bullish confirmation should not be based solely on a breakout wick. A 4D candle close above the trendline followed by a successful retest would provide stronger structural confirmation.
---
🔴📉 Bearish Scenario — Trendline Rejection
If price receives a strong rejection from the Descending Trendline, the bearish structure remains valid.
🔻 Failure to break out could cause price to return toward the nearest support area.
📉 If support fails to hold, selling pressure could continue toward the previous low area.
🧱 Major Support: Around 0.001211 USDT.
⚠️ As long as price has not successfully broken and maintained a position above the trendline, the Descending Trendline remains the main resistance.
---
🔎 Key Areas to Watch
🟡 0.002078 — Initial resistance
🟡 0.002621 — Next resistance
🟡 0.003132 — Important resistance
🟡 0.004612 — Major resistance
🟡 0.009113 — Long-term resistance
🔵 0.001839 — Price area shown on the chart
🔴 0.001211 — Major low/support
---
🧠 Conclusion
📉 BEAMX/USDT remains within a long-term Descending Trendline structure.
However, the price moving increasingly close to the trendline makes the reaction to this resistance extremely important.
🟢 Breakout + 4D close above the trendline → Opens the possibility of a bullish structure and a test of resistance at 0.002078 → 0.002621 → 0.003132 → 0.004612 → 0.009113.
🔴 Rejection + support breakdown → Maintains the bearish structure and opens the possibility of a retest of the previous low.
🎯 The key level on this chart is the Descending Trendline. The next move will largely depend on whether buyers can break through the dynamic resistance or sellers manage to defend it again.
#BEAMX #BEAMXUSDT #Crypto
In-depth trading ideas
BEAM/USDT: Accumulation Range Breakout & Support Retest SetupBEAM has broken out above a prolonged horizontal consolidation range after accumulating inside the green demand zone. Price action is currently pushing above resistance near $0.001695, signaling potential trend continuation toward upper liquidity targets.
Key Observations:
Accumulation Zone: Price consolidated cleanly inside the green range before breaking above resistance.
Breakout & Retest: Looking for a pullback/retest into broken resistance (turning into support around $0.001672 - $0.001695) to confirm buyer strength.
Momentum: 4H RSI remains elevated (>60), showing strong bullish momentum building up.
Trade Parameters:
Entry Area: Retest of $0.001670 – $0.001695
Target 1 (TP1): $0.001800
Target 2 (TP2): $0.001915
Stop Loss: Below the local structural support at $0.001552
$beamxanyone know if this bubba is still alive or not ?
guess does not matter once the bull starts everything pumps
so scaling into this over this week till we flip the 200 ema
shall keep adding the lower we get but would not want to see us loose the 50 ema worsecase the yellow thick line below
target .0044 and then infinity
BEAM is over priced right nowPrice tricked buy and sell biased traders then took out their buy and sell orders between 10 to 19 july then the buyers control shifted to the sellers on the 19th and a pullback got more sniper traders in just for price to go higher and stop them out.
The Market makers are satisfied with this unloading phase
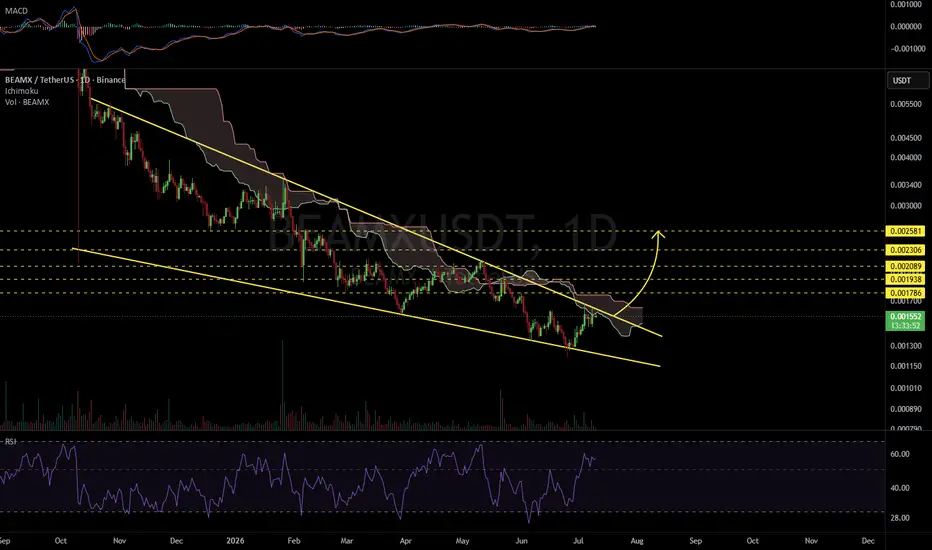
BEAMXUSDT 1D#BEAMX is moving inside a falling wedge pattern on the daily chart.
In case of a breakout above the wedge resistance and the Ichimoku cloud, the potential upside targets are:
🎯 $0.001786
🎯 $0.001938
🎯 $0.002089
🎯 $0.002306
🎯 $0.002581
⚠️ Always remember to use a tight stop-loss and maintain proper risk management.
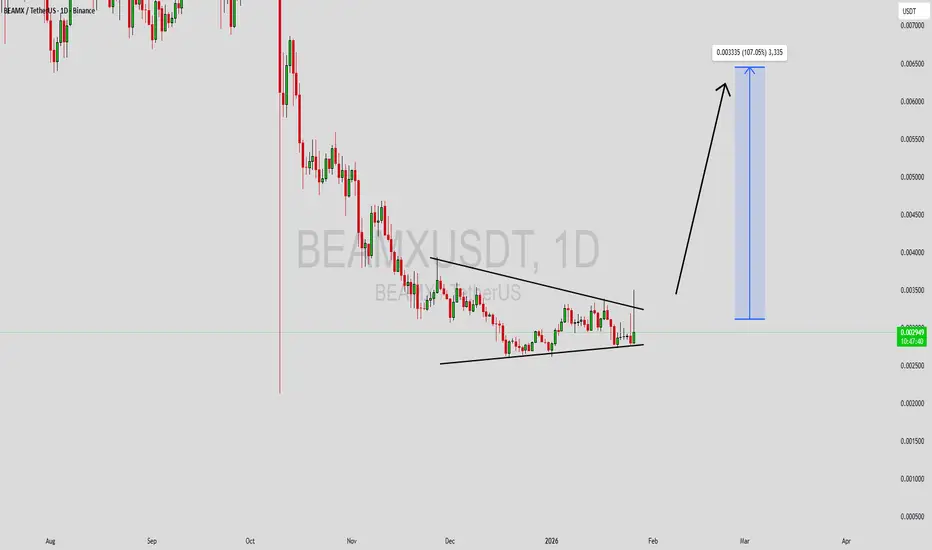
BEAMXUSDT Forming Falling WedgeBEAMXUSDT is forming a clear falling wedge pattern, a classic bullish wave signal that often indicates an upcoming breakout. The price has been consolidating within a narrowing range, suggesting that selling pressure is weakening while buyers are beginning to regain control. With consistent volume confirming accumulation at lower levels, the setup hints at a potential bullish breakout soon. The projected move could lead to an impressive gain of around 40% to 50% once the price breaks above the wedge resistance.
This falling wedge pattern is typically seen at the end of downtrends or corrective phases, and it represents a potential shift in market sentiment from bearish to bullish. Traders closely watching BEAMXUSDT are noting the strengthening momentum as it approaches a key breakout zone. Good trading volume adds confidence to this setup, showing that market participants are positioning early in anticipation of a potential reversal.
Investors’ growing interest in BEAMXUSDT reflects rising confidence in the project's long-term fundamentals and current technical strength. If the breakout confirms with sustained buying volume, this could mark the beginning of a fresh bullish leg. The current consolidation phase suggests that buyers are steadily accumulating positions while bearish momentum continues to fade, increasing the probability of a strong upside move.
Traders might find this a valuable setup for medium-term gains, especially as the falling wedge pattern nears completion and buying momentum continues to strengthen. A confirmed breakout above resistance could attract additional market participation and potentially drive the price toward its projected upside target over the coming weeks.
✅ Show your support by hitting the like button!
✅ Leave a comment below! (What is your opinion about this coin?)
Your feedback and engagement keep me inspired to share more insightful market analysis with you!
BEAMXUSDT Forming Falling WedgeBEAMXUSDT is forming a clear falling wedge pattern, a classic bullish wave signal that often indicates an upcoming breakout. The price has been consolidating within a narrowing range, suggesting that selling pressure is weakening while buyers are beginning to regain control. With consistent volume confirming accumulation at lower levels, the setup hints at a potential bullish breakout soon. The projected move could lead to an impressive gain of around 50% to 60% once the price breaks above the wedge resistance.
This falling wedge pattern is typically seen at the end of downtrends or corrective phases, and it represents a potential shift in market sentiment from bearish to bullish. Traders closely watching BEAMXUSDT are noting the strengthening momentum as it nears a breakout zone. The healthy trading volume adds confidence to this pattern, showing that market participants are positioning early in anticipation of a reversal.
Investors’ growing interest in BEAMXUSDT reflects rising confidence in the project's long-term fundamentals and current technical strength. If the breakout confirms with sustained volume, this could mark the start of a fresh bullish leg. The current market structure suggests that buyers are gradually gaining control while bearish pressure continues to fade.
Traders might find this a valuable setup for medium-term gains, especially as the falling wedge pattern completes and buying momentum accelerates. A successful breakout could attract additional market interest and potentially drive the price toward significantly higher levels over the coming weeks.
✅ Show your support by hitting the like button!
✅ Leaving a comment below! (What is your opinion about this Coin?)
Your feedback and engagement keep me inspired to share more insightful market analysis with you!
BEAMXUSDT 1D#BEAMX is facing a resistance cluster that includes the trendline, the daily SMA50, and the Ichimoku cloud. Volume has increased strongly, and RSI suggests a potential breakout. Keep a close eye on it. If a breakout occurs, the potential upside targets are:
🎯 $0.003590
🎯 $0.004204
🎯 $0.004700
🎯 $0.005196
🎯 $0.005903
🎯 $0.006803
⚠️ Always apply tight stop-losses and maintain strict risk management.
BEAMXUSDT Forming Falling WedgeBEAMXUSDT is forming a clear falling wedge pattern, a classic bullish reversal signal that often indicates an upcoming breakout. The price has been consolidating within a narrowing range after the recent down move, suggesting that selling pressure is gradually weakening while buyers are starting to regain control. With consistent volume confirming accumulation at these lower levels, the setup is hinting at a potential bullish breakout soon. If the price breaks decisively above the wedge resistance, the projected move could lead to an impressive gain of around 90% to 100% from the breakout point.
This falling wedge pattern is typically seen at the end of downtrends or during corrective phases, and it represents a potential shift in market sentiment from bearish to bullish. Traders closely watching BEAMXUSDT are noting the strengthening momentum as it nears a breakout zone. The good trading volume adds confidence to this pattern, showing that market participants are positioning early in anticipation of a reversal.
Investors’ growing interest in BEAMXUSDT reflects rising confidence in the project’s long-term fundamentals and current technical strength. If the breakout confirms with sustained volume, this could mark the start of a fresh bullish leg. Traders might find this a valuable setup for medium-term gains, especially as the wedge pattern completes and buying momentum accelerates.
✅ Show your support by hitting the like button and
✅ Leaving a comment below! (What is your opinion about this Coin)
Your feedback and engagement keep me inspired to share more insightful market analysis with you!
BEAMX Analysis (4H)Market makers, in this weak and low-volatility market, are hunting for liquidity. Bullish momentum on this asset is very weak, and the previous trend is bearish, which causes most traders to look for sell/short positions.
However, there are signs on the chart indicating a potential stop hunt for sellers.
Price is currently trading at a key level, and we have a bullish CH (Change of Character) after a bearish consolidation/compression.
We have two entry points, which can be executed using a DCA approach.
Targets are marked on the chart.
If you would like us to analyze a coin or altcoin for you, first like this post, then comment the name of your altcoin below.
BEAM is showing strength as it finds its bottomBEAM is ranging sideways and has shown that selling pressure has diminished, indicating that sellers are likely exhausted. The good news is that the recent recovery was strong and is now looking for a breakout. In addition, momentum and trend oscillators are suggesting a continuation up as it enters oversold conditions.
$BEAMX Breakout bullish symmetrical pattern in Daily time frame
**Execute the trade**
Once the breakout is confirmed, there are two primary entry strategies:
**Aggressive entry**: Enter a long position immediately after a candle closes above the upper trendline.
**Conservative entry:** Wait for a retest of the broken trendline, which now acts as a support level. Enter a long position when the price bounces off this line. This approach offers a tighter stop-loss but may cause you to miss the trade if the price does not retest the trendline.
@everyone
BEAMXUSDT 1D#BEAMX is moving within a symmetrical triangle. Consider buying at the current price and near the support levels of $0.007523 and $0.007035. If it breaks out above the triangle resistance, the targets are:
🎯 $0.008218
🎯 $0.008780
🎯 $0.009342
🎯 $0.010141
🎯 $0.011160
⚠️ Always remember to use a tight stop-loss and follow proper risk management.
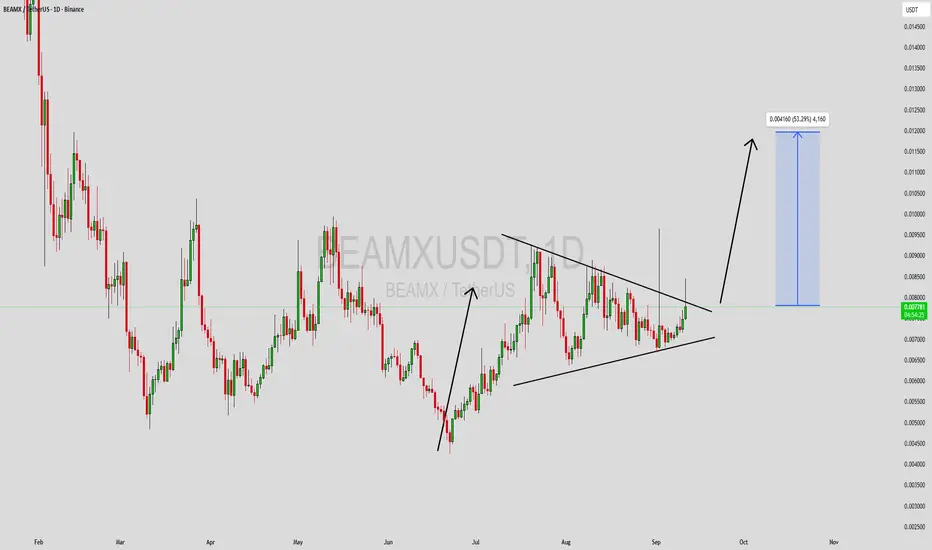
BEAMXUSDT Forming Symmetrical TriangleBEAMXUSDT is showing a strong consolidation phase within a symmetrical triangle pattern, which often indicates a potential breakout. The tightening price action suggests that momentum is building, and with good trading volume backing the move, the probability of a bullish breakout is increasing. Once price breaks above the resistance trendline, we could see an impulsive rally unfold in the short term.
The projected upside for BEAMXUSDT is in the range of 40% to 50%+, aligning with the measured move target from the breakout structure. This kind of setup is closely monitored by traders since symmetrical triangles in bullish markets often lead to continuation rallies. The technicals highlight strong potential for buyers to push the price higher, especially as accumulation appears to be taking place.
Investor sentiment toward BEAMX is improving, which adds weight to the bullish case. Growing attention around the project, combined with favorable technical signals, makes this pair one to watch in the coming sessions. A clean breakout above resistance could trigger further buying pressure, opening the door for significant short-term gains.
✅ Show your support by hitting the like button and
✅ Leaving a comment below! (What is You opinion about this Coin)
Your feedback and engagement keep me inspired to share more insightful market analysis with you!
#BEAM #BEAMX #BEAMXUSD #BEAMXUSDT #Analysis #Eddy#BEAM #BEAMX #BEAMXUSD #BEAMXUSDT #Analysis #Eddy
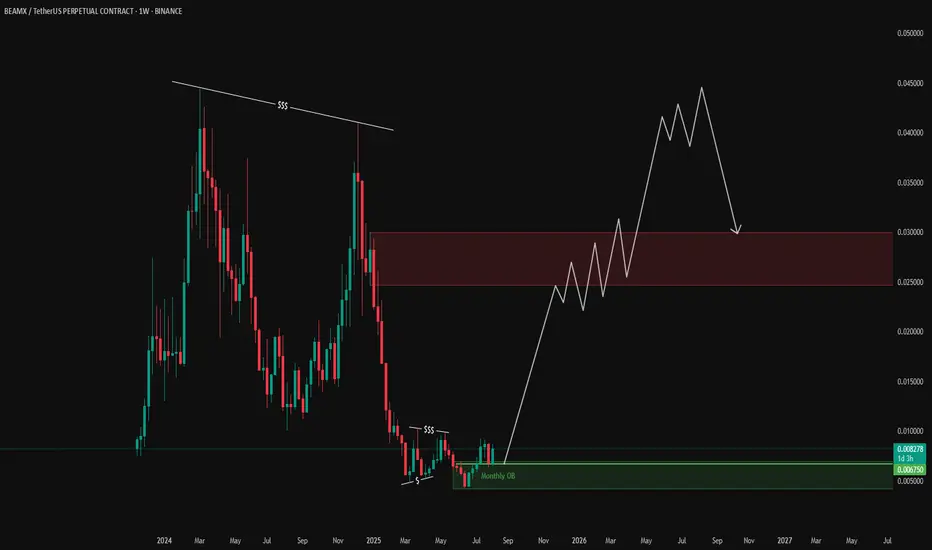
A reversal structure has formed on the weekly and daily time frames, and the necessary confirmations have been given on the weekly time frame. Considering the structure formed on the above time frame, as well as the behavior of this currency in the past chart, it is expected that this currency will perform a good pump.
I have identified the important supply and demand zones of the higher timeframe for you.
This analysis is based on a combination of different styles, including the volume style with the ict style.
Based on your strategy and style, get the necessary confirmations for this analysis to enter the trade.
Don't forget about risk and capital management.
The responsibility for the transaction is yours and I have no responsibility for your failure to comply with your risk and capital management.
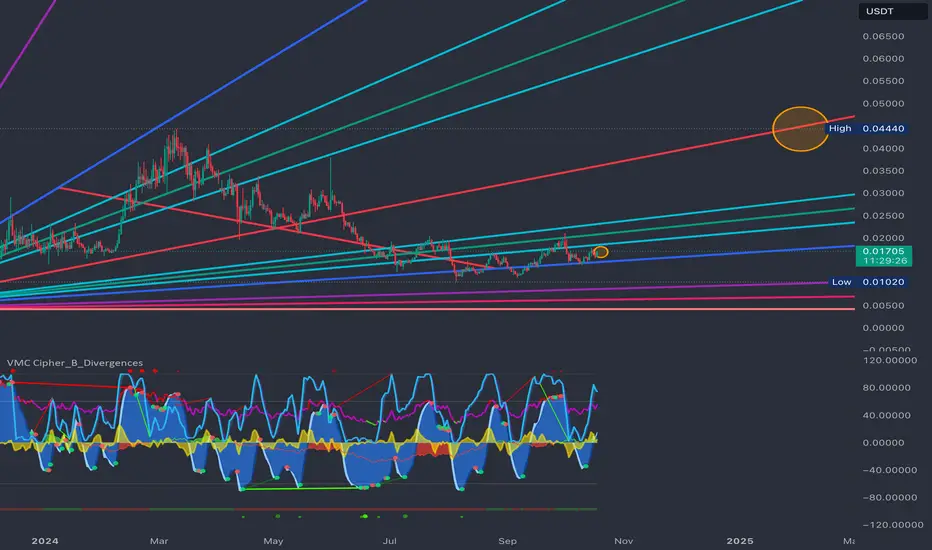
💬 Note: The red order block cannot stop the growth of the price of this currency and by 0.04 cents this currency will be pumped more than 500%.
Be successful and profitable.
$BEAMX – Waiting for the Pop
One of those coins that’s hard not to track—when it expands, it does so aggressively.
The META sector’s been slow this year and might stay that way, with utility coins taking the spotlight this quarter, so it's key to pick your winners wisely.
That said, NASDAQ:BEAM still has a solid shot at moving higher. Buying some here and ready to adjust if it breaks above the trendline.
Targeting just above a 2x for my first offload. BINANCE:BEAMXUSDT
BEAM FROM A NORMAL COIN TO A GOLDEN COIN SOON!! DUBBLE EFFECTThis is exactly what we expect, depending on the data that Beamx/USDT will show an interesting break since the new data.
when the real whale entering is started, we will see diffrance price movements ( not in a stable way as we see it now)
What is the expected target
up $0,001
There is an interesting update upcoming also that can give this coin an effect from a normal coin to a golden coin.
Every good increase and cycle movement takes time.
So let's see what time this expected update will take..
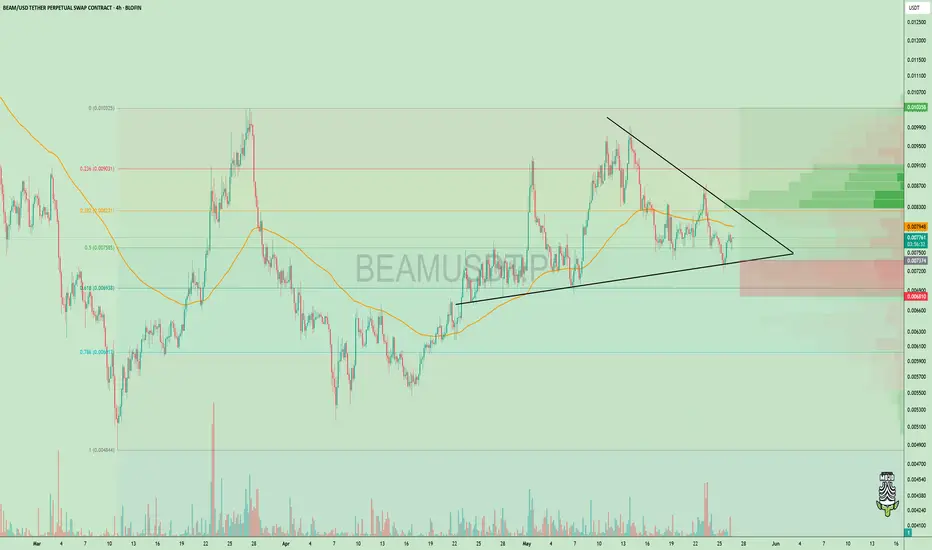
$BEAM Coiling Up in the Golden Zone – Breakout Incoming?NASDAQ:BEAM is consolidating inside a symmetrical triangle, right near the 0.5–0.618 Fib golden pocket a zone where strong moves often begin.
It’s a clean setup with a good risk-reward and a clear stop-loss.
Keeping this on watch and accumulating inside the pattern, a breakout could push the price toward $0.009 or higher.
DYOR, NFA
Bearish Sentiment in BEAMUSDTLooking forward to this sell setup.
Confluences are: 1) Market Structure-MSS(bearish), 2) Liquidity, 3) QM-orderblock(POI).
Targeting a minimum of 1:2.5RR.
Note: If price happens to create a new LL,LH structure before retracing back to the POI. That invalidates the setup.
Note: the market is all about probabilities which also makes my analysis a probability.