BERAUSDT: Bullish Recovery Targets Higher ResistanceBERAUSDT has staged a strong recovery after defending the recent swing low, with buyers reclaiming momentum and pushing price back above short-term support. The sharp rebound suggests bulls are regaining control, while the current structure favours continuation as long as support remains intact.
As long as 0.1826 holds as support, the bullish outlook remains valid. Sustained buying pressure could drive price toward 0.1960, while a decisive break below support would invalidate the current bullish setup.
Trade Setup
Entry: 0.1843
Target: 0.1960
Stop Loss: 0.1826
I'll wait for buyers to continue defending the support zone before expecting the next move higher. A confirmed break below 0.1826 would invalidate this bullish scenario.
In-depth trading ideas
BERA at macro floor: base recovery toward $0.2172The Macro Picture 🗺️
BERA ground down from the $0.4267 high all the way to the $0.16 floor and has flattened onto it at $0.1645. The long, steady bleed has given way to a base right on support — exhaustion rather than continuation.
The Setup ⚙️
The Accumulation Zone 🟢
$0.1635–0.1645 is where the selling has dried up. The floor has held on retest, and this is the demand shelf a recovery would build from.
The Decision Point 🔴
$0.4267 (Local High) is the structural gate far above. Before it, the $0.2172 measured-move target is the first objective — reclaiming it proves buyers are stepping back in.
The Roadmap 🛣️
Hold the $0.1635 floor → recover toward $0.2172 as the first leg up. Invalidation is a clean daily close below $0.1635 — that voids the accumulation thesis.
This is a textbook DCA Accumulation Zone setup: scale in across the $0.1635–0.1645 band and let the base do the work.
#BERA #Berachain #crypto #trading #TA #3Commas #DCA
BERAUSDT - Breakdown or Bounce?📊 Technical Analysis
💵 Coin: BERA/USDT
⏳ Time Frame: 6H
📐 Pattern: Ascending Channel (Bearish Bias)
🎯 Key Support: 0.1970 USDT
🚨 Major Support: 0.1880 USDT
📍 Current Structure: Price is trading inside an ascending channel after a prolonged downtrend, indicating that this upward movement may only be a corrective rally rather than a confirmed trend reversal.
---
📖 Pattern Explanation
The chart shows an Ascending Channel formed after a significant bearish impulse. Although ascending channels can sometimes continue upward, when they appear after a strong downtrend, they often act as a bearish continuation pattern.
Price has repeatedly respected both the upper and lower boundaries of the channel. The latest rejection near the upper-middle portion of the channel suggests that buyers are losing momentum while sellers are becoming more active.
The 0.197 USDT level is the most important horizontal support. A decisive breakdown below this area could trigger increased selling pressure toward 0.188 USDT, which is the next significant support and previous swing low.
---
🟢 Bullish Scenario
✅ Buyers successfully defend the 0.197 USDT support.
✅ Price rebounds from the lower trendline and reclaims the channel's midline.
✅ A breakout above the upper channel resistance with strong volume would invalidate the current bearish structure.
🎯 Bullish targets:
0.220 USDT
0.230 USDT
0.240 USDT
A confirmed breakout accompanied by increasing volume would strengthen the probability of a larger bullish reversal.
---
🔴 Bearish Scenario
⚠️ If price closes below 0.197 USDT, the ascending channel will begin to lose its validity.
⚠️ A confirmed breakdown below the lower trendline would likely accelerate bearish momentum.
🎯 Bearish target:
0.188 USDT
If 0.188 USDT also fails to hold, sellers could extend the downtrend and push price toward lower support levels.
---
📌 Conclusion
At the moment, BERAUSDT remains in a corrective ascending channel within a broader bearish trend. The 0.197 USDT support is the key level that will determine the next major move.
📈 Hold above 0.197 → Potential recovery toward the upper channel.
📉 Break below 0.197 → Increased probability of a decline toward 0.188 and possibly lower.
Waiting for confirmation before entering a position is the more prudent approach.
---
#BERA #BERAUSDT #Crypto #Cryptocurrency #Trading #TradingView #TechnicalAnalysis #PriceAction #AscendingChannel #BearishContinuation #Support #Resistance #Altcoins #CryptoTrading #Binance #MarketAnalysis #CryptoSignals #ChartAnalysis #Bullish #Bearish
Big bullish move in BeraHello Traders!
This is a wonderful opportunity in Bear as this pump is more than a 100% move.
We can see a golden trendline on the chart. This is the main trendline for now, and BERA is moving around it.
Earlier, BERA formed a reversal pattern after breaking above the trendline, which pushed the price down. Now, it is forming another pattern that looks like a "W" shape. If this pattern plays out, it could push the price higher.
My target is 0.60, but the price could reach as high as 0.63. There is still a chance of a small move lower before the rally begins, but I expect BERA to reach 0.60 very soon.
My goal is to be recognized as one of the highest win-rate traders in the TradingView community. :)
Trade Analysis Based on
> Fibonacci Tool (A1000x Way) – Custom Fibonacci approach for precise market analysis
> Candlestick Patterns – Strong price action confirmation through key candle formations
> A1000x Breakout Strategy – Identifying and trading high-probability breakout setups
> HH, HL & LH, LL Strategy – Market structure analysis for clear trend direction
> Swing Points – Tracking key highs and lows for accurate price movement insight
> A1000x Stoploss Strategy – Strategic stoploss placement for effective risk control
> A1000x Target Strategy – Structured target setting based on price action
We trade using carefully developed strategies and disciplined market analysis, always seeking the best possible accuracy while remembering that ultimate success comes only by the will of Allah.
In some trades, you may notice a relatively larger stop loss or a risk-to-reward ratio that may appear unusual at first glance. However, every trade is taken with proper planning and calculated analysis, not random entries.
Before entering any position, we perform detailed calculations and market evaluation. Based on this analysis, we carefully determine our stop loss and target levels.
I personally apply one of my specialized stop-loss and target strategies, designed to place the stop loss at a logical market level where price is less likely to reach before moving toward the intended target — InshaAllah.
Trading always involves risk, but with discipline, patience, and proper strategy, we aim for consistent and responsible decision-making.
Feel free to share your thoughts, leave a comment, or contact me.
BERAUSDT 1D#BERA is testing the descending resistance and the daily SMA50. Enter this trade only in case of a solid breakout above these levels. If confirmed, the potential upside targets are:
🎯 $0.498
🎯 $0.585
🎯 $0.655
🎯 $0.724
🎯 $0.824
🎯 $0.951
⚠️ Always use a tight stop-loss and maintain proper risk management.
BERAUSDT Forming Bullish MomentumBERAUSDT is forming a clear bullish momentum pattern, a classic bullish continuation signal that often points toward a potential breakout in the near term. The price has been consolidating within a tightening range, indicating that bearish pressure is gradually fading while buyers continue to gain strength and defend key support levels. This type of price structure usually reflects growing market confidence before a strong directional move.
The projected breakout from this bullish momentum structure could result in a strong upward move of around 90% to 100% if the price successfully breaks above the resistance zone with convincing volume confirmation. This kind of setup is commonly seen during recovery phases and may signal a transition from bearish sentiment to a renewed bullish trend.
Traders closely monitoring BERAUSDT are noticing strengthening momentum as the price approaches an important breakout area. The steady volume profile adds confidence to the setup, suggesting that market participants may already be positioning themselves ahead of a potential bullish reversal.
Growing interest in BERAUSDT reflects increasing confidence in both its technical outlook and long-term potential. If the breakout confirms with sustained buying pressure and strong follow-through, it could trigger the beginning of a fresh bullish wave.
Traders may view this as an attractive medium-term opportunity, especially as the consolidation structure nears completion and bullish momentum continues to build.
✅ Show your support by hitting the like button and
✅ Leaving a comment below! (What is your opinion about this coin?)
Your feedback and engagement keep me inspired to share more insightful market analysis with you!
BERAUSDT UPDATEBIST:BERA Technical Setup
Pattern: Falling Wedge Breakout
Current Price: $0.397
Target Price: $0.700
Target % Gain: 80.82%
Technical Analysis: BERA is showing a bullish falling wedge breakout on the 1D timeframe after a long downtrend compression. Price is holding above the wedge support near $0.39, while the projected move points toward the $0.70 area. A successful breakout confirmation could trigger strong bullish momentum in the coming sessions.
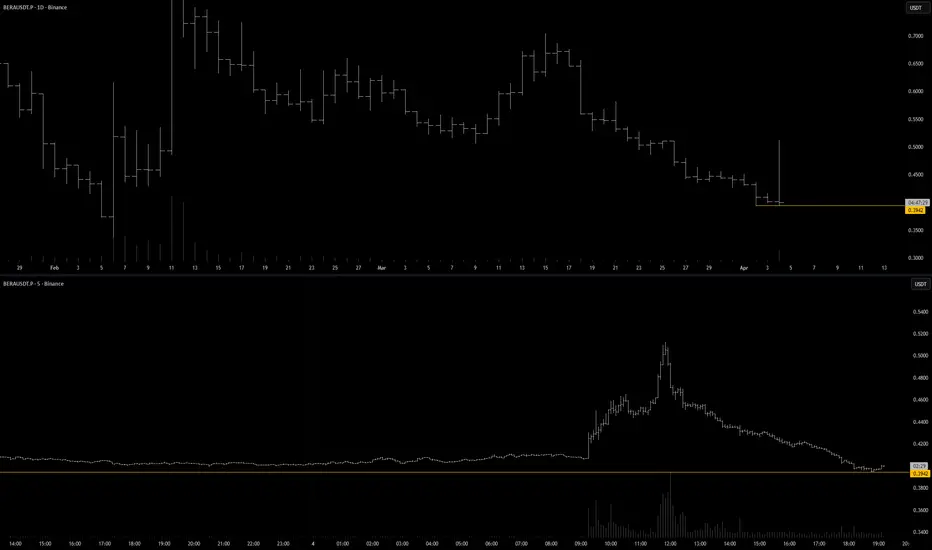
BERAUSDT.P: short setup from daily support at 0.3942The BINANCE:BERAUSDT.P asset continues its global downtrend, and today’s price movement gives a clear signal for further decline.
Earlier today, we saw a strong push higher that was quickly reversed: the price not only rolled back but dropped below the daily open level. This is not a coincidence — we are witnessing a deliberate accumulation of a short position. The large player intentionally let the price run up to trap buyers (longs), using their volume to build a short position at much better prices.
What is particularly telling is the nature of the drop. The price didn't crash sharply on emotions; instead, it moved lower slowly and confidently, methodically eating through all the buyers' limit orders along the way. This kind of movement shows that the major player isn't offloading, but rather accumulating a position using the counter-trend move in full control. The bias remains strictly short.
PRO-THESIS FACTORS:
trend alignment
liquidity vacuum beyond level
market divergence
liquidity sweep (false move)
volatility contraction on approach
close retest
price compression (Squeeze)
at-level close
extreme close
Leave your thoughts on the setup in the comments. Follow this profile to monitor all upcoming ideas.
BERAUSDT plan 12-02-26BERAUSDT PLAN 12-02-26
Bera has rejected fresh supply on the high timeframe.
When we look at the 1-hour timeframe, we see a bearish engulfing. Then, we move down to the 30-minute timeframe and see a Quasimodo setup. We'll try setting a limit in that area, even though the head is too high.
After series of bearish candles BERA is now ready to move upHello Traders!
As expected there was strong bearish move in market and we made successful trades in this bearish trend but now the trend is about to change and market is ready to move up from here. In some pairs market is still bearish but in Bera market has completed its bearish move and now its ready to move up from here.
Stoploss 0.5046(-7.8%)
Target 0.645(+17.7%)
My aim is to achieve highest win rate in tradingview trading community :) and we will definitely do that.
Trade Analysis Based On:
• A1000x Master Reversal Strategy
• A1000x Secret S/R Strategy
• Candlestick Patterns
• A1000x Stop Loss & Target Strategy
We trade using carefully developed strategies and disciplined market analysis, always seeking the best possible accuracy while remembering that ultimate success comes only by the will of Allah.
In some trades, you may notice a relatively larger stop loss or a risk-to-reward ratio that may appear unusual at first glance. However, every trade is taken with proper planning and calculated analysis, not random entries.
Before entering any position, we perform detailed calculations and market evaluation. Based on this analysis, we carefully determine our stop loss and target levels.
I personally apply one of my specialized stop-loss and target strategies, designed to place the stop loss at a logical market level where price is less likely to reach before moving toward the intended target — InshaAllah.
Trading always involves risk, but with discipline, patience, and proper strategy, we aim for consistent and responsible decision-making.
Feel free to share your thoughts, leave a comment, or contact me.
BERA SHORT IDEAThis chart shows a strong uptrend that has recently entered a consolidation phase. For the past two days, the price has been moving sideways with high volatility. This can be considered a positive signal, as short positions are being liquidated. There is a possibility that the price may rise to around 3.5. Overall, the chart looks very promising. In any case, always remember about the risks.
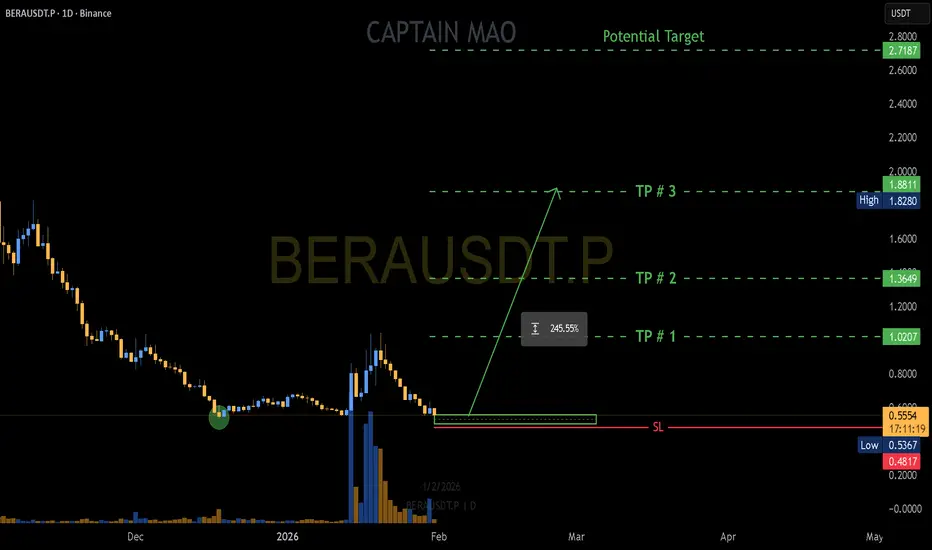
BERA/USDT — Preparing for Next ImpulseBERA/USDT already delivered a +200% initial move, confirming strong market interest. After that surge, price went through a healthy correction and consolidation, allowing the market to reset.
With structure stabilizing again, the setup suggests BERA could be preparing for the next impulsive leg to the upside.
BERAUSDT📈 BERAUSDT — Bullish Bias, But Structure Not Confirmed
BERA shows upward probability alignment (≈77%) —
yet structure remains unclear on both 4H and 1H.
Trend base:
1D — below MA200
4H — above MA200
1H — above MA200
Mixed regime.
This is not a clean continuation setup.
💡 What This Means
Bias leans upward —
but without structural clarity, execution must be selective.
Current state: WARNING.
If price prints 2–3 consecutive 4H closes below MA200
or loses key support → exit logic activates.
Until structure confirms, this is a monitoring phase — not aggressive positioning.
⚠️ Where traders usually fail
• Trade probability without structure
• Over-size in mixed regimes
• Ignore higher timeframe misalignment
Probability suggests potential upside.
Structure has not validated it yet.
🧠 System Perspective
High bias + unclear structure = controlled risk only.
The system does not force trades in borderline conditions.
Confirmation first.
Position second.
Patience protects capital.
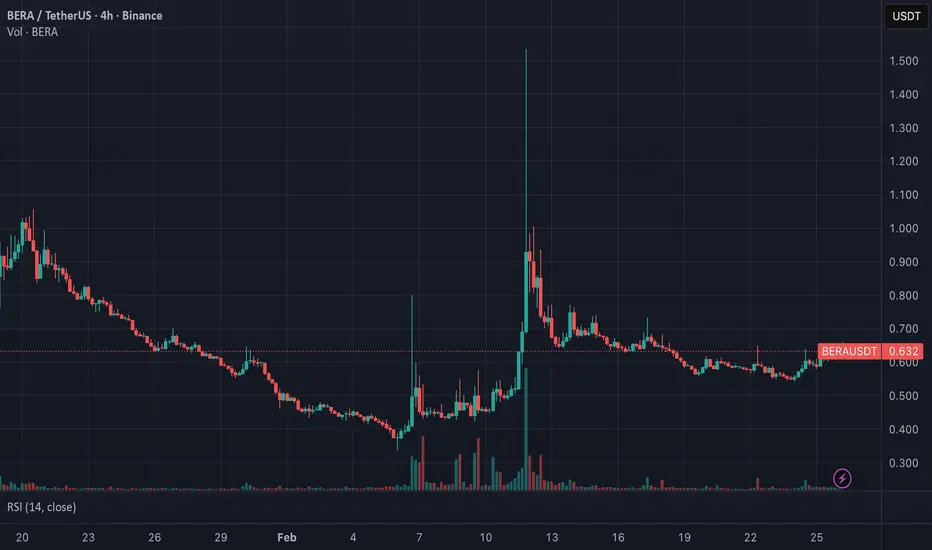
2500% possible with BERA token? - February 2026As market participants continue to capitulate hand over fist without understanding why a return to the 9 to 5 is inevitable (Read 7am to 10pm if you’re in Mur’ca), they’re unwittingly showering smart traders with opportunity.
On the above er 3 day chart price action has corrected 95% in the last 12 months, so obviously this is the moment to sell.
Price action prints the highest bullish divergence of any token currently listed on Binance on this timeframe. The divergence indicator is V4 from LonesomeTheblue, standard settings, give it go.
If you look carefully you’ll also find this divergence on the BERA.BTC pair.
The next three resistances are shown above. Good luck!
Ww
=====================================
Disclaimer
This is not financial advice. It’s an observation, the kind you’re free to ignore while holding a token with no users, no revenue, and a supply schedule that looks like it was designed by a printer on fire.
If you buy it and it goes up, you’re a genius.
If you buy it and it goes down, it was “market manipulation.”
Do your own research. Or don’t. Just don’t confuse hope with a business model
BERA/USDT — Huge Volume InflowBERA/USDT is showing a clear shift in market behavior as huge volume has stepped in, signaling the presence of strong and aggressive buyers at current levels. This type of volume expansion after a prolonged decline often marks institutional accumulation rather than short-term speculation.
BERA - Dead Cat Bounce or Bear With a Jetpack?BERA – Dead Cat Bounce or Bear With a Jetpack?
Question of the day:
Can BERA sneak higher while Bitcoin finishes today’s flush and stops acting dramatic?
Short answer: maybe yes, but don’t marry it.
⸻
🧠 The Chart Story (aka Why This Looks Spicy)
BERA already did the classic “new coin goes brrr” move. Big pump, fireworks, CT victory laps.
Then reality checked in.
Price pulled back cleanly to the EMA 50, politely swept liquidity there, and bounced.
For my gameplan, this is chef’s kiss territory. 🍳
Not random. Not chasing. A+ retrace setup.
This is the kind of move where:
• late longs get shaken out,
• stops get harvested,
• and the chart quietly reloads like “round two?”
If BTC stops faceplanting and just behaves like a neutral adult, BERA can move independently for a bit.
⸻
🎯 Trade Plan (Simple, No Hero Mode)
Bias: Cautious LONG
Logic: Trend pullback + liquidity taken + EMA support
Plan:
• Ride the bounce toward TP1
• At TP1:
• Take ~40% off
• Move stop-loss to break-even
• Emotional damage = reduced
• From there:
• Let the rest run
• Manage like a civilized trader, not a dopamine addict
This is not a “YOLO all-in bear market retirement plan.”
This is a structured trade, not a personality trait.
⸻
⚠️ The Big Fat Risk (Read This Twice)
Yes, BERA looks juicy.
Yes, the setup is clean.
But…
🐘 Token unlocks exist.
🐘 And they do not care about your EMA.
There’s a real possibility of unlock-related selling pressure, which means:
• random red candles
• vibes ruined
• Twitter pretending they “knew it all along”
I’m aware of the risk.
I’m choosing to take it with size control and rules, not blind optimism.
⸻
🧬 Fundamentals (Quick Reality Check)
• Mainnet live ✅
• Solid TVL and liquidity ✅
• Strong VC backing ✅
• Trading ~0.88 USD in post-launch chaos 🌪️
Translation:
This is not a dead coin, but also not a safe one.
Perfect conditions for a trade, not an investment thesis.
⸻
🧠 Mental Model
Think of BERA like:
• a strong athlete
• coming out of rehab
• with a scheduled drug test (token unlocks)
It can sprint.
It just might trip randomly.
⸻
🧾 Final Take
• Chart: Bullish pullback setup
• Structure: EMA 50 + liquidity grab
• Plan: TP1 → partial → BE → manage
• Risk: Unlocks can nuke vibes anytime
• Confidence level: Calculated, not cocky
I’ll take the trade.
I’ll respect the stop.
And if unlocks dump it, I won’t tweet “market manipulation.”
Enjoy, bears 🐻📉📈
BERA/USDT Perpetual Overextended Pump Setting Up for a Short? 📉
**BERA/USDT Perpetual – Overextended Pump Setting Up for a Short? 📉**
Check this out on the 15m chart – BERA just ripped +17.7% in a single impulsive leg, but is this sustainable?
We saw a aggressive breakout from the 0.81–0.83 low, smashing through resistance at ~0.90–0.92 on heavy green volume. But now, price is stalling right at the 0.96–0.98 zone with thinning bids (Ask 0.9630 / Bid 0.9629). That massive green candle screams short squeeze exhaustion – classic trap for late longs chasing the FOMO.
Key observations:
- Price rejected hard from the upper purple supply band, showing seller absorption
- Earlier dip to 0.81435 (-14.8%) was a fakeout low, but the rebound feels like manipulated liquidity grab
- Trendline from the highs is capping upside; volume profile shifting red on the edges
- Currently hovering at 0.9633 – looks toppy with potential wick rejection incoming
**Short-term bias:** Bearish if we fail to hold 0.94
Entry idea: Short on break/retest below 0.925 (confirmation of structure flip)
🎯 First target: 0.88–0.90 (previous resistance now support)
🎯 Deeper: 0.81–0.83 demand zone for full reversion
**Invalidation:** Clean close above 0.98 would negate (chase longs only then, low prob here)
This pump has "fade the rip" written all over it – overbought RSI (not shown but implied), round number psych at 1.00 looming as magnet if it flips. Who's shorting with me? 🐻💥
#BERA #Berachain #Crypto #Perps #FadeThePump
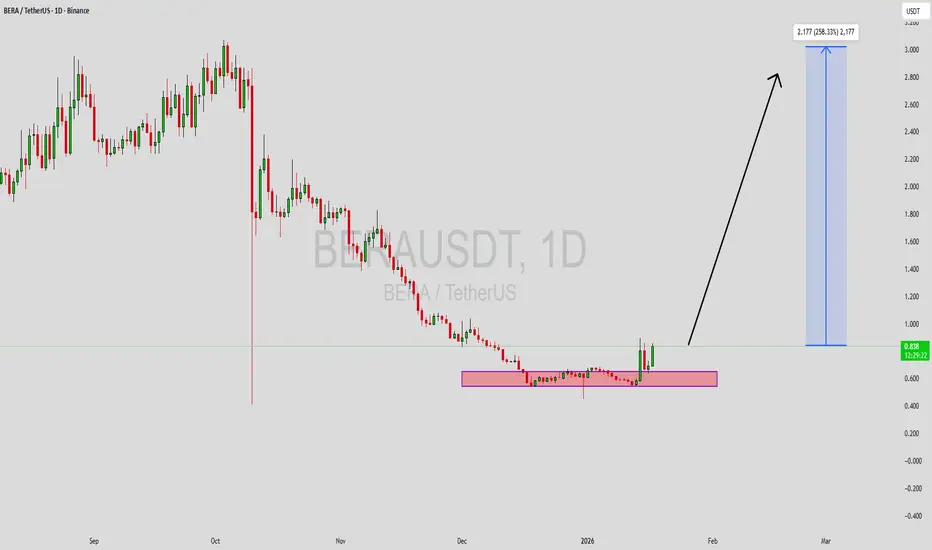
BERAUSDT Forming Bullish MomentumBERAUSDT is forming a clear bullish momentum pattern, a classic bullish reversal signal that often indicates an upcoming breakout. The price has been consolidating within a narrowing range, suggesting that selling pressure is weakening while buyers are beginning to regain control. With consistent volume confirming accumulation at lower levels, the setup hints at a potential bullish breakout soon. The projected move could lead to an impressive gain of around 190% to 200% once the price breaks above the wedge resistance.
This falling wedge pattern is typically seen at the end of downtrends or corrective phases, and it represents a potential shift in market sentiment from bearish to bullish. Traders closely watching BERAUSDT are noting the strengthening momentum as it nears a breakout zone. The good trading volume adds confidence to this pattern, showing that market participants are positioning early in anticipation of a reversal.
Investors’ growing interest in BERAUSDT reflects rising confidence in the project’s long-term fundamentals and current technical strength. If the breakout confirms with sustained volume, this could mark the start of a fresh bullish leg. Traders might find this a valuable setup for medium-term gains, especially as the wedge pattern completes and buying momentum accelerates.
✅ Show your support by hitting the like button and
✅ Leaving a comment below! (What is your opinion about this Coin?)
Your feedback and engagement keep me inspired to share more insightful market analysis with you!