BGB: fading bounce eyes the $1.57 floorThe Macro Picture 🗺️
BGB has been locked in a descending structure since the $2.20 May peak, printing a series of lower highs as every rally gets sold into. The early-July flush to $1.57 marked the latest leg down, and while buyers produced a reflex bounce off that macro floor, the recovery is already stalling — RSI spiked back toward its midline and has rolled over, failing to reclaim momentum. Price now sits at the $1.67 equilibrium, coiling between a defended floor below and heavy overhead supply. In a trend this heavy, the path of least resistance still points lower until bulls prove otherwise.
The Setup ⚙️
The Rejection: The bounce failed to reclaim the $1.85 local decision (red dashed), the level that flipped from support to resistance on the breakdown. As long as price stays capped beneath it, sellers remain in control.
The Floor: The $1.57 macro support (solid green) stacks directly under the $1.60 local low to form a high-confluence shelf. This is the battleground — a break here opens fresh downside, while a firm defense sets up a base.
The Reaction: RSI rolling back under 50 after the bounce signals the relief rally is running out of fuel, favoring another test of the floor over an immediate trend reversal.
The Roadmap: Primary target sits at $1.57 — the red projection points toward a retest of the macro floor as the bounce fades. Invalidation: a sustained 1D close back above $1.85 would flip the structure bullish and open the path toward the $2.20 macro ceiling.
More setups in profile.
In-depth trading ideas
BGB Trap: Is a Violent Move Loading?Yello Paradisers! Are you prepared for a potential sharp move on #BGB, or are you still underestimating what’s quietly building behind the scenes? At first glance, this structure might seem like a simple and healthy pullback. But when we strip away emotions and analyse the chart objectively, a completely different narrative emerges. This is not random price action this is a high-risk, high-opportunity zone where discipline matters far more than opinions.
💎#BGB has recently printed a classic selling climax, followed by a climactic action candle supported by ultra-high volume. This is a textbook indication of accumulation. Historically, this exact behaviour appears when smart money begins positioning ahead of a larger move. While subtle to the untrained eye, this probability carries significant weight for experienced traders.
💎#BGB has also swept the liquidity below the selling climax with shakeout test and then broken above the upper trigger line with a strong momentum candle. This suggests that weak hands were pushed out before stronger buyers stepped in with conviction. If the prices sustain this momentum, the next upside path can open toward 1.9600, which is currently acting as a major structural resistance level.
💎#BGB is also respecting its descending support, while the market structure has started shifting to the upside gradually. On top of that, we can see a clear RSI divergence, adding more strength to the bullish probability. As long as the prices holds momentum within the order block + FVG zone, the structure remains constructive, with 1.8500 acting as the first important resistance level to watch.
💎If #BGB fails to hold bullish momentum and a momentum candle closes below 1.5350, the current bullish probability becomes invalid. In that case, we could see further downside pressure.
That is why Paradisers, we are playing it safe right now. If you want to be consistently profitable, you need to be extremely patient and always wait only for the best, highest probability trading opportunities only on confirmations.
MyCryptoParadise
iFeel the success🌴
Nenstar (XABCD) Pattern Complete + Bearish StructureNenstar (XABCD) Pattern Complete + Bearish Structure
Pattern Structure:
X → Major high
A → First leg down
B → Retracement (strong bounce)
C → Deep low (Pattern completion)
D → Current high (Potential reversal zone)
This forms a classic Nenstar / Extended XABCD bearish pattern.
Key Fibonacci Measurements:
XA leg → Strong impulsive down move
AB = 0.455 (likely 0.382 - 0.5 retracement)
BC = 2.234 (strong extension)
CD projection hitting 1.201 and 1.735 resistance levels
Current Situation:
Price has reached point D (2.08+ area) after a powerful rally from C. This completes the Nenstar pattern. We are seeing strong rejection at D with a sharp red candle and increased volatility.
Bearish Thesis (Primary Scenario):
Pattern completion at D acts as a major distribution zone
Strong resistance confluence around 2.08 - 2.10
Potential measured move target down from D equal to XA or XC leg
Black arrow projection suggests move toward 1.82 - 1.85 zone
Invalidation:
Strong breakout + close above D (2.10+ with volume) would invalidate the bearish Nenstar.
BGB Trap: Is a Sharp Drop Coming…!Yello Paradisers! Are you prepared for a potential sharp downside move on #BGB, or are you still calling this “just a healthy pullback” while smart money quietly distributes above you? At first glance, the structure may look harmless. But when we remove emotions and read the chart objectively, the story changes completely. This is not a random retracement. This is a high-risk zone where discipline matters more than opinions.
💎#BGB has clearly respected the descending resistance trend-line and failed to break above it. This rejection is not a minor probability—it reflects ongoing structural weakness. The broader market structure also remains bearish, adding strong confluence to the downside scenario. As long as price trades within the current order block and fair value gap zone, the probability favours continuation lower. The nearest support at 1.7122 now becomes the first downside magnet if selling pressure continues to build.
💎From Volume Spread Analysis perspective, the sequence is even more revealing. We saw a buying climax followed by a climactic action bar. This combination typically shows distribution. In simple terms, institutions use these aggressive spikes to offload positions into retail enthusiasm. When the crowd feels confident, smart money distributes quietly.
💎#BGB swept the upper trigger line of the buying climax but failed to sustain higher levels, followed by a strong momentum candle breaking below the lower trigger line. This is a classic confirmation that supply is dominating. If bearish momentum continues, the next probability of major downside target sits around 1.5035, and it could be reached sooner than most expect.
💎If #BGB manages to break above the key resistance at 1.9775 with a strong momentum candle, this whole bearish probability would be invalidated, and we could instead see a bullish continuation. As always, we let price confirm our bias.
Discipline is key, Paradisers! The charts may look volatile, but this is where professionals thrive and amateurs panic. Don’t let emotions guide your trades. Wait for clear confirmation and manage risk like a pro. Strive for consistency, not quick profits. Treat the market as a businessman, not as a gambler.
MyCryptoParadise
iFeel the success🌴
BGBUSDT: ready for another dip? key levels to monitor todayBGBUSDT – ready for one more leg down before the real bounce? The token has been under pressure while traders digest the latest exchange headlines and overall risk-off mood in altcoins. According to industry sources, volumes on smaller exchange coins have cooled off, and you can see that lack of fresh buyers right here on the chart.
On the 4H chart price is stuck in that red demand zone around 1.90 with a clear series of lower highs after the last spike. RSI is hovering near oversold but with no strong bullish divergence, so I still lean short term bearish, expecting a sweep of liquidity below the current lows before any serious recovery. If we get another fast wick down with higher 4H RSI and strong buyback, that’s the signal that sellers are getting tired.
My base plan: watch for a stop‑hunt flush into the lower part of the zone, then potential mean‑reversion back toward 1.94 – 1.96 if buyers show up. If price instead loses the zone decisively and 4H closes build below it, that opens room for a deeper slide and I step aside rather than knife‑catch. I might be wrong, but I’d rather let the market prove a bounce than marry a bag too early.
BGBUSDT: bargain zone or bounce? key levels to watch todayBGBUSDT – bargain zone or dead token bounce? Recently exchange tokens have been lagging majors while traders rotate back into BTC and regulators keep poking at centralized venues, according to industry chatter. At the same time, the project side keeps pushing campaigns and token support, so sentiment is bearish but not dead.
On the 4H chart, price flushed from the highs into a thick demand block (orange zone), basically the last strong consolidation area. RSI is making higher lows while price makes lower lows – classic bullish divergence – and the sell volume is getting absorbed around this floor. That combo makes me lean toward a relief move up rather than another straight leg down.
My base plan: look for longs inside 2.15–2.20 with targets near 2.45 and then 2.70 if momentum really kicks in ✅ A clean 4H close below 2.05 would kill the idea for me and open space toward 1.90, so that’s where my invalidation sits. I’m stalking wicks into the zone for entries; I might be wrong, but some of the best trades start exactly where the chart looks ugliest.
BGBUSDT: ready for a bounce? key levels to watch todayBGBUSDT: tired of watching this bleed or ready for a bounce? Exchange tokens have been under pressure lately after fresh regulatory headlines and fading spot volumes, and this one has been getting hammered with the rest. According to market chatter, some traders are already rotating out of high beta alts into stable plays, which only adds fuel to the selloff here.
On the 4H chart we have a straight waterfall into an old demand zone around 2.45-2.50, right where price is hanging now. RSI is below 30 but starting to put in higher lows while price prints lower lows - classic bullish divergence hinting at seller exhaustion. VPVR shows the next serious volume cluster up at 2.6-2.7, so I lean toward a corrective pop rather than another immediate leg down.
My base case ✅ a rebound toward 2.60 first, then possibly 2.70 if buyers actually defend this floor. For a tactical long I like entries near 2.45-2.52 with invalidation under 2.40 on a 4H close; below that, the door opens for a slide toward 2.20 and I would rather stay flat or even look short ⚠️. I might be wrong, but ignoring this level completely looks crazier to me than trying a small, tightly risked long.
BGB/USDT Potential 100% ++BGB/USDT Potential 100% ++
Accumulate under $3.9 - $5.0
Targets Points
Mid term targets
TP 1 : $8
TP 2 : $10
TP 3 : $15
TP 4 : $20
TP 5 : $25
Long term targets
TP 1 : $45
TP 2 : $60
TP 3 : $70
*Comparison between Bitget Token (BGB) burning and Binance Coin (BNB) burning:
Bitget’s BGB burns are explicitly tied to real on-chain gas usage and a percentage of platform profits, with a clear roadmap to burn down to 100 million and full transparency.
Binance’s BNB burns combine an ongoing auto-burn formula and real-time burning from gas fees to gradually reduce supply in a more passive, protocol-level manner.
Both approaches aim to induce scarcity and potentially support token value, but Bitget emphasizes utility-aligned burns and rapid supply reduction, whereas Binance focuses on steady, formula-driven deflation aligned with chain activity.
BGB/USDT — Symmetrical Triangle: Breakout or Fakeout?Overview
BGB/USDT is consolidating within a symmetrical triangle pattern (descending resistance + slightly ascending support) as volatility narrows toward the apex. The price is currently around 4.58, after a rejection near the upper trendline — possibly a liquidity grab. This setup usually precedes a strong move once a valid breakout or breakdown occurs.
---
Pattern Explanation
Type: Symmetrical / contracting triangle
Key characteristics: Shrinking volatility, lower highs + higher lows, volume gradually decreasing.
Context: The structure formed after a strong correction from highs, which often implies a continuation bias unless a clear bullish breakout emerges.
---
Key Levels
Current price: 4.58
Near-term resistance: 5.03 → 5.60 → 5.99
Major resistance zones: 7.62 → 8.11 → 8.50 (ATH zone)
Support: Triangle base (dynamic support around 4.0–4.4), then 3.60 and 3.00 if breakdown continues.
---
Bullish Scenario (confirmation required)
Confirmation: Daily close above the upper trendline with strong volume and successful retest.
Entry idea: Conservative entry above 5.03 with retest confirmation.
Targets:
TP1: 5.60
TP2: 5.99
Aggressive: 7.62 → 8.11 → 8.50
Measured move projection: (8.50 − 3.60 = 4.90). Breakout from ~5.03 could project up to 9.93 (theoretical target).
Invalidation: Failure to hold above 5.03 or a rejection back inside the triangle.
Stop-loss: Below retest breakout (~4.40) or below triangle support.
---
Bearish Scenario (confirmation required)
Confirmation: Daily close below triangle support with above-average volume.
Entry idea: Short entry after breakdown + failed retest.
Targets:
TP1: 4.00
TP2: 3.60
TP3: 3.00 (if strong continuation).
Invalidation: Daily close above the upper trendline or reclaim above 5.03.
Stop-loss: Above failed breakout level or triangle resistance.
---
Things to Watch
Volume: Breakouts without volume are often fakeouts.
Retest: Strong confirmation if old resistance turns into new support (bullish) or old support flips into resistance (bearish).
Daily candle close: Wick alone is not reliable; wait for candle close.
Market correlation: BTC and ETH trends may influence BGB’s breakout direction.
---
Risk Management Notes
Limit risk per trade (1–2% capital).
Use scaling entries if breakout is sharp.
Always set stop-loss and take-profit in advance.
Be cautious of false breakouts — triangles often fake one side before moving in the opposite direction.
---
Conclusion:
BGB/USDT is consolidating in a symmetrical triangle, signaling a potential big move ahead. For bulls, watch for a close above 5.03 with volume. For bears, confirmation comes with a close below triangle support. Until then, the setup remains neutral.
> Disclaimer: This is not financial advice. Do your own research and manage risk accordingly.
#BGBUSDT #CryptoAnalysis #TechnicalAnalysis #SymmetricalTriangle #Breakout #SupportResistance #SwingTrade
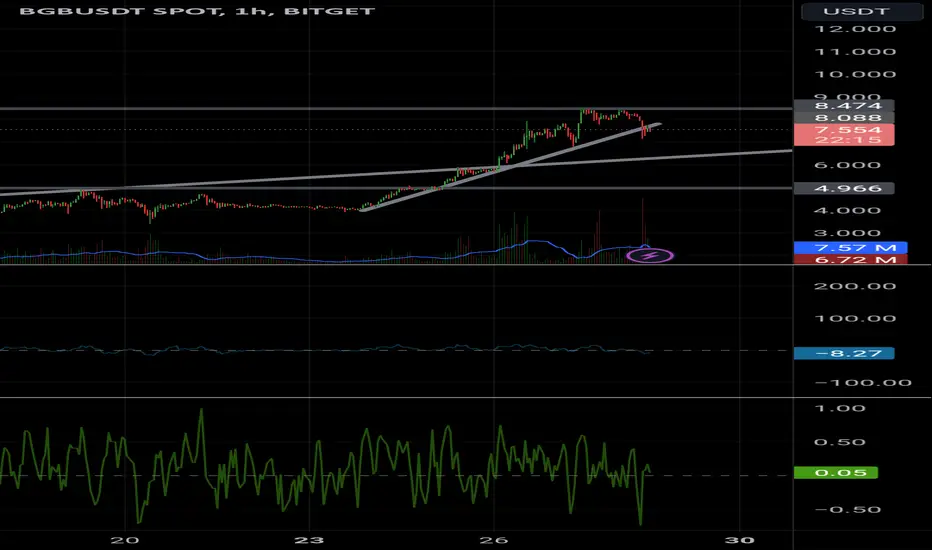
Bitget token ( BGB)Bgb usdt Daily analysis
Time frame 4hours
BgB is bitget exchange token
OT has unbelievable growth before yesterday
7days 81%
30days 366%
90 days 623%
YTD 1164%
Today, this growth stopped ✋️ and fell down 10%
I think we have two price to enter 7.3$ and 6$
But here is a problem
If you want to buy this token , only bitget , bitfinix and mexc exchanges are seller , not famous exchanges like Binance and kraken and...
This problem when you want to trade bgb will be a big problem.
So you have to be careful.👌👌
BGB – Triangle Compression Across Multiple Timeframes 📆 On the Weekly and 3D timeframes, NYSE:BGB is sitting right at the edge of a major triangle support zone — compression is getting tight 🛡️.
📆 Zooming into the Daily timeframe, we can spot a smaller symmetrical triangle building inside the larger structure — a textbook double compression setup 📐.
This kind of formation often precedes explosive moves. A breakout could spark a strong bullish wave, while a breakdown may invite heavy selling.
👀 High-stakes zone — keep your eyes on the breakout direction!
Not financial advice. BITGET:BGBUSDT
Bitget Token (BGB): Seeing Smaller Recovery and 14% Correction.BGB coin might form a similar pattern to what we have done previously, right after forming that big CME gap at a bullish trend. We are keeping our attention on all those zones we have described now, as there might be some good potential trades that can be taken.
More in-depth info is in the video—enjoy!
Swallow Academy
Buy Trade Strategy for BGB: Tapping Into Bitget’s EcosystemDescription:
This trading idea highlights BGB, the native utility token of the Bitget exchange, one of the fastest-growing platforms in the crypto trading space. BGB serves multiple roles within the Bitget ecosystem, including fee discounts, launchpad access, copy trading benefits, and participation in exclusive events. With Bitget’s global expansion, increasing user base, and strategic partnerships, BGB is gaining traction as a key asset benefiting from the exchange’s overall growth. Its use case and deflationary tokenomics strengthen the fundamentals that support long-term value appreciation.
That said, the crypto market remains highly volatile and speculative. Factors such as regulatory changes, exchange performance, and market sentiment can significantly affect the price of BGB. Investors should consider both the growth potential and associated risks before entering a position.
Disclaimer:
This trading idea is for educational purposes only and is not financial advice. Trading cryptocurrencies like BGB involves substantial risk, including the possibility of losing your entire investment. Always perform independent research, assess your financial situation, and seek advice from a qualified financial professional before making investment decisions. Past performance is not indicative of future results.