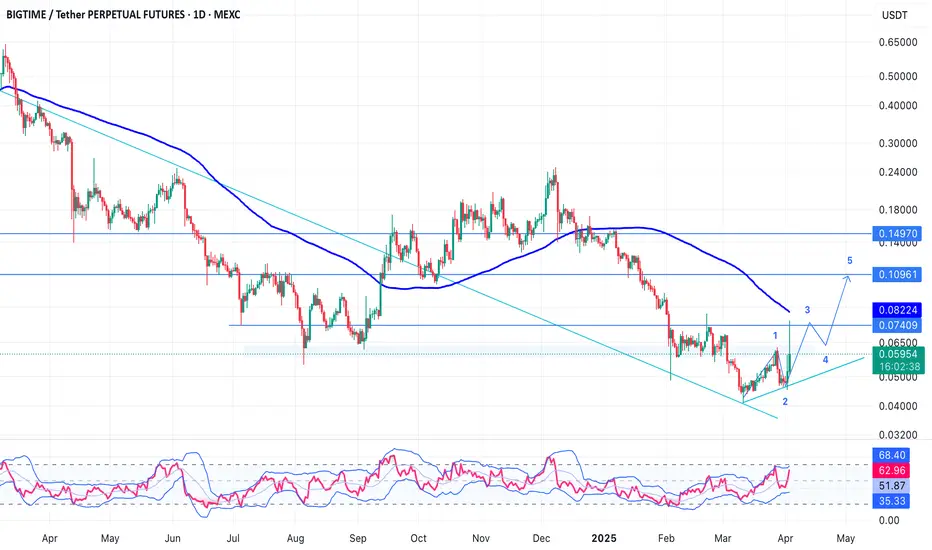
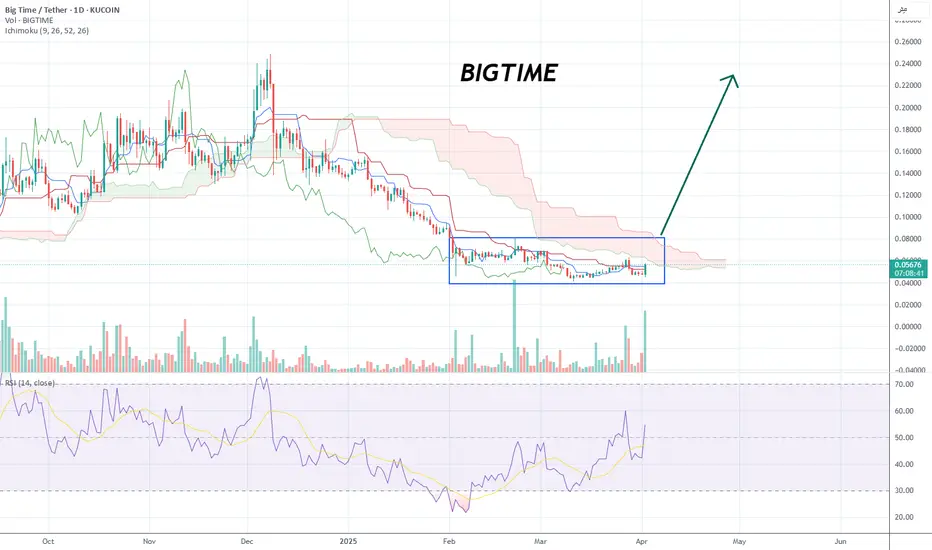
BIGTIME/USDT - Ready To Explode? Major Trendline Breakout?BIGTIME/USDT is starting to show signs of recovery after experiencing a long-term downtrend over the past several months. 🔥
On the 1D timeframe, price is currently testing a major descending trendline that has acted as strong resistance for a long time. Right now, the market is sitting at a critical area that could determine the next major direction. ⚡
━━━━━━━━━━━━━━━━━━
📉 Chart Structure & Pattern
🔻 Descending Trendline (Long-Term Downtrend)
Since the previous peak, BIGTIME has consistently formed:
❌ Lower Highs
❌ Lower Lows
This confirms that sellers have remained dominant in the medium-to-long term trend. 📊
However, several interesting signals are beginning to appear:
✅ Selling pressure is weakening
✅ Price is forming a base accumulation zone
✅ Volatility is decreasing
✅ Candles are slowly approaching the breakout area
Conditions like this often become an early signal before a major bullish impulse occurs. 🚀
━━━━━━━━━━━━━━━━━━
🟢 Bullish Scenario
The bullish scenario will become stronger if price manages to:
✔️ Break above the descending trendline
✔️ Close daily candles above resistance
✔️ Show strong buying volume
✔️ Successfully hold the breakout retest
If the breakout happens successfully, the potential move toward the next resistance zones becomes significantly stronger. 🔥
🎯 Bullish Targets:
📌 0.01650
📌 0.01800
📌 0.01900
📌 0.02200
📌 0.02450
📌 0.02650
The 0.02450 – 0.02650 zone becomes a major resistance area and the next key bullish target. 🚀
━━━━━━━━━━━━━━━━━━
🔴 Bearish Scenario
The bearish scenario still needs attention if:
❌ Price fails to break the trendline
❌ Strong rejection appears at diagonal resistance
❌ Buyer volume weakens
❌ The crypto market faces another bearish wave
📌 Important Support Levels:
🛡️ 0.01270
🛡️ 0.01153
If the major support at 0.01153 breaks down, BIGTIME could continue its downtrend and potentially create new lows. 📉
━━━━━━━━━━━━━━━━━━
📊 Conclusion
BIGTIME is currently sitting at a very important decision zone. 👀
From a technical perspective:
✅ Momentum is slowly recovering
✅ Sellers are losing strength
✅ Breakout potential is becoming clearer
However, the market still needs:
⚠️ Breakout confirmation
⚠️ Strong volume
⚠️ A valid retest
Before entering a larger bullish reversal phase. 🚀
Traders should still apply proper risk management because the current area remains a critical market decision zone. 📌
━━━━━━━━━━━━━━━━━━
#BIGTIME #BIGTIMEUSDT #Crypto #CryptoTrading #TradingView #Altcoin #Bullish #Breakout #TechnicalAnalysis #CryptoAnalysis #SupportResistance #Trendline #Reversal #Altseason #Bitcoin #CryptoMarket #Trader #ChartAnalysis #OKX #DescendingTrendline
In-depth trading ideas
BIGTIMEUSDT Forming Bullish MomentumBIGTIMEUSDT is forming a clear bullish momentum pattern, a classic bullish reversal signal that often indicates an upcoming breakout. The price has been consolidating within a narrowing range, suggesting that selling pressure is weakening while buyers are beginning to regain control. With consistent volume confirming accumulation at lower levels, the setup hints at a potential bullish breakout soon. The projected move could lead to an impressive gain of around 70% to 80% once the price breaks above the wedge resistance.
This bullish momentum pattern is typically seen at the end of downtrends or corrective phases, and it represents a potential shift in market sentiment from bearish to bullish. Traders closely watching BIGTIMEUSDT are noting the strengthening momentum as it nears a breakout zone. The good trading volume adds confidence to this pattern, showing that market participants are positioning early in anticipation of a reversal.
Investors’ growing interest in BIGTIMEUSDT reflects rising confidence in the project’s long-term fundamentals and current technical strength. If the breakout confirms with sustained volume, this could mark the start of a fresh bullish leg. Traders might find this a valuable setup for medium-term gains, especially as the pattern completes and buying momentum accelerates.
✅ Show your support by hitting the like button and
✅ Leaving a comment below! (What is your opinion about this Coin?)
Your feedback and engagement keep me inspired to share more insightful market analysis with you!
BIGTIMEUSDT 1DConsider buying a small bag of #BIGTIME. In case of a breakout above the resistance cluster, which includes the descending resistance, the Ichimoku Cloud, and the daily SMA50, the potential upside targets are:
🎯 $0.01474
🎯 $0.01666
🎯 $0.01822
🎯 $0.01978
🎯 $0.02199
🎯 $0.02481
⚠️ Always remember to use a tight stop-loss and maintain proper risk management.
BIGTIMEUSDT UPDATEBIGTIME Technical Setup Pattern: Falling Wedge Breakout Current Price: $0.01300 Target Price: $0.01940 Target % Gain: 50.72% BIGTIME is breaking out of a falling wedge on the 1D timeframe with price pushing above resistance and showing early bullish momentum, structure suggests reversal after prolonged downtrend with potential continuation if volume sustains Time Frame: 1D
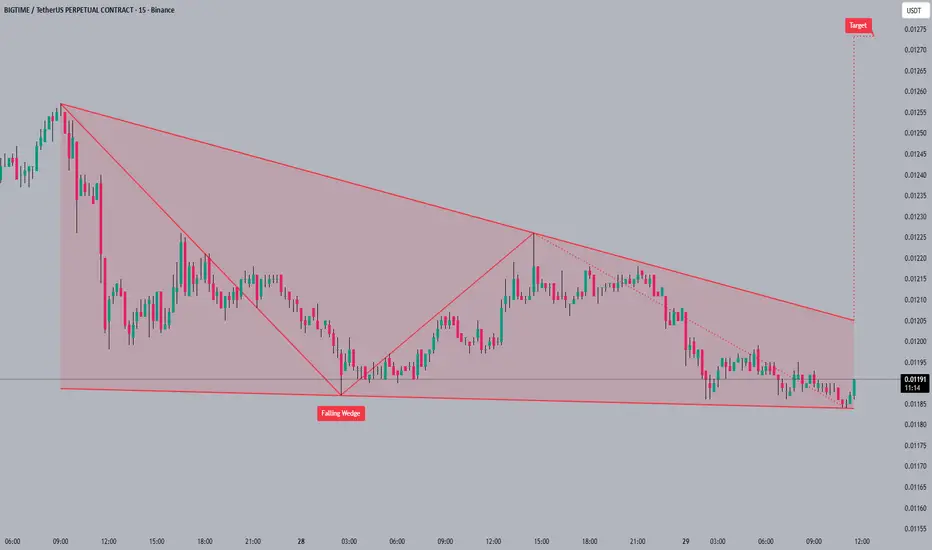
#BIGTIME#BIGTIME is currently trading at the bottom of a falling wedge pattern 📉. The falling wedge is a bullish pattern 🐂 that typically indicates a potential breakout to the upside. The next target for #BIGTIME after breaking out of the wedge is around 0.01275 🚀.
It's important to be patient and wait for confirmation before entering a trade 👍.
#BIGTIME #crypto #trading #altcoins
BIGTIME is on the verge of a price explosion (4H)The price has broken an important trendline, formed a bullish CH, and swept the liquidity pool at the bottom of the chart.
On the pullback to the two entry points we’ve marked, the position can be entered using DCA.
The targets are shown on the chart.
targets: 0.01406$ _ 0.01455$ _ 0.01501
A daily candle closing below the invalidation level will invalidate this analysis.
If you would like us to analyze a coin or altcoin for you, first like this post, then comment the name of your altcoin below.
What is your opinion about this altcoin?
BIGTIME Buy/Long Signal (4H)Considering that a large portion of the previous long shadow has been filled on the chart (the extended lower line marks the bottom of the previous long shadow), the chart is expected to move toward equilibrium, and we may see recovery moves.
Additionally, the strong bearish candle has been engulfed, and we have a bullish CH on the chart.
On a pullback to the support zones, we can look to enter buy/long positions.
The targets have been marked on the chart.
In any case, this is a light and volatile coin, so don’t forget proper position sizing, risk management, and leverage control.
Do not enter the position without capital management and stop setting
Comment if you have any questions
thank you
BIGTIMEUSDT — Descending Triangle Nearing Breakout or Breakdown?Full Analysis
The BIGTIME/USDT chart on the 4D timeframe (OKX) shows a prolonged downtrend with consistent lower highs, capped by a strong descending trendline (yellow). At the same time, price has been holding within a major support zone between 0.038 – 0.055 USDT (yellow box).
This structure forms a Descending Triangle — a classic pattern that often signals bearish continuation, but in some cases, it can also mark the final stage before a strong bullish reversal. Price is now approaching the apex of the triangle, meaning a major breakout (up or down) could happen soon.
---
🔹 Bullish Scenario (Breakout Reversal)
If buyers manage to break the descending trendline with a strong 4D close and higher volume, momentum could quickly shift to the upside. Key resistance levels to watch:
0.0655 USDT → First breakout confirmation.
0.0879 USDT → Next target.
0.1073 USDT → Critical mid-term resistance.
With enough momentum, BIGTIME could extend toward 0.2213 USDT or even 0.3196 USDT in the longer run.
📌 Note: A valid breakout usually comes with a volume spike and a successful retest above the broken trendline.
---
🔻 Bearish Scenario (Breakdown Continuation)
If selling pressure dominates and price loses the major support box 0.038 – 0.055 USDT, the downtrend is likely to extend.
Breakdown below 0.038 USDT on strong volume → clear bearish confirmation.
Next support area: 0.028 – 0.030 USDT.
Extreme target: retesting the historical low at 0.0145 USDT.
📌 Note: Statistically, descending triangles have a higher probability of breaking down, but confirmation is key.
---
⚖️ Technical Summary
Critical Zone: 0.038 – 0.055 USDT (main support).
Bullish confirmation: Break and close above trendline + 0.0655 USDT.
Bearish confirmation: Breakdown and close below 0.038 USDT.
Current pattern: Descending Triangle nearing its apex → Expect a decisive move soon.
BIGTIME is entering a high-pressure zone. In the coming weeks, the market will reveal whether this is the bottom before a reversal, or the continuation of a deeper downtrend.
---
#BIGTIME #BIGTIMEUSDT #CryptoAnalysis #Altcoin #TechnicalAnalysis #DescendingTriangle #CryptoBreakout #SupportResistance #ChartPattern
#BIGTIME #BIGTIMEUSD #BIGTIMEUSDT #Analysis #Eddy#BIGTIME #BIGTIMEUSD #BIGTIMEUSDT #Analysis #Eddy
A reversal structure has formed on the weekly and daily time frames, and the necessary confirmations have been given on the weekly time frame. Considering the structure formed on the above time frame, as well as the behavior of this currency in the past chart, it is expected that this currency will perform a good pump.
I have identified the important supply and demand zones of the higher timeframe for you.
This analysis is based on a combination of different styles, including the volume style with the ict style.
Based on your strategy and style, get the necessary confirmations for this analysis to enter the trade.
Don't forget about risk and capital management.
The responsibility for the transaction is yours and I have no responsibility for your failure to comply with your risk and capital management.
💬 Note: The red order block cannot stop the growth of the price of this currency and by 0.29 cents this currency will be pumped more than 350%.
Be successful and profitable.
BIGTIME – Dual Breakout Unfolding Across Timeframes $BIGTIME is stepping into the spotlight with back-to-back breakout signals across multiple charts 🚀.
On the 12-hour timeframe, price is breaking out of a round bottom formation—a classic accumulation pattern shifting into momentum mode 🔄. This kind of structure often precedes strong moves if follow-through volume kicks in.
Meanwhile, the 4-hour chart adds more fuel to the setup with an ascending channel breakout 📈. If the current breakout levels hold on retest, this could trigger the next leg higher.
Momentum is aligning across timeframes—stay alert, $BIGTIME might be ready to accelerate from here 👀.
BIGTIME current chart and possible indicators (daily)MEXC:BIGTIMEUSDT is not the easiest chart to analyze - due to it's short story and thus lack of information. BIGTIME had a huge ralley to 1 dollar back in December 2023 and was, since then, in an downtrend.
That downtrend found its bottom in August 2024 at around 5 cent and consolidated out of the downtrend (bottomed out) at that time. Since then (or at least since september) we can see a steady climb with higher highs and higher lows towards the VAH (value area high) of the whole market at around 26 cents.
if we use fibonacci to evaluate the bottom as the low and the last higher high as the high, we see a 50% fib retracement level (if it retraces from here) at around 13 cents. given the current sentiment, the fact that bigtime is a very hyped game coin and that there is high potential to rip this bullmarket, given the steady climb since september - I see BIGTIME climb higher towards the 50% fib ob the all time high (52 cents) and further progression towards the Golden Pocket at 64-67 cents and a next hold at 79 cents (for now).
of course that doesn't mean that BIGTIME won't go higher, quite the contrary. it just shows the potential we face right now. I think BIGTIME could easily hit 3 $ this run - which would make it an 14x from here even tho we had a quite substantial run from the bottom (340%)
if the channel breaks, it doesn't invalidate the bullish sentiment.
BIGTIME/USDT Ready to Explode! End of a Long Downtrend? Breakout🧠 Chart Pattern & Technical Structure:
✅ Main Pattern: Descending Triangle Breakout Setup
A Descending Triangle has formed from the 2023 high to mid-2025, indicating consolidation after a strong downtrend.
Strong horizontal support between $0.05266 – $0.06550 has been tested multiple times, showing strong accumulation in this zone.
The downtrend resistance line is being squeezed, suggesting a potential breakout is imminent if price closes strongly above it.
📈 Bullish Scenario:
If the price successfully breaks above the diagonal resistance:
1. Breakout confirmation would be a strong 4D candle close above $0.08788.
2. Bullish price targets based on historical resistance zones and Fibonacci levels:
🎯 $0.10728 (initial resistance)
🎯 $0.22137 – $0.25000 (strong psychological and technical resistance)
🎯 $0.31966 (former consolidation zone)
🎯 $0.52908 – $0.73257 (major supply zone)
🎯 Ultimate Target: $0.99500
🟢 A rise in volume and a clear higher high would further confirm the bullish trend continuation.
📉 Bearish Scenario:
If price fails to break out and falls below the strong support zone:
1. A breakdown below $0.05266 could lead to:
🔻 $0.04000
🔻 $0.02800
🔻 $0.02000 – $0.01450 (extreme support zone)
⚠️ This bearish case becomes more likely if volume weakens and market sentiment turns risk-off, especially if BTC or broader crypto trends turn bearish.
🧱 Key Support & Resistance Levels:
Strong Support: $0.06550 – $0.05266
Key Resistance: $0.08788 – $0.10728
Next Bullish Targets: $0.22137 / $0.31966 / $0.52908 / $0.73257
🧭 Conclusion:
BIGTIME/USDT is at a critical turning point. A bullish breakout from the descending triangle could trigger a significant upside move. However, caution is advised if the price fails to hold support. Wait for confirmation of breakout before entering heavy positions.
#BIGTIME #BIGTIMEUSDT #CryptoBreakout #AltcoinSeason #DescendingTriangle #CryptoAnalysis #TradingView #BullishCrypto #CryptoSignal #TechnicalAnalysis #CryptoBreakoutAlert
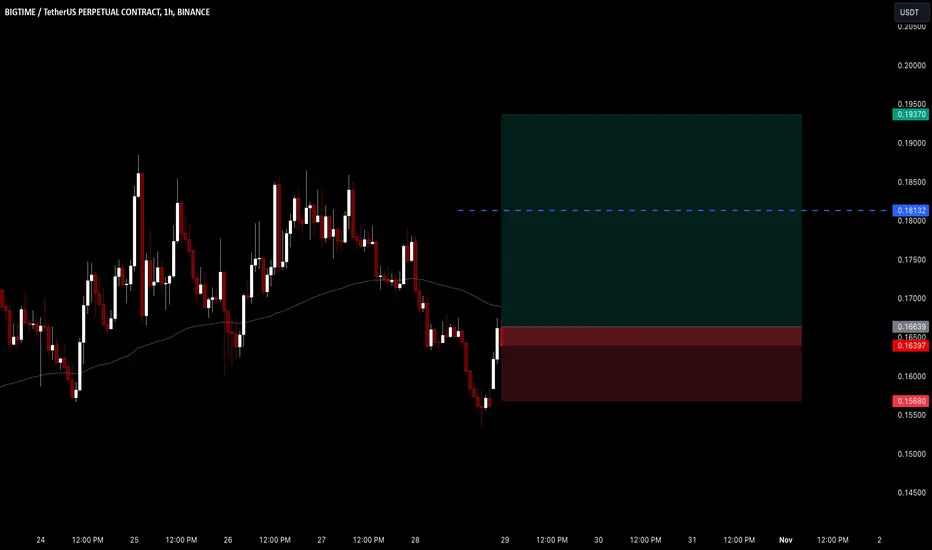
$BIGTIME LONG TRADE
**🎯 Entry:** 0.1625 – Entering at a strategic level for potential upside.
**📈 Targets:** 0.1694, 0.181, 0.1937 – Key levels to watch for profit-taking.
**🛑 Stop Loss:** 0.1568 – Manage risk by sticking to this stop to limit downside.
💡 *Always manage your risk and adjust your position size accordingly to protect capital.*
BIGTIME/USDT Analysis (1H Timeframe)Price has successfully broken the descending trendline, signaling a trend reversal from bearish to bullish. The market is now testing a key supply zone around $0.07450 – $0.07550.
Trend Shift: A bullish breakout from the downtrend line indicates buyers are gaining control.
Support: Previous resistance near $0.07370 may now act as strong support on any pullback.
Resistance: Price is currently at resistance; if broken, next key zones are around $0.07650 and $0.07850.
Bias: Bullish, as long as price holds above the broken trendline and EMA. However, short-term rejection from current resistance is possible before continuation.
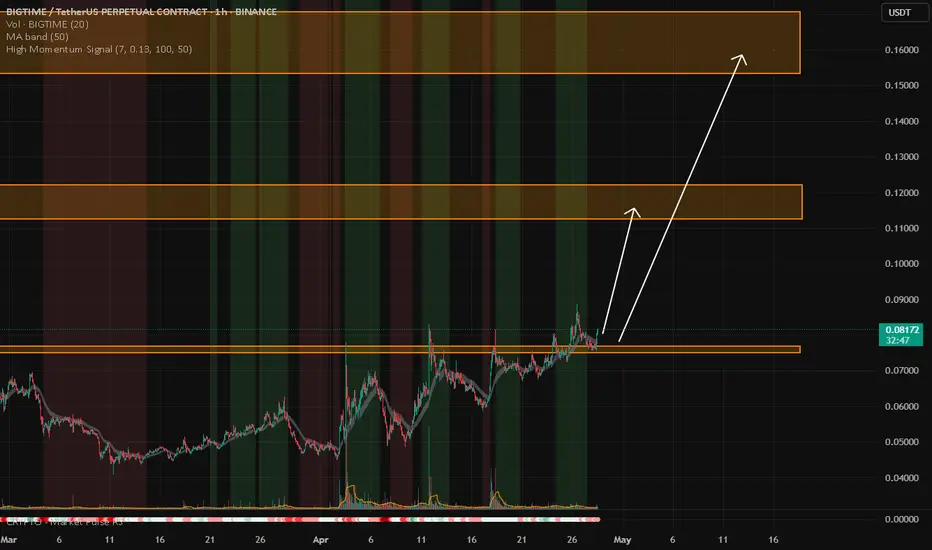
BIGTIME/USDTKey Level Zone: 0.07500 - 0.07690
HMT v8.1 detected. The setup looks promising, supported by a previous upward/downward trend with increasing volume and momentum, presenting an excellent reward-to-risk opportunity.
HMT (High Momentum Trending):
HMT is based on trend, momentum, volume, and market structure across multiple timeframes. It highlights setups with strong potential for upward movement and higher rewards.
Whenever I spot a signal for my own trading, I’ll share it. Please note that conducting a comprehensive analysis on a single timeframe chart can be quite challenging and sometimes confusing. I appreciate your understanding of the effort involved.
Important Note :
Role of Key Levels:
- These zones are critical for analyzing price trends. If the key level zone holds, the price may continue trending in the expected direction. However, momentum may increase or decrease based on subsequent patterns.
- Breakouts: If the key level zone breaks, it signals a stop-out. For reversal traders, this presents an opportunity to consider switching direction, as the price often retests these zones, which may act as strong support-turned-resistance (or vice versa).
My Trading Rules
Risk Management
- Maximum risk per trade: 2.5%.
- Leverage: 5x.
Exit Strategy
Profit-Taking:
- Sell at least 70% on the 3rd wave up (LTF Wave 5).
- Typically, sell 50% during a high-volume spike.
- Adjust stop-loss to breakeven once the trade achieves a 1.5:1 reward-to-risk ratio.
- If the market shows signs of losing momentum or divergence, ill will exit at breakeven.
The market is highly dynamic and constantly changing. HMT signals and target profit (TP) levels are based on the current price and movement, but market conditions can shift instantly, so it is crucial to remain adaptable and follow the market's movement.
If you find this signal/analysis meaningful, kindly like and share it.
Thank you for your support~
Sharing this with love!
HMT v2.0:
- Major update to the Momentum indicator
- Reduced false signals from inaccurate momentum detection
- New screener with improved accuracy and fewer signals
HMT v3.0:
- Added liquidity factor to enhance trend continuation
- Improved potential for momentum-based plays
- Increased winning probability by reducing entries during peaks
HMT v3.1:
- Enhanced entry confirmation for improved reward-to-risk ratios
HMT v4.0:
- Incorporated buying and selling pressure in lower timeframes to enhance the probability of trending moves while optimizing entry timing and scaling
HMT v4.1:
- Enhanced take-profit (TP) target by incorporating market structure analysis
HMT v5 :
Date: 23/01/2025
- Refined wave analysis for trending conditions
- Incorporated lower timeframe (LTF) momentum to strengthen trend reliability
- Re-aligned and re-balanced entry conditions for improved accuracy
HMT v6 :
Date : 15/02/2025
- Integrated strong accumulation activity into in-depth wave analysis
HMT v7 :
Date : 20/03/2025
- Refined wave analysis along with accumulation and market sentiment
HMT v8 :
Date : 16/04/2025
- Fully restructured strategy logic
HMT v8.1 :
Date : 18/04/2025
- Refined Take Profit (TP) logic to be more conservative for improved win consistency
$BIGTIME LONG TRADE
**🎯 Entry:** 0.1625 – Entering at a strategic level for potential upside.
**📈 Targets:** 0.1694, 0.181, 0.1937 – Key levels to watch for profit-taking.
**🛑 Stop Loss:** 0.1568 – Manage risk by sticking to this stop to limit downside.
💡 *Always manage your risk and adjust your position size accordingly to protect capital.*
BIGTIME/USDT Analysis – 30-Minute Chart (OKX)BIGTIME/USDT Analysis – 30-Minute Chart (OKX)
Key Support Levels:
Immediate support: 0.06043 USDT
Stronger support: 0.05960 – 0.05515 USDT (Potential entry zone)
Stop-loss (SL): Below 0.04916 USDT (-12.19% risk)
Key Resistance Levels:
First resistance: 0.06485 USDT (Take Profit 1)
Next resistance: 0.06902 – 0.07002 USDT (Major supply zone)
Higher targets: 0.07511 – 0.08055 USDT
Indicators & Market Structure:
Stochastic RSI is in an overbought zone, suggesting a possible short-term pullback.
EMA 20, 50, 100, 200 show bullish momentum, with the price above EMA 20 and EMA 50.
Bearish pressure is decreasing, as buy signals and TP targets are being triggered.
Trade Plan:
Bullish case: If BIGTIME/USDT holds 0.06043 USDT, it may continue towards 0.06485 – 0.07002 USDT.
Bearish case: If price falls below 0.05960 USDT, a deeper correction to 0.05515 USDT is likely.
📌 Summary:
BIGTIME is in a short-term uptrend, but Stochastic RSI suggests a possible pullback before continuation. Holding 0.06043 USDT is key for further upside toward 0.07002 USDT. If price loses support, a retest of 0.05515 USDT is possible. 🚀
Maybe $0.11!A strong rejection from $0.074 and a re-test of $0.060! If it could pump toward $0.074 once more and break it with a strong bullish candle, $0.109 will be reachable. Since it is fluctuating almost on the price that was launched at most exchanges, it's unlikely to be deeply corrected from here.
TradeCityPro | BIGTIMEUSDT Final Downtrend?👋 Welcome to TradeCityPro Channel!
Let's analyze and review the new gaming coin BIGTIME and see what the market is going to be like. I feel like we're going to see the final downtrend.
🌐 Bitcoin Overview
Before starting today's altcoin analysis, let's look at Bitcoin on the 1-hour timeframe. Since yesterday, Bitcoin experienced a correction, which was necessary for the market, and it pulled back to the 102135 range. The next trigger for a long position will be a breakout above 104714.
Yesterday's correction, coupled with an increase in Bitcoin dominance, caused noticeable declines in some altcoins. This highlights the importance of monitoring BTC pairs in your checklist these days.
📊 Weekly Timeframe
This coin is not in an interesting situation on the weekly time frame and after being rejected from the resistance of 0.22109, it is continuing its downward trend and is recording a lower high and low
If the weekly candle closes like this and we lose the support of 0.06479, the declines will continue and if you are holding this coin, I suggest you exit temporarily and if it enters again, you will simply enter with a smaller number of this coin and your number of Tethers will be preserved
They are not really in good conditions for buying right now, but if the support is faked, we can get a trigger from them, but normally the best trigger is after the failure of 0.22109, but I repeat, the fake of this support can form a new trend!
📈 Daily Timeframe
The situation is the same on the weekly time frame and the probability of a fall is higher than ever, and after the rejection of this important resistance at 0.22785, we have experienced a 75% drop so far!
After this drop, we went into the range box between 0.05801 and 0.07342, and it is natural to suffer a little until our RSI rejected the middle line of 50, which again increased the probability of a fall.
Also, today's daily candle is very important, and if it closes like this, we are engulfing a few of our previous candles and the probability of a support floor breakdown is higher than ever, so you can open a short position and exit the spot, and your second entry for the spot breakdown will be 0.09270!
📝 Final Thoughts
Stay calm, trade wisely, and let's capture the market's best opportunities!
This analysis reflects our opinions and is not financial advice.
Share your thoughts in the comments, and don’t forget to share this analysis with your friends!