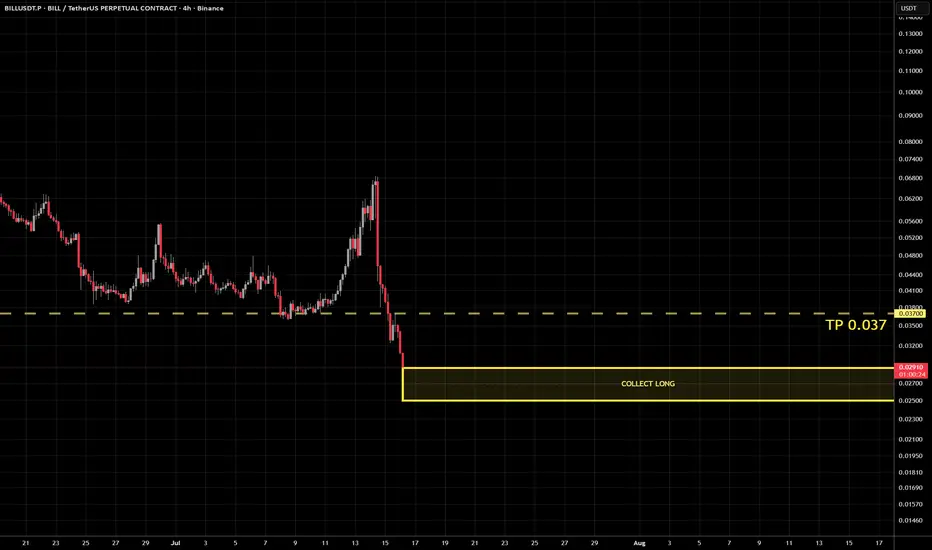
Hey Bill!Luke 21:28 — "And when these things begin to come to pass, then look up, and lift up your heads; for your redemption draweth nigh."
BILL was dismissed. Overlooked. Cast aside by the great traders.
Yet the Chart knoweth. The humble are lifted.
0.037 is where the redemption draweth nigh.
Look up. The heads are lifting.
Billions / USDT
No trades
No trades
In-depth trading ideas
$BILL saw a sharp rejection after testing the resistance zone. NYSE:BILL saw a sharp rejection after testing the resistance zone.
The key area to watch now is the $0.036-$0.040 support zone. As long as price holds this range, the overall bullish structure remains intact and another attempt toward the highs is still possible.
Losing this support would weaken the current setup, but for now, this remains the most important level to watch.
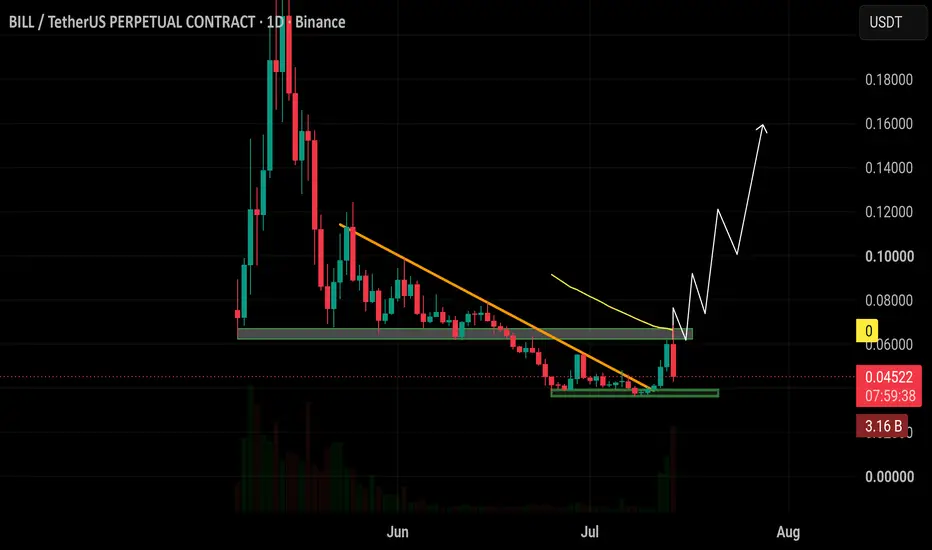
$BILL has broken above the descending trendline and is now testiNYSE:BILL has broken above the descending trendline and is now testing the key resistance around $0.067.
A daily close above $0.067, followed by a successful hold, would confirm the breakout and strengthen the bullish structure. If that happens, the next leg higher becomes much more likely.
For now, this is the level to watch. A clean reclaim above $0.067 could bring fresh momentum into the trend.
BILLUSDT Forming Bullish MomentumBILLUSDT is forming a clear bullish momentum pattern, a classic bullish wave signal that often indicates an upcoming breakout. The price has been consolidating within a narrowing range, suggesting that selling pressure is weakening while buyers are gradually regaining control. With consistent trading volume confirming accumulation at lower levels, the current setup hints at a potential bullish breakout in the near future. If the breakout is confirmed, the projected move could lead to an impressive gain of around 190% to 200%.
This bullish momentum pattern is commonly seen at the end of downtrends or corrective phases, signaling a potential shift in market sentiment from bearish to bullish. Traders closely watching BILLUSDT are noticing strengthening momentum as the price approaches a key breakout zone. Healthy trading volume further reinforces this setup, indicating that market participants are positioning early in anticipation of a sustained upward move.
Growing investor interest in BILLUSDT reflects increasing confidence in the project's long-term potential and its current technical structure. If buyers successfully push the price above resistance with sustained volume, it could mark the beginning of a powerful new bullish leg. The ongoing consolidation phase suggests steady accumulation, creating favorable conditions for a strong continuation rally once the breakout is confirmed.
Traders may find this an attractive medium-term opportunity, especially as the bullish momentum pattern nears completion and buying pressure continues to build. A confirmed breakout could attract additional market participation and accelerate the move toward the projected upside target.
✅ Show your support by hitting the like button.
✅ Leaving a comment below! (What is You opinion about this Coin)
Your feedback and engagement keep me inspired to share more insightful market analysis with you!
$BILL already delivered a solid 15% pump after breaking above 🚀 NYSE:BILL already delivered a solid 15% pump after breaking above the descending trendline, confirming the breakout setup perfectly.
After the breakout, price pushed higher and is now retesting the breakout area while maintaining its bullish structure. As long as the former trendline resistance continues to hold as support, the trend remains favorable.
The next key levels to watch are the 50 EMA and 99 EMA. A reclaim of both moving averages could fuel a move toward the $0.10-$0.12 range. 📈🔥
$BILL is approaching a major support zone while trading at the l🚀 NYSE:BILL is approaching a major support zone while trading at the lower boundary of a long-term descending trendline.
A strong reaction from this area could mark the start of a reversal, especially if price reclaims the trendline and moves back above the key moving averages. As long as support holds, the risk-to-reward remains attractive for a potential recovery move. 📈🔥
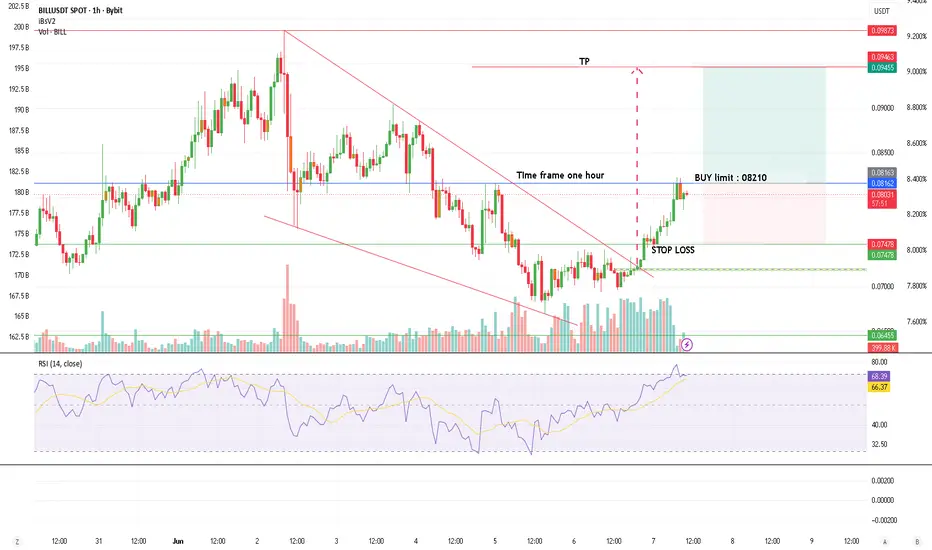
BILLUSDT Trade Summary (1H Time Frame)Market Structure:
Price has broken out of a falling channel/downtrend line on the 1-hour chart.
Bullish momentum is supported by increasing volume.
RSI is around 69, showing strong momentum but approaching the overbought zone.
Trade Setup:
Buy Limit: 0.08210 USDT
Stop Loss: 0.07478 USDT
Take Profit: 0.09455 USDT
Risk-to-Reward:
Potential upside: approximately 15%
Risk: approximately 9%
Risk-to-reward ratio: 1:1.7
$BILL is sitting at a major support zone after a prolonged downtNYSE:BILL is sitting at a major support zone after a prolonged downtrend, while the descending trendline continues to cap price action. A clean breakout above the trendline and reclaim of key moving averages could shift momentum back in favor of buyers, with the potential for a strong recovery toward the $0.20-$0.25 region 🚀📈
As long as support holds, this remains a chart worth watching closely. 👀
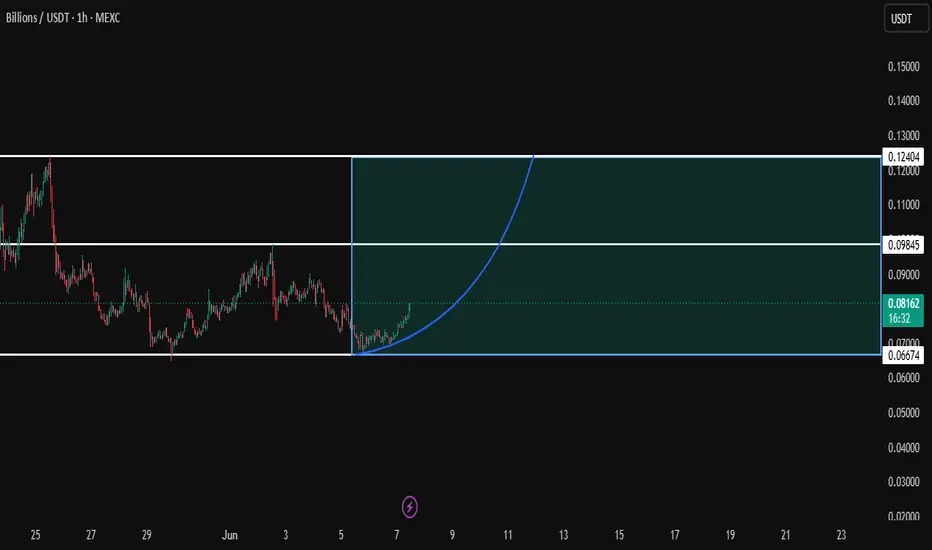
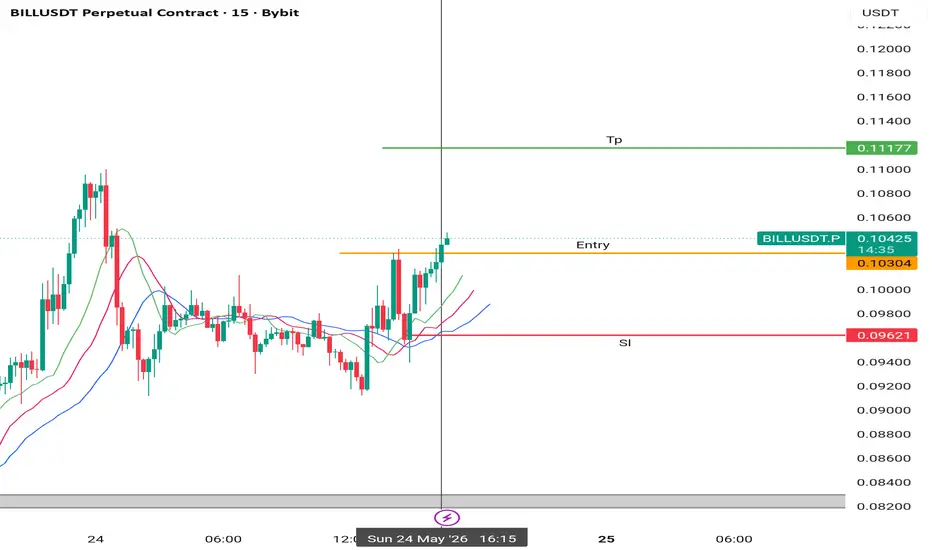
BILL/USDT - Bullish Consolidation Breakout PotentialThe BILL/USDT Perpetual Contract chart is showing an intriguing setup following a recent price correction. The asset is currently consolidating within a defined range (blue box), with bullish momentum building as indicated by the ascending trendline within this channel.
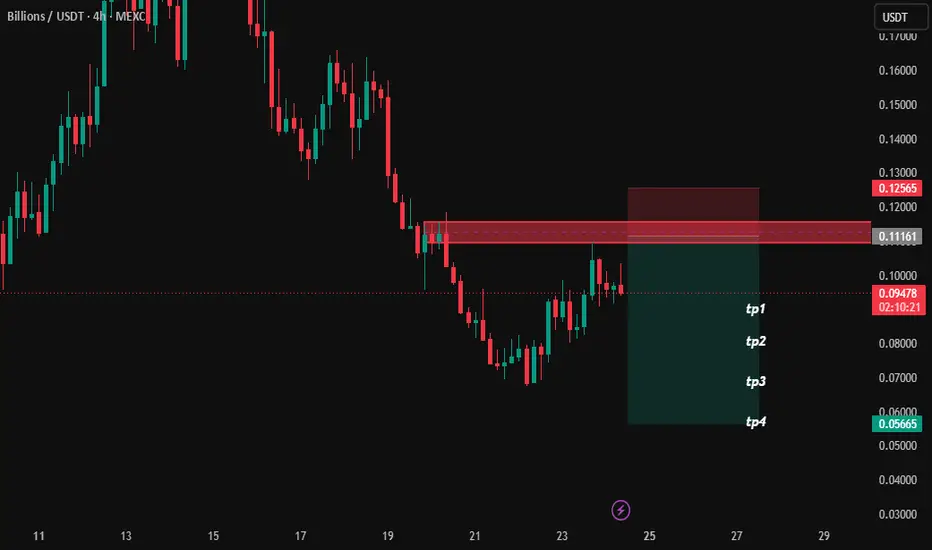
BILLIONS | Short Setup Around 0.11160 with Lower TF Confirmation#BILLIONS still looks bearish and is suitable for a short position with an optimal entry around 0.11160 and leverage of 2x or 3x. It would be even better if you get confirmation on the 1-hour timeframe within the red zone before entering. Stop loss and targets have also been defined.