BIO Protocol: Retrace, bullish resumption & 1,000%+ higher highA major correction is present on this chart, BIOUSDT, producing a falling wedge pattern and new all-time low. The all-time low is followed by a bullish breakout coupled with really high volume. Notice this exact same price pattern on hundreds of charts.
This sequence of events confirms the end of the downtrend, correction or bear market phase. It reveals the start of a bullish cycle and the current set up a bullish resumption or continuation.
After strong bullish action, there is always a retrace or correction. This is the action we saw on BIOUSDT during May-June resulting in a higher low. This higher low is the best news ever as it clearly reveals the presence of buyers above support and this instead prepares the market for a new bullish wave—huge potential for growth.
BIOUSDT grew more than 300% in its initial bullish jump, this is also repeated across many projects and altcoins. The next target based on Fibonacci proportions sits around $0.21 and this one opens up more than 500%, and it can all happen within just a few weeks, or it can take several months.
For example, the initial 300% move happened in 34 days. This new bullish wave can unfold in a time window comprising 2-4 months. The 500% is the first target but even higher is possible, we can see more than 1,000% total growth.
300% in just one month; 3-4X more is possible in two to four months. This is what the market is preparing for us.
Thanks a lot for your continued support.
Namaste.
In-depth trading ideas
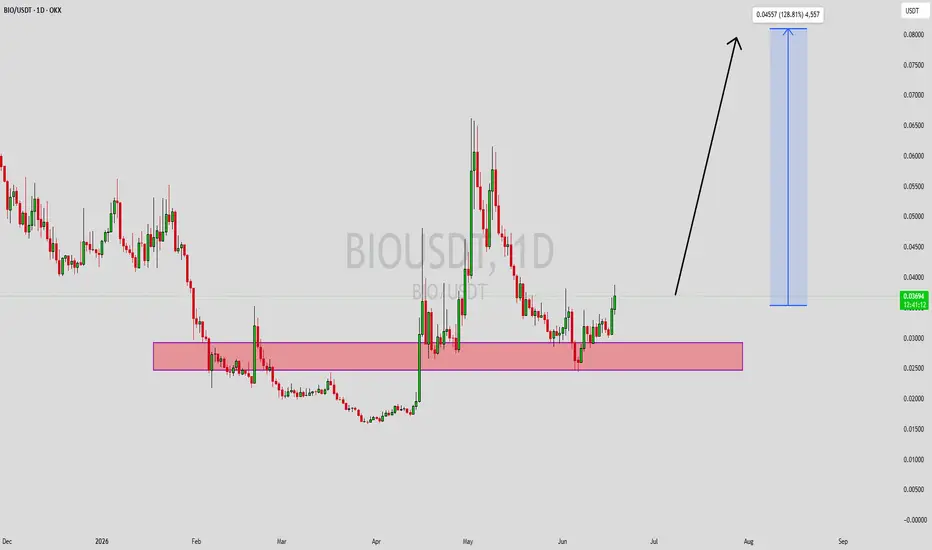
BIOUSDT Forming Bullish MomentumBIOUSDT is forming a clear bullish momentum pattern, a classic bullish wave signal that often indicates an upcoming breakout. The price has been consolidating within a narrowing range, suggesting that selling pressure is weakening while buyers are beginning to regain control. With consistent volume confirming accumulation at lower levels, the setup hints at a potential bullish breakout soon. The projected move could lead to an impressive gain of around 90% to 100% once the price breaks above the wedge resistance.
This bullish momentum pattern is typically seen at the end of downtrends or corrective phases, and it represents a potential shift in market sentiment from bearish to bullish. Traders closely watching BIOUSDT are noting the strengthening momentum as it nears a breakout zone. The healthy trading volume adds confidence to this pattern, showing that market participants are positioning early in anticipation of a reversal.
Investors’ growing interest in BIOUSDT reflects rising confidence in the project's long-term fundamentals and current technical strength. If the breakout confirms with sustained volume, this could mark the start of a fresh bullish leg. The current market structure suggests that buyers are steadily gaining control while bearish pressure continues to fade.
Traders might find this a valuable setup for medium-term gains, especially as the bullish momentum pattern completes and buying momentum accelerates. A confirmed breakout could attract additional market interest and potentially drive the price toward significantly higher levels in the coming trend cycle.
✅ Show your support by hitting the like button!
✅ Leaving a comment below! (What is your opinion about this Coin?)
Your feedback and engagement keep me inspired to share more insightful market analysis with you!
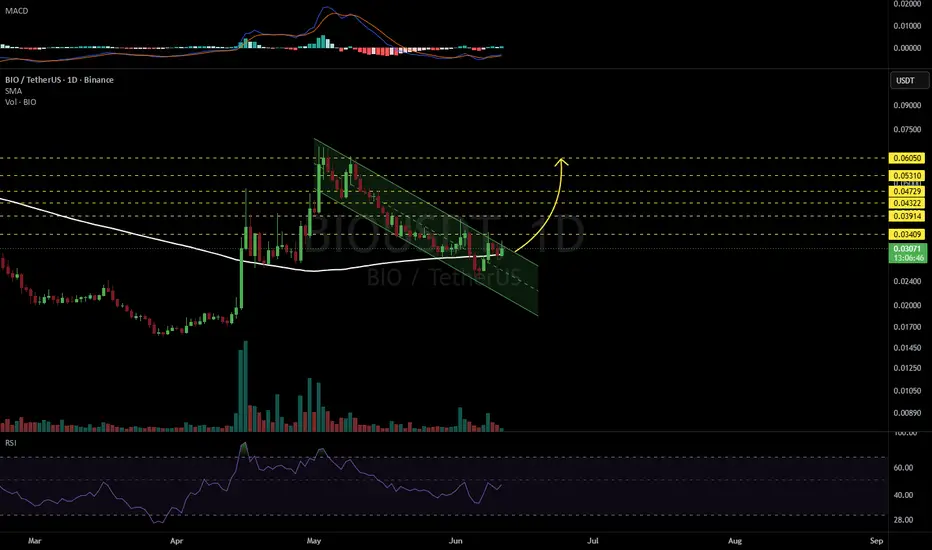
BIOUSDT 1D#BIO is currently trading within a bullish flag pattern on the daily chart and has bounced from the daily SMA100.
In case of a breakout above the flag resistance, the following upside targets could come into play:
🎯 $0.03409
🎯 $0.03914
🎯 $0.04322
🎯 $0.04729
🎯 $0.05310
🎯 $0.06050
⚠️ Always remember to use a tight stop-loss and maintain proper risk management.
BIO protocol price analysisLooks like MM is not done with #BIO yet 👀
Feels like the market maker in #BioProtocol is pushing
OKX:BIOUSDT toward the $0.11–0.13 liquidity zone.
If that assumption is correct — there may still be a chance to catch part of a +200–250% move in the coming days.
For context:
the first impulse from the bottom already delivered +170%+.
So the story might not be over yet.
But the key question remains:
is there real fundamental backing —
or just a liquidity-driven pump?
What do you think — continuation or time to take profits?
______________
◆ Follow us ❤️ for daily crypto insights & updates!
🚀 Don’t miss out on important market moves
🧠 DYOR | This is not financial advice, just thinking out loud
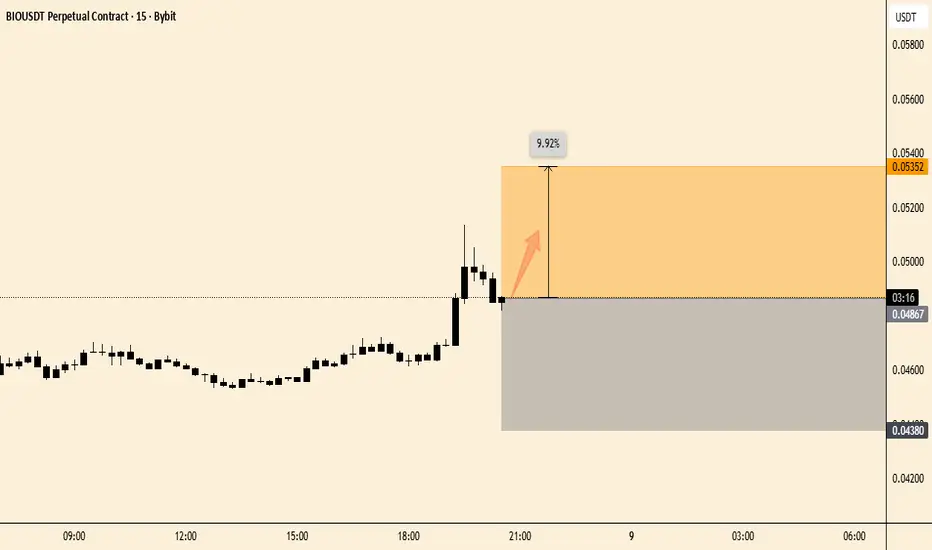
BIOUSDT Forming Bullish WaveBIOUSDT is forming a clear bullish wave pattern, a classic bullish reversal signal that often indicates an upcoming breakout. The price has been consolidating within a narrowing range, suggesting that selling pressure is weakening while buyers are beginning to regain control. With consistent volume confirming accumulation at lower levels, the setup hints at a potential bullish breakout soon. The projected move could lead to an impressive gain of around 140% to 150% once the price breaks above the wedge resistance.
This bullish wave pattern is typically seen at the end of downtrends or corrective phases, and it represents a potential shift in market sentiment from bearish to bullish. Traders closely watching BIOUSDT are noting the strengthening momentum as it nears a breakout zone. The good trading volume adds confidence to this pattern, showing that market participants are positioning early in anticipation of a reversal.
Investors’ growing interest in BIOUSDT reflects rising confidence in the project’s long-term fundamentals and current technical strength. If the breakout confirms with sustained volume, this could mark the start of a fresh bullish leg. Traders might find this a valuable setup for medium-term gains, especially as the wave pattern completes and buying momentum accelerates.
✅ Show your support by hitting the like button and
✅ Leaving a comment below! (What is your opinion about this Coin?)
Your feedback and engagement keep me inspired to share more insightful market analysis with you!
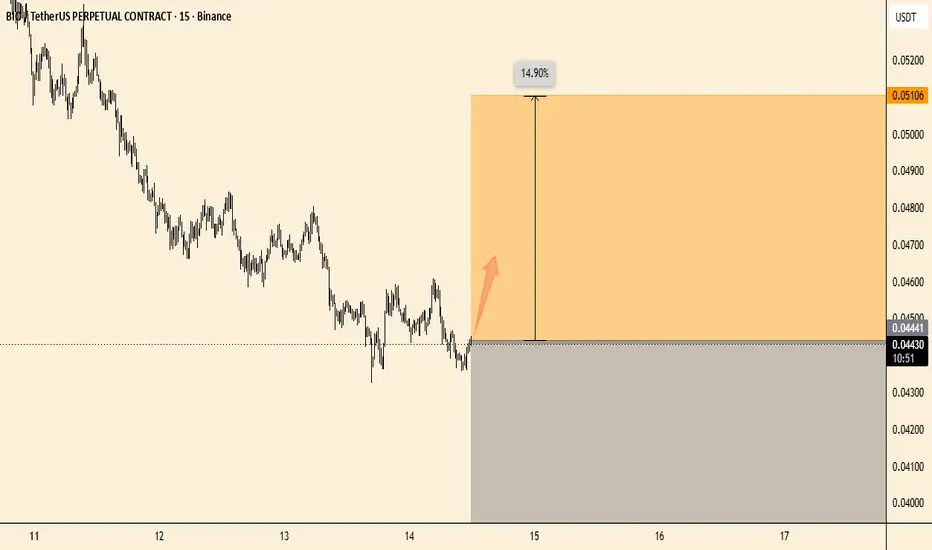
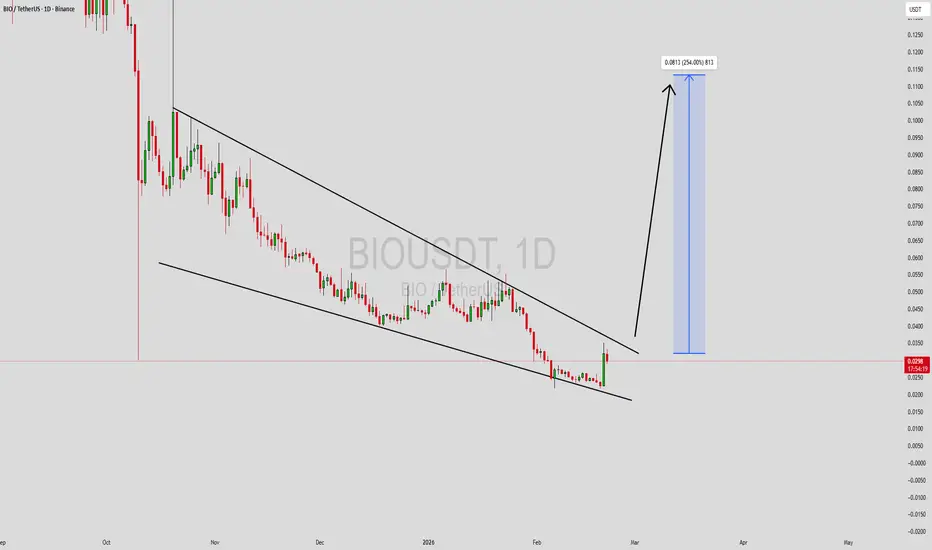
BIOUSDT Forming Falling WedgeBIOUSDT is forming a clear falling wedge pattern, a classic bullish reversal signal that often indicates an upcoming breakout. The price has been consolidating within a narrowing range, suggesting that selling pressure is weakening while buyers are beginning to regain control. With consistent volume confirming accumulation at lower levels, the setup hints at a potential bullish breakout soon. The projected move could lead to an impressive gain of around 190% to 200% once the price breaks above the wedge resistance.
This falling wedge pattern is typically seen at the end of downtrends or corrective phases, and it represents a potential shift in market sentiment from bearish to bullish. Traders closely watching BIOUSDT are noting the strengthening momentum as it nears a breakout zone. The good trading volume adds confidence to this pattern, showing that market participants are positioning early in anticipation of a reversal.
Investors’ growing interest in BIOUSDT reflects rising confidence in the project’s long-term fundamentals and current technical strength. If the breakout confirms with sustained volume, this could mark the start of a fresh bullish leg. Traders might find this a valuable setup for medium-term gains, especially as the wedge pattern completes and buying momentum accelerates.
✅ Show your support by hitting the like button and
✅ Leaving a comment below! (What is your opinion about this Coin?)
Your feedback and engagement keep me inspired to share more insightful market analysis with you!
BIOUSDT — Whale Buy Into Climactic Volume With Leverage Maxed
BIO is flashing one of the most extreme volume and leverage profiles on the board right now. A whale buy signal has triggered alongside climactic volume readings across both spot and futures — but leverage is pinned at the 100th percentile ceiling. This is the kind of setup where everything looks powerful until it isn't.
Price is at 0.03210 with futures lagging at 0.03185. The pair has retraced 42.2% from its high and is showing a 46.8% bounce at 1.1x — balanced, not yet a confirmed breakout. That retrace depth tells you this has been a meaningful pullback, and the recovery is still fighting to prove itself.
Directional scoring reads 66% bullish across 112 signals at a 2.03x ratio. Close-to-trigger signals favor bulls 10 to 4. Engulfing patterns are clean at 4 to 0, and star reversals print 3 to 0 bullish. Candle structure is nearly split at 7 to 7, and Ichimoku crosses are dead even at 5 to 5. The deep timeframe alignment supports bulls, but clarity is only 47% — the structure is contested beneath the headline number.
This is where it gets interesting. Spot volume Z-score is 3.84 — extreme. Futures Z is 5.8 — climactic. Combined reads 5.56, also climactic. The futures-to-spot ratio sits at 8.22x, elevated but not manipulative territory. Dollar volume shows 62.43M spot against 513.14M futures with the directional read as bull dominant. The spot-to-futures relationship is tagged as "Full Send" — both sides are firing hard. A whale buy signal is active with liquidity flagged as SHORT REKT, meaning short positions are getting liquidated into this move.
Leverage is 8.12x at the 100th percentile — absolute ceiling. The all-time max is 8.12x set zero bars ago, meaning leverage just hit its historical peak right now. The minimum was 0.88x roughly 321 bars back. Price sits at just 4% above its bottom. This is the critical tension: leverage is maxed while price is still near the floor. That combination either marks a capitulation flush that precedes a real reversal, or it marks the final speculative gasp before another leg down.
Premium is deeply backward at -1.09% with a Z-score of -5.9 — nearly six standard deviations below the mean. Yield reads -1190% APY favoring bulls from a contrarian funding perspective. The standard deviation is 0.17% with a mean Z sitting at 0.9 sigma normal. This premium dislocation is extreme and historically tends to mean-revert, which would support price recovery if the spot bid holds.
No squeeze is firing on spot or futures. Spot momentum is expanding upward at 477.1% — aggressive. Momentum direction is bearish but accelerating, with bandwidth at 45.02%. The Bollinger ceiling sits at 15.78 sigma. OBV Z reads 0.01 with strong upward trajectory — accumulation is building from a neutral base.
Bullish scenario: The whale buy and climactic spot volume represent genuine accumulation at the bottom. The extreme premium backwardation mean-reverts as shorts get squeezed out, driving price toward the 0.04 zone. Leverage unwinds from the ceiling as price rises on spot strength rather than futures speculation. The 46.8% bounce confirms into a breakout above 1.5x supply.
Bearish scenario: Leverage at the 100th percentile is the warning sign that cannot be ignored. This climactic volume spike marks a blow-off event rather than sustainable accumulation. The whale buy gets absorbed by overhead supply, momentum fails to sustain, and the premium stays deeply negative as funding continues to punish longs. Price retests the floor near 0.022 as the leverage unwind cascades.
Watch the leverage percentile closely. If it begins declining while price holds or rises, that is the confirmation that the speculative excess is clearing and the move is transitioning to spot-driven. If leverage stays pinned at ceiling while price stalls, treat this as a distribution event. The premium Z at -5.9 is historically rare — that alone deserves attention regardless of direction.
High-volatility setup with conflicting signals. The whale buy and volume profile say something real is happening, but ceiling leverage demands caution. Size accordingly and define risk at the 4% floor.
More analysis on my profile.
Tags: BIOUSDT, BIO, crypto, whale, volume analysis, leverage, market structure, futures, spot, supply demand
BIO/USDT On Accumulation, Get Ready For Exploding Soon?#BIO
BIO has completed a long downtrend and is now moving sideways inside an accumulation base.
Selling pressure is slowing, and price is stabilizing after the breakdown phase
As long as this base holds, the chart favors a slow recovery.
A break above the descending trendline would be the first real sign of trend shift 🚀
If the price loses the bottom support, downside pressure could return
BIO/USDT - W pattern recovery August 2025 marked a historical milestone for BIO, delivering a powerful ~500% impulsive rally. This move confirmed strong market interest and shifted BIO into a higher valuation regime. After such an expansion, a corrective and stabilization phase is both healthy and necessary
BIOUSDT 1D#BIO is moving near the descending resistance on the daily chart and has printed a bullish RSI divergence. Consider buying a small bag here and another near the support zone. In case of a breakout above the resistance, the potential targets are:
🎯 $0.0560
🎯 $0.0649
🎯 $0.0721
🎯 $0.0792
🎯 $0.0894
🎯 $0.1024
⚠️ Always remember to use a tight stop-loss and maintain proper risk management.
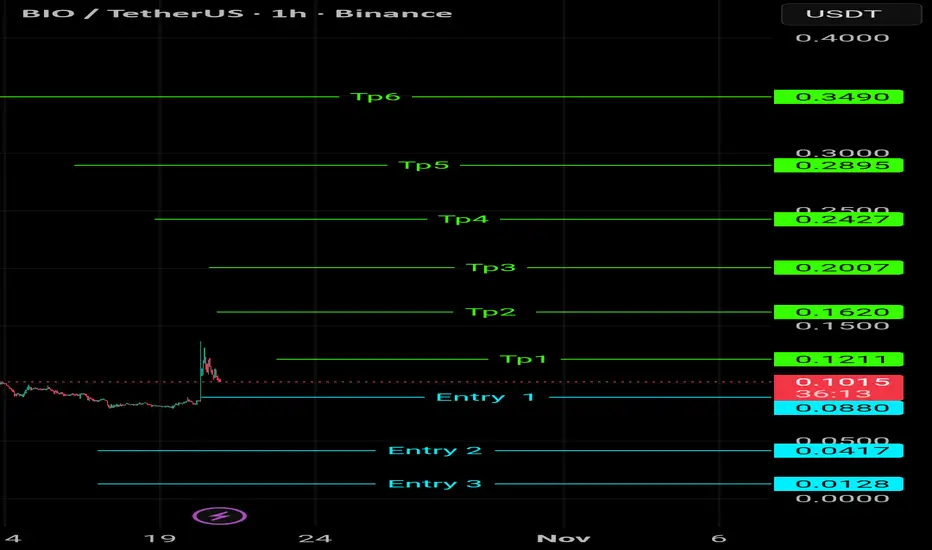
BIO/USDT Swing Setup — 3 Entries & 6 Targets Strategy (1H)
This setup is based on a swing structure with clear entry zones and target projections.
Price is currently near Entry 1, while Entry 2 and Entry 3 are positioned for deeper pullbacks.
Targets (TP1–TP6) are mapped according to Fibonacci extensions and structure projections.
Plan:
🟦 Entry 1: 0.0880
🟦 Entry 2: 0.0417
🟦 Entry 3: 0.0128
✅ TP1 → 0.1211
✅ TP2 → 0.1620
✅ TP3 → 0.2007
✅ TP4 → 0.2427
✅ TP5 → 0.2895
✅ TP6 → 0.3490
Bias: Bullish
Timeframe: 1H
Exchange: Binance
Pair: BIO/USDT
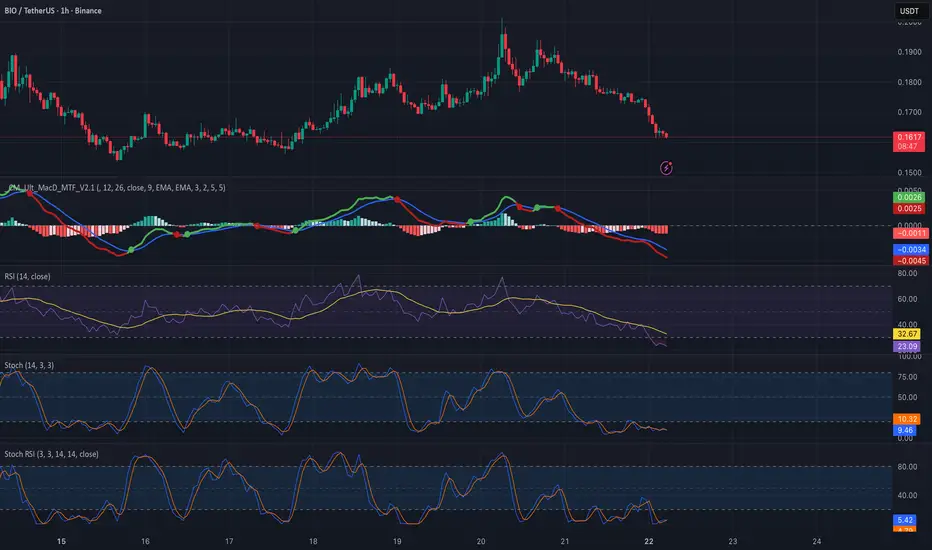
BIO/USDT - Long Entry | Smart Risk Management + Big Targets🚀 Trade Setup Details:
🕯 #BIO/USDT 🔼 Buy | Long 🔼
⌛️ TimeFrame: 1H
--------------------
🛡 Risk Management (Example):
🛡 Based on $10,000 Balance
🛡 Loss-Limit: 1% (Conservative)
🛡 The Signal Margin: $783.7
--------------------
☄️ En1: 0.1556 (Amount: $78.4)
☄️ En2: 0.1487 (Amount: $274.3)
☄️ En3: 0.144 (Amount: $352.67)
☄️ En4: 0.1394 (Amount: $78.4)
--------------------
☄️ If All Entries Are Activated, Then:
☄️ Average.En: 0.1465 ($783.7)
--------------------
☑️ TP1: 0.1738 (+18.63%) (RR:1.46)
☑️ TP2: 0.1888 (+28.87%) (RR:2.26)
☑️ TP3: 0.2097 (+43.14%) (RR:3.38)
☑️ TP4: 0.2397 (+63.62%) (RR:4.99)
☑️ TP5: 0.2778 (+89.62%) (RR:7.02)
☑️ TP6: Open 🔝
--------------------
❌ SL: 0.1278 (-12.76%) (-$100)
--------------------
💯 Maximum.Lev: 4X
⌛️ Trading Type: Swing Trading
‼️ Signal Risk: 🙂 Low-Risk! 🙂
--------------------
🔗 www.tradingview.com
❤️ Your Like & Comments are valuable to us ❤️
BIO (SPOT)BINANCE:BIOUSDT
Entry range (0.1590- 0.1830)
SL 4H close below 0.1536
T1 0.1890
T2 0.2100
T3 0.2400
T4 0.2770
T5 0.4000
02 Extra Target are optional 0.50 & .68
_______________________________________________________
Golden Advices.
********************
* collect the coin slowly in the entry range.
* Please calculate your losses before the entry.
* Do not enter any trade you find it not suitable for you.
* No FOMO - No Rush , it is a long journey.