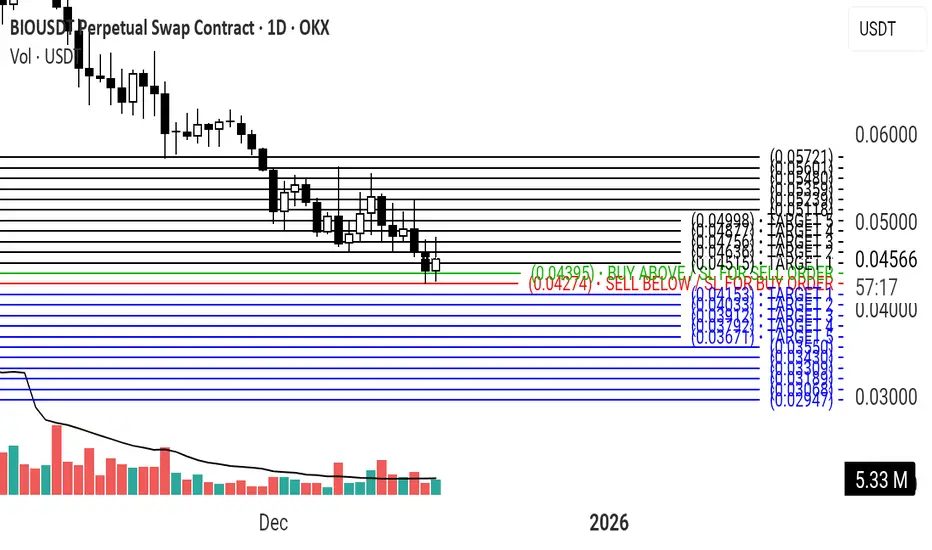
BIO is showing signs of stabilization after a long correctionThe chart is developing a potential higher-low structure while consolidating around a key high-volume area. The shorter moving averages are flattening and converging, suggesting bearish momentum is fading. A reclaim of the larger resistance zone overhead would be an important structural shift.
The Synergy Signal oscillator is also improving, with momentum pushing back above the mid-range and adding confluence to the developing base.
For now, the setup remains constructive while invalidation ho
BIO/USDT
No trades
No trades
In-depth trading ideas
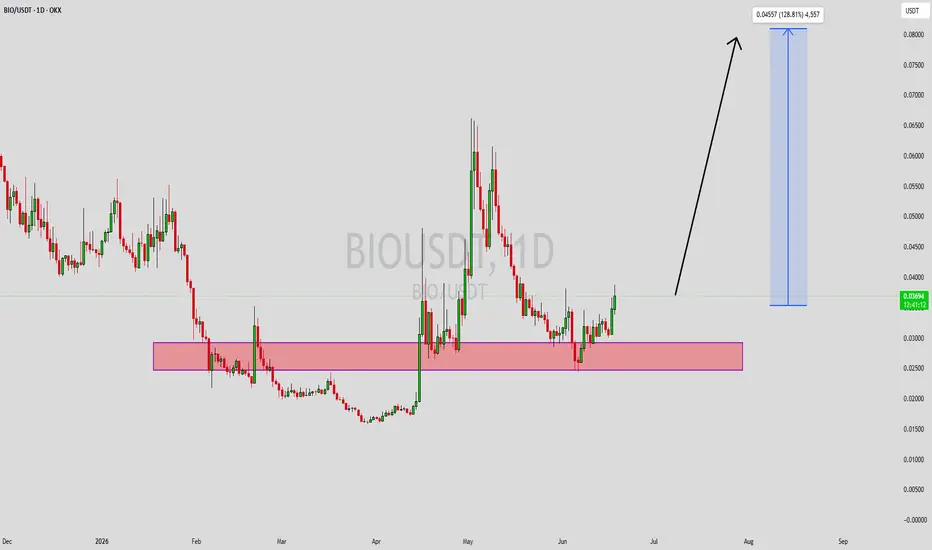
BIOUSDT Forming Bullish MomentumBIOUSDT is forming a clear bullish momentum pattern, a classic bullish reversal signal that often indicates an upcoming breakout. The price has been consolidating within a narrowing range, suggesting that selling pressure is weakening while buyers are beginning to regain control. With consistent volume confirming accumulation at lower levels, the setup hints at a potential bullish breakout soon. The projected move could lead to an impressive gain of around 140% to 150% once the price breaks abov
BIOUSDT 12H#BIO has broken above the descending resistance and the 12H SMA100. However, the 12H candle has not yet closed above the SMA100. If the 12H candle closes above this level, the potential upside targets are:
🎯 $0.03071
🎯 $0.03349
🎯 $0.03628
🎯 $0.04025
🎯 $0.04530
⚠️ Always use a tight stop-loss and apply proper risk management.
BIO Protocol: Retrace, bullish resumption & 1,000%+ higher highA major correction is present on this chart, BIOUSDT, producing a falling wedge pattern and new all-time low. The all-time low is followed by a bullish breakout coupled with really high volume. Notice this exact same price pattern on hundreds of charts.
This sequence of events confirms the end of the downtrend, correction or bear market phase. It reveals the start of a bullish cycle and the current set up a bullish resumption or continuation.
After strong bullish action, there is always a retr
BIOUSDT Forming Bullish MomentumBIOUSDT is forming a clear bullish momentum pattern, a classic bullish wave signal that often indicates an upcoming breakout. The price has been consolidating within a narrowing range, suggesting that selling pressure is weakening while buyers are beginning to regain control. With consistent volume confirming accumulation at lower levels, the setup hints at a potential bullish breakout soon. The projected move could lead to an impressive gain of around 90% to 100% once the price breaks above the
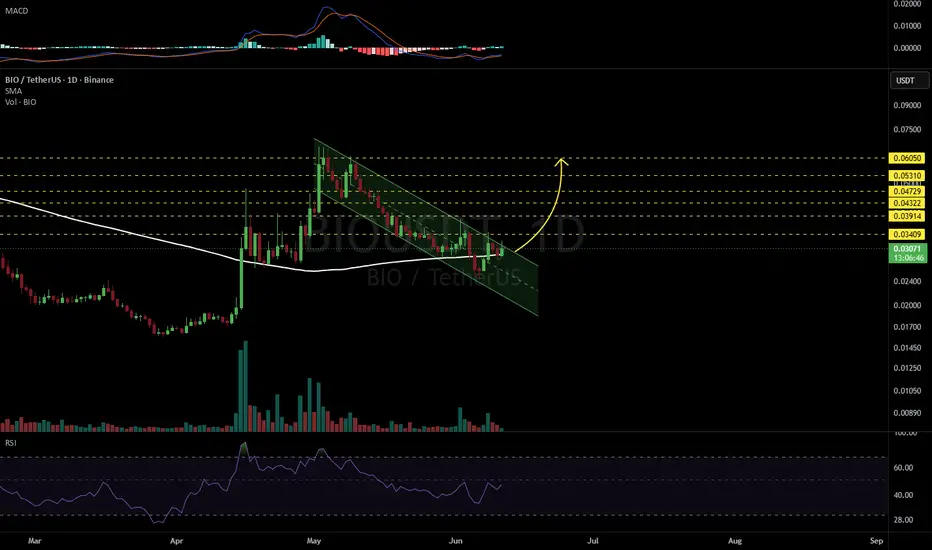
BIOUSDT 1D#BIO is currently trading within a bullish flag pattern on the daily chart and has bounced from the daily SMA100.
In case of a breakout above the flag resistance, the following upside targets could come into play:
🎯 $0.03409
🎯 $0.03914
🎯 $0.04322
🎯 $0.04729
🎯 $0.05310
🎯 $0.06050
⚠️ Always remember to use a tight stop-loss and maintain proper risk management.
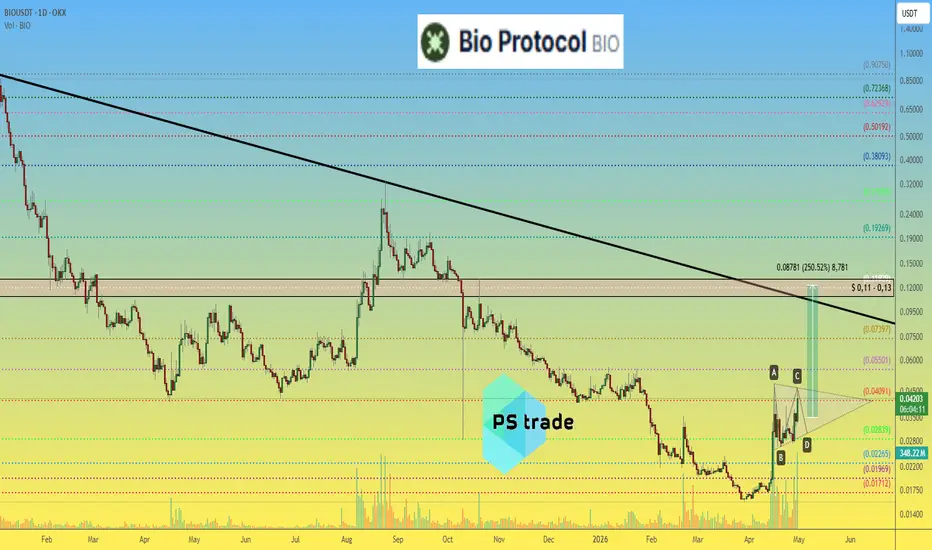
BIO protocol price analysisLooks like MM is not done with #BIO yet 👀
Feels like the market maker in #BioProtocol is pushing
OKX:BIOUSDT toward the $0.11–0.13 liquidity zone.
If that assumption is correct — there may still be a chance to catch part of a +200–250% move in the coming days.
For context:
the first impulse from the bottom already delivered +170%+.
So the story might not be over yet.
But the key question remains:
is there real fundamental backing —
or just a liquidity-driven pump?
What do you think — co
BIOUSDT Forming Bullish WaveBIOUSDT is forming a clear bullish wave pattern, a classic bullish reversal signal that often indicates an upcoming breakout. The price has been consolidating within a narrowing range, suggesting that selling pressure is weakening while buyers are beginning to regain control. With consistent volume confirming accumulation at lower levels, the setup hints at a potential bullish breakout soon. The projected move could lead to an impressive gain of around 140% to 150% once the price breaks above th
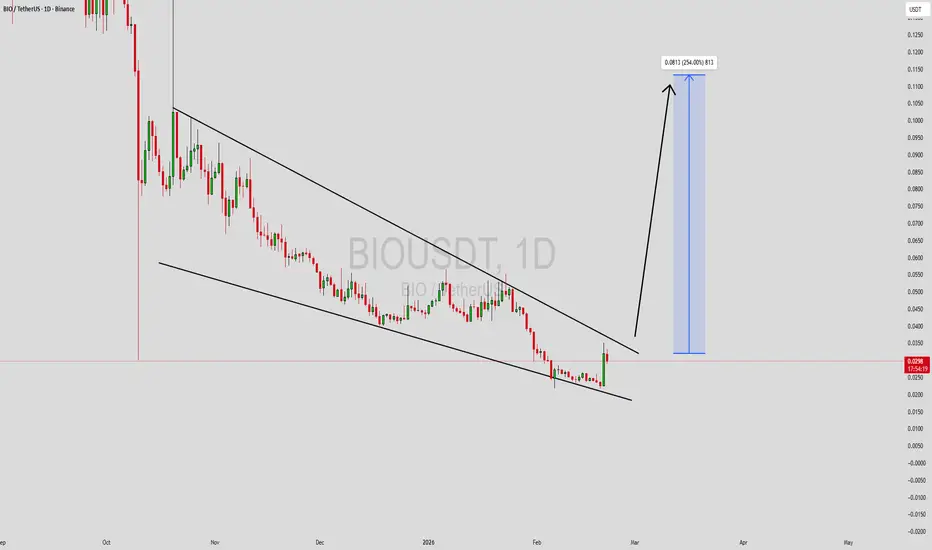
BIOUSDT Forming Falling WedgeBIOUSDT is forming a clear falling wedge pattern, a classic bullish reversal signal that often indicates an upcoming breakout. The price has been consolidating within a narrowing range, suggesting that selling pressure is weakening while buyers are beginning to regain control. With consistent volume confirming accumulation at lower levels, the setup hints at a potential bullish breakout soon. The projected move could lead to an impressive gain of around 190% to 200% once the price breaks above t
BIOUSDT — Whale Buy Into Climactic Volume With Leverage Maxed
BIO is flashing one of the most extreme volume and leverage profiles on the board right now. A whale buy signal has triggered alongside climactic volume readings across both spot and futures — but leverage is pinned at the 100th percentile ceiling. This is the kind of setup where everything looks powerful until it isn't.
Price is at 0.03210 with futures lagging at 0.03185. The pair has retraced 42.2% from its high and is showing a 46.8% bounce at 1.1x — balanced, not yet a confirmed breakout.
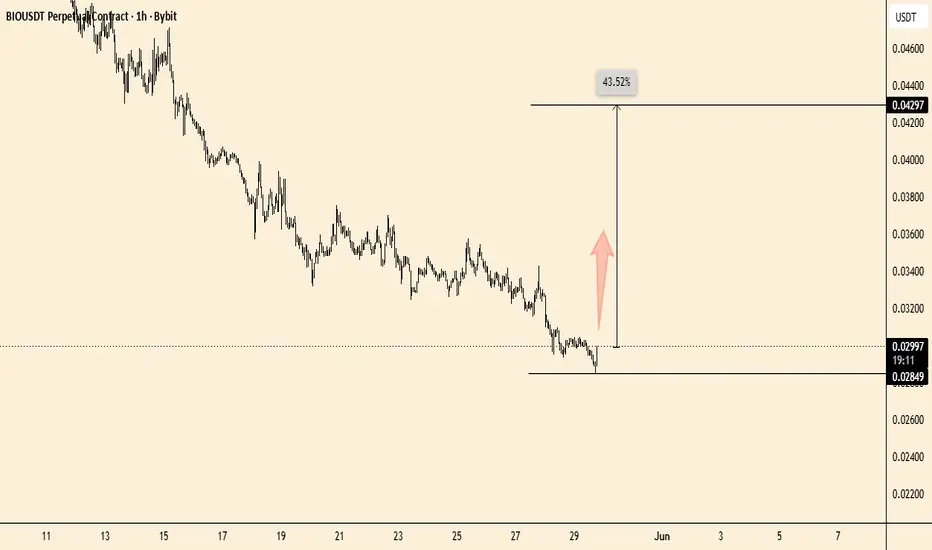
BIO/USDT On Accumulation, Get Ready For Exploding Soon?#BIO
BIO has completed a long downtrend and is now moving sideways inside an accumulation base.
Selling pressure is slowing, and price is stabilizing after the breakdown phase
As long as this base holds, the chart favors a slow recovery.
A break above the descending trendline would be the first real sign of trend shift 🚀
If the price loses the bottom support, downside pressure could return
BIO/USDT - W pattern recovery August 2025 marked a historical milestone for BIO, delivering a powerful ~500% impulsive rally. This move confirmed strong market interest and shifted BIO into a higher valuation regime. After such an expansion, a corrective and stabilization phase is both healthy and necessary
BIOUSDT 1D#BIO is moving near the descending resistance on the daily chart and has printed a bullish RSI divergence. Consider buying a small bag here and another near the support zone. In case of a breakout above the resistance, the potential targets are:
🎯 $0.0560
🎯 $0.0649
🎯 $0.0721
🎯 $0.0792
🎯 $0.0894
🎯 $0.1024
⚠️ Always remember to use a tight stop-loss and maintain proper risk management.
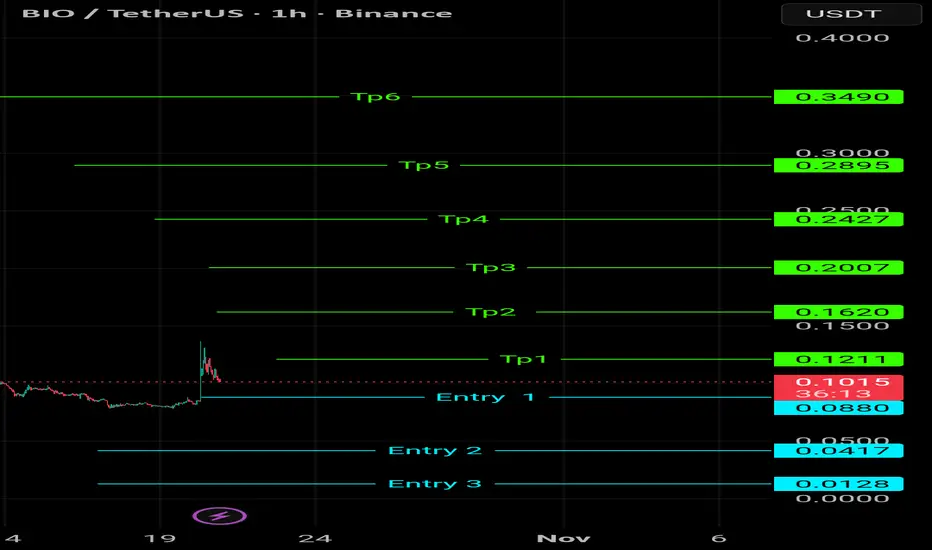
BIO/USDT Swing Setup — 3 Entries & 6 Targets Strategy (1H)
This setup is based on a swing structure with clear entry zones and target projections.
Price is currently near Entry 1, while Entry 2 and Entry 3 are positioned for deeper pullbacks.
Targets (TP1–TP6) are mapped according to Fibonacci extensions and structure projections.
Plan:
🟦 Entry 1: 0.0880
🟦 Entry 2: 0.0417
🟦 Entry 3: 0.0128
✅ TP1 → 0.1211
✅ TP2 → 0.1620
✅ TP3 → 0.2007
✅ TP4 → 0.2427
✅ TP5 → 0.2895
✅ TP6 → 0.3490
Bias: Bullish
Timeframe: 1H
Exchange: Binance
Pair: BIO/USDT
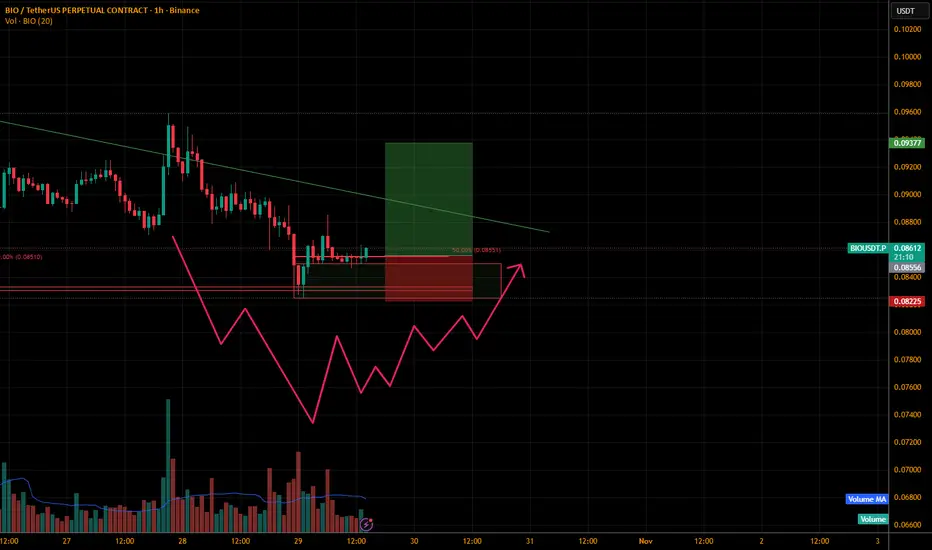
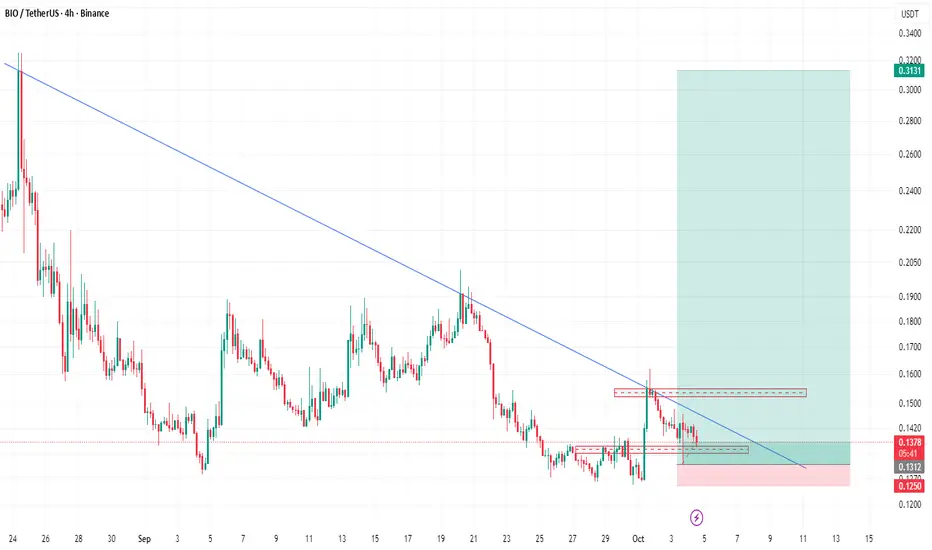
BIO/USDT - Long Entry | Smart Risk Management + Big Targets🚀 Trade Setup Details:
🕯 #BIO/USDT 🔼 Buy | Long 🔼
⌛️ TimeFrame: 1H
--------------------
🛡 Risk Management (Example):
🛡 Based on $10,000 Balance
🛡 Loss-Limit: 1% (Conservative)
🛡 The Signal Margin: $783.7
--------------------
☄️ En1: 0.1556 (Amount: $78.4)
☄️ En2: 0.1487 (Amount: $274.3)
☄️ En3: 0.144 (Amount: $352.67)
☄️ En4: 0.1394 (Amount: $78.4)
--------------------
☄️ If All Entries Are Activated, Then:
☄️ Average.En: 0.1465 ($783.7)
--------------------
☑️ TP1: 0.1738 (+18.63%) (RR:1.46)