In-depth trading ideas
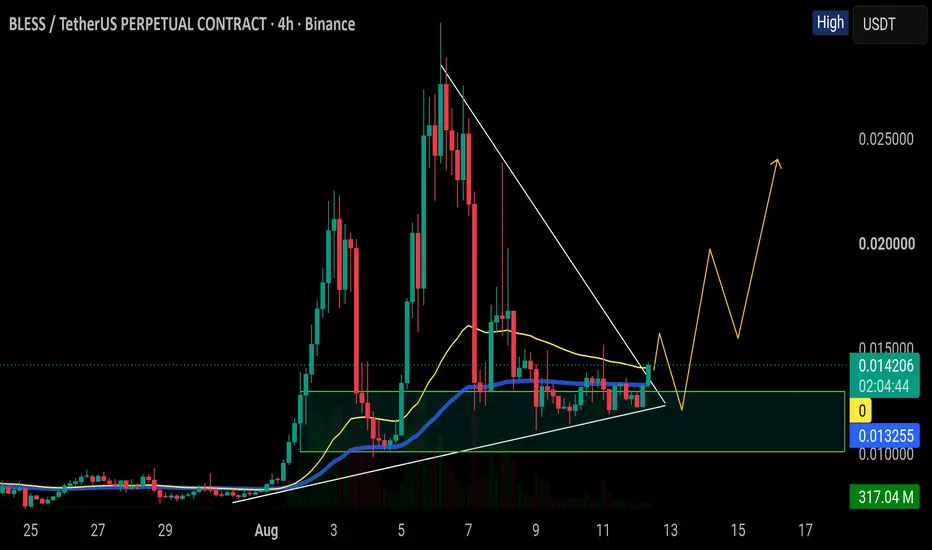
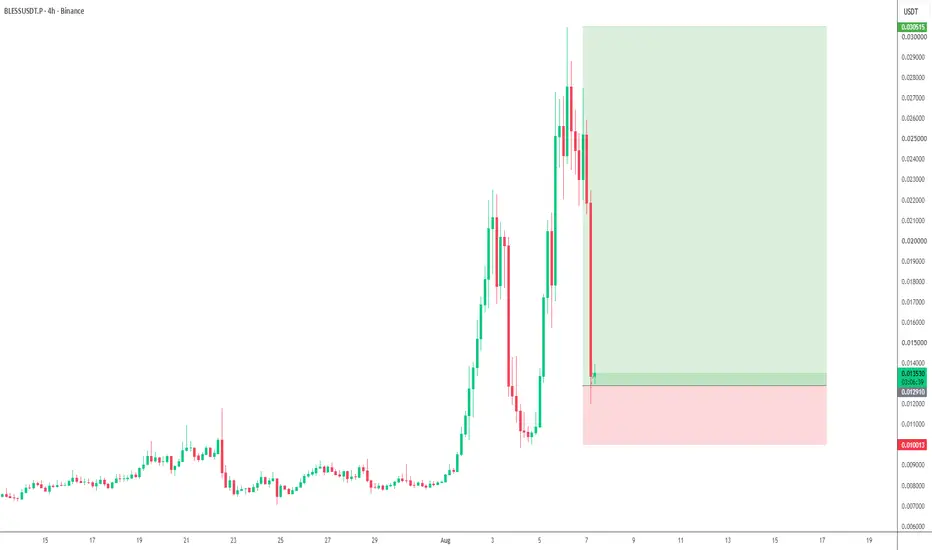
#BLESSUSDT Bullish Reversal in MAGICUSDT Accumulation Zone#BLESS
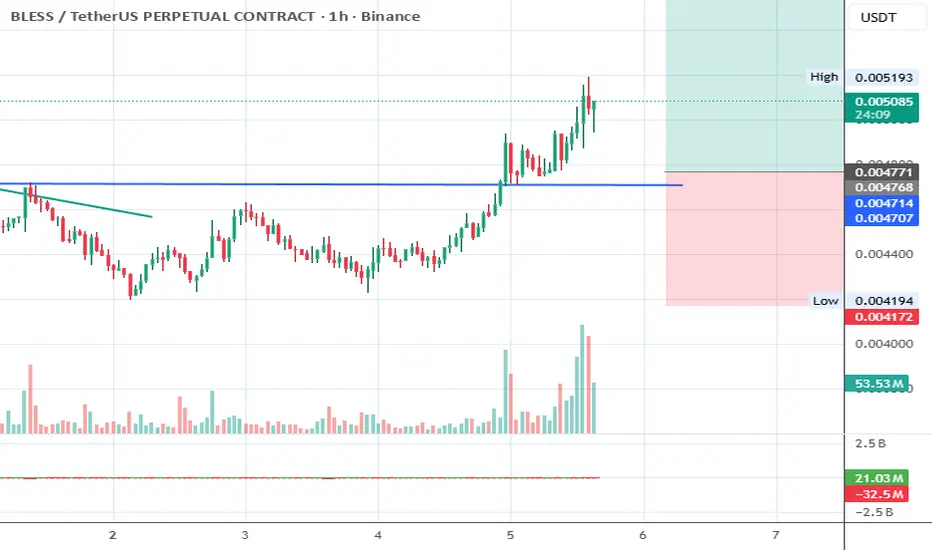
The price is moving within a descending channel on the 1-hour timeframe and has reached the lower boundary. It is now poised for a bounce and is expected to retest this boundary.
The Relative Strength Index (RSI) indicates a downward trend, which is likely to continue given the overbought conditions.
There is a key support zone in green at 0.002115. The price has bounced off this zone several times, making it a strong support level.
The price is trending towards the 100-period moving average, which we are approaching. This trend supports an upward move.
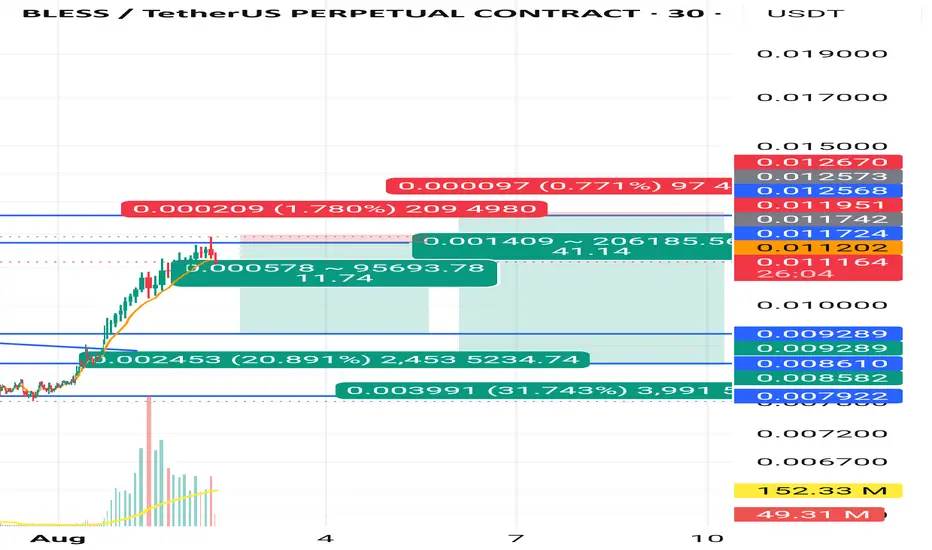
Entry Price: 0.011290
First Target: 0.01444
Second Target: 0.017490
Third Target: 0.022217
You can stop at the first and second targets and close the price, or continue towards the third target.
Stop Loss: At the resistance zone in green.
Remember this simple rule: Money Management.
Any questions? Please leave a comment.
Thank you.
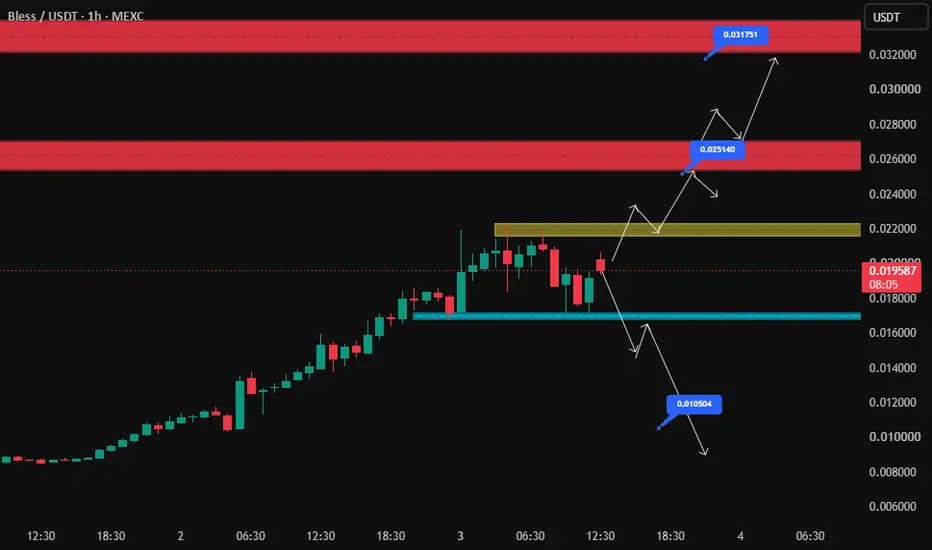
#BLESSUSDT 1h#BLESSUSDT 1h
The trending coin **#BLESS** could move toward our first and second red target zones if it manages to **engulf the yellow zone**.
On the other hand, if the **blue zone** is lost, the market could shift into a bearish trend and head toward our downside target.
Keep a close eye on it.
If the yellow zone is engulfed, be ready. After a short pullback, price could resume its bullish move toward the red target zones.
If price loses the blue zone instead, you can start looking for **short opportunities**.
SET:BLESS
BLESSUSDT Forming Bullish MomentumBLESSUSDT is forming a clear bullish momentum pattern, a classic bullish wave signal that often indicates an upcoming breakout. The price has been consolidating within a narrowing range, suggesting that selling pressure is weakening while buyers are beginning to regain control. With consistent volume confirming accumulation at lower levels, the setup hints at a potential bullish breakout soon. The projected move could lead to an impressive gain of around 90% to 100% once the price breaks above the wedge resistance.
This bullish momentum pattern is typically seen at the end of downtrends or corrective phases, and it represents a potential shift in market sentiment from bearish to bullish. Traders closely watching BLESSUSDT are noting the strengthening momentum as it nears a breakout zone. The healthy trading volume adds confidence to this pattern, showing that market participants are positioning early in anticipation of a reversal.
Investors' growing interest in BLESSUSDT reflects rising confidence in the project's long-term fundamentals and current technical strength. If the breakout confirms with sustained buying volume, this could mark the start of a fresh bullish leg. Traders might find this a valuable setup for medium-term gains, especially as the momentum pattern completes and buying pressure continues to accelerate.
✅ Show your support by hitting the like button and
✅ Leaving a comment below! (What is You opinion about this Coin)
Your feedback and engagement keep me inspired to share more insightful market analysis with you!
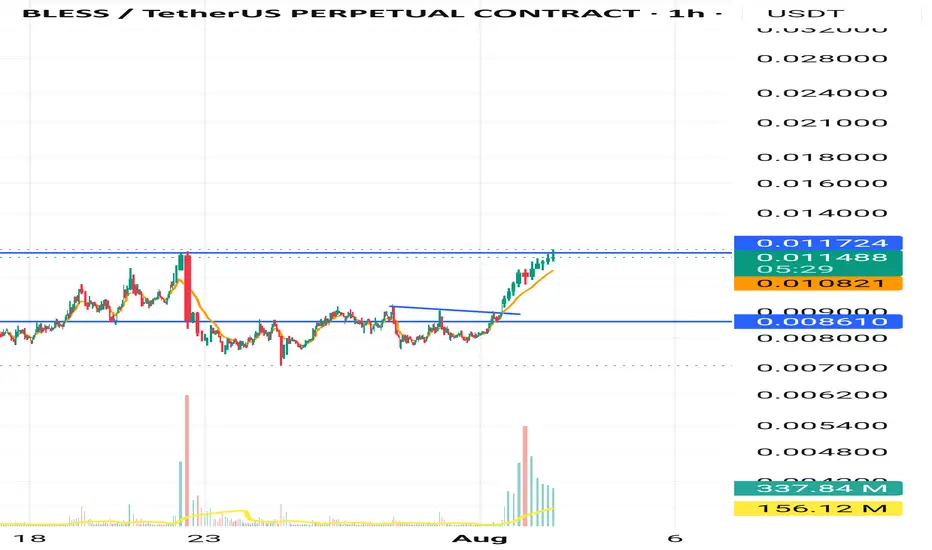
BLESS: $0.01 Breakout TestBLESS just pushed into the $0.01 area, so the setup changed. 📈
This is no longer about catching the first move. It is about whether bulls can hold the breakout.
1. THE REALITY
Price is above EMA20, EMA50, and EMA200, with ADX at 51.6 showing a strong trend.
Momentum is still bullish, but after the fast move from $0.0078 to $0.0125, I do not want to chase every green candle.
2. THE SETUP
The key level now is $0.01006.
If BLESS holds above it, bulls can keep control and aim back toward $0.01257.
If price loses $0.00943, the breakout starts looking weaker and a deeper pullback toward $0.00803-$0.00726 becomes possible.
3. MY VERDICT
Bullish while $0.00943 holds.
Strong continuation only if $0.01006 turns into support.
Are you buying the $0.01 breakout, or waiting for a retest?
Disclaimer: Personal analysis only. Not financial advice. DYOR.
BLESSUSDT Forming Bullish MomentumBLESSUSDT is forming a clear bullish momentum pattern, a classic bullish wave signal that often indicates an upcoming breakout. The price has been consolidating within a narrowing range, suggesting that selling pressure is weakening while buyers are beginning to regain control. With consistent volume confirming accumulation at lower levels, the setup hints at a potential bullish breakout soon. The projected move could lead to an impressive gain of around 290% to 300% once the price breaks above the resistance zone.
This bullish momentum pattern is typically seen at the end of downtrends or corrective phases, and it represents a potential shift in market sentiment from bearish to bullish. Traders closely watching BLESSUSDT are noting the strengthening momentum as it nears a breakout zone. The healthy trading volume adds confidence to this pattern, showing that market participants are positioning early in anticipation of a reversal.
Investors’ growing interest in BLESSUSDT reflects rising confidence in the project's long-term fundamentals and current technical strength. If the breakout confirms with sustained volume, this could mark the start of a powerful bullish leg. The current market structure suggests that buyers are steadily gaining control while bearish pressure continues to weaken.
Traders might find this a valuable setup for medium-term gains, especially as the bullish momentum pattern completes and buying momentum accelerates. A successful breakout could attract significant market attention and potentially drive the price toward substantially higher targets over time.
✅ Show your support by hitting the like button!
✅ Leaving a comment below! (What is your opinion about this Coin?)
Your feedback and engagement keep me inspired to share more insightful market analysis with you!
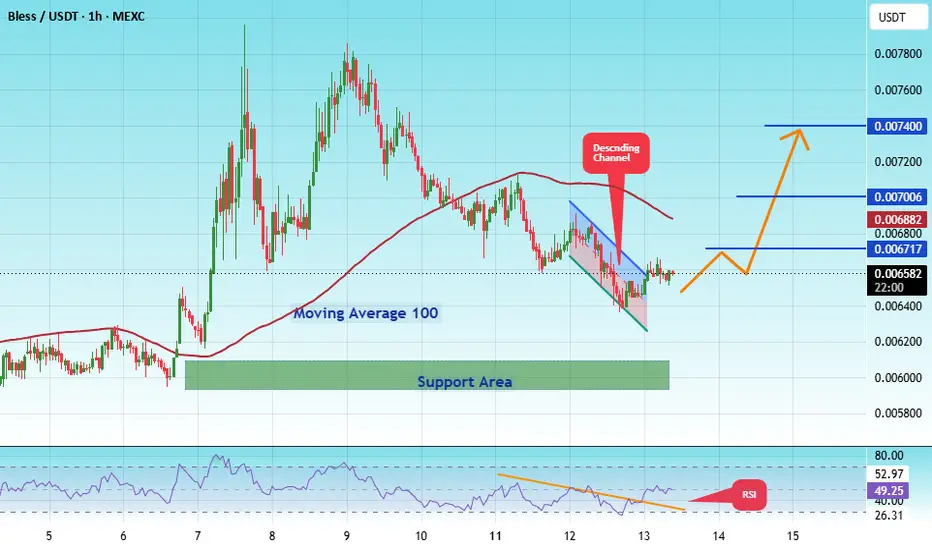
#BLESSUSDT Bullish Reversal in MAGICUSDT Accumulation Zone#BLESS
The price is moving within a descending channel on the 1-hour timeframe and has reached the lower boundary. It is now poised for a bounce and is expected to retest this boundary.
The Relative Strength Index (RSI) indicates a downward trend, which is likely to continue given the overbought conditions.
There is a key support zone (in green) at 0.005941. The price has bounced off this zone several times, making it a strong support level.
The price is trending towards the 100-period moving average, which we are approaching. This trend supports an upward move.
Entry Price: 0.006570
First Target: 0.006717
Second Target: 0.007006
Third Target: 0.007400
You can stop at the first and second targets and close the price, or continue towards the third target. Stop Loss: At the resistance zone (in green).
Remember this simple rule: Money Management.
Any questions? Please leave a comment.
Thank you.
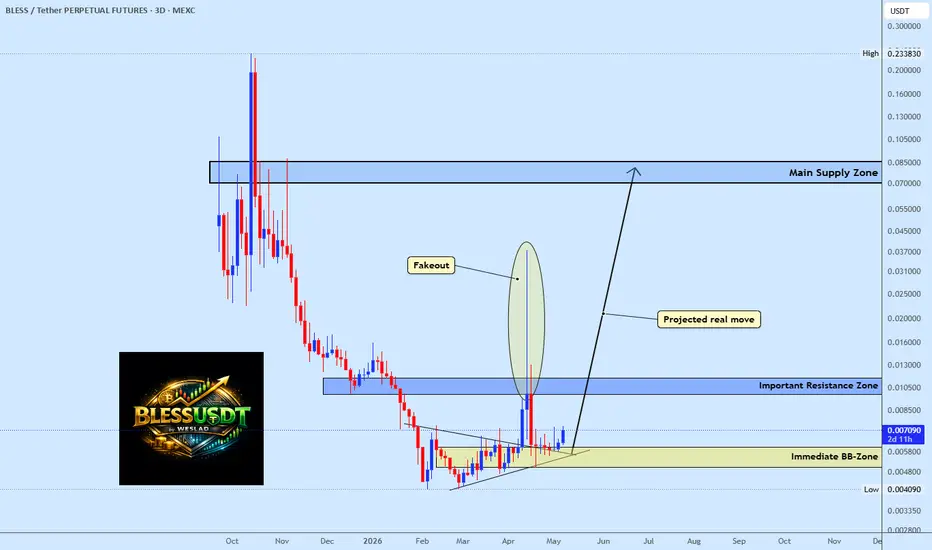
Bless Fakeout Completed, Expansion Next?BLESS continues to trade inside a major accumulation structure after rejecting from the fakeout move above the immediate resistance zone. Price is now rotating back into the BB-zone where buyers are expected to defend the structure for continuation. As long as the current low holds, this setup still favors a gradual expansion toward the main supply zone around $0.07–$0.085. Patience remains key here, as the current consolidation could be preparing the foundation for the next impulsive move.
BLESSUSDT | Long-Term Accumulation → Liquidity Expansion Setup BLESSUSDT | Long-Term Accumulation → Liquidity Expansion Setup 🚀
BLESSUSDT has undergone a prolonged phase of downside followed by an extended period of low-volatility consolidation near the base. This type of structure typically represents deep accumulation after a full market reset.
━━━━━━━━━━━━━━━
📊 Market Structure Breakdown
• Initial phase: Sharp distribution and sustained downtrend
• Followed by: Long-term compression near lows
• Current behavior: Tight range with occasional liquidity spikes
This indicates:
→ Seller exhaustion over time
→ Supply absorption at lower levels
→ Potential positioning for expansion
━━━━━━━━━━━━━━━
💡 Key Levels to Watch
🔹 Accumulation Base: ~0.0069 – 0.0113
→ Strong demand zone where price has stabilized
🔹 Early Breakout Level: ~0.0113
→ First confirmation of strength
🔹 Mid Liquidity Zone: ~0.0495
→ Major reaction level / previous supply
🔹 Expansion Target: ~0.0916
→ High liquidity region
🔹 Extreme Target: ~0.2168
→ Full expansion scenario / major resistance
━━━━━━━━━━━━━━━
🚀 Projected Scenario
The projected path outlines a classic accumulation-to-expansion cycle:
1. Breakout from accumulation base
2. Acceleration toward mid-range liquidity
3. Continuation into higher resistance zones
4. Potential parabolic expansion if momentum sustains
This structure reflects a high R:R expansion setup .
━━━━━━━━━━━━━━━
⚠️ Invalidation
• Failure to hold above accumulation base
• Continued low-volume sideways movement
• Breakdown below key support zone
This would suggest extended consolidation or further downside.
━━━━━━━━━━━━━━━
🧠 Key Insight
Markets that spend extended time in tight ranges often produce high-momentum expansion moves once liquidity is triggered.
The longer the base → the stronger the potential move.
━━━━━━━━━━━━━━━
📌 Conclusion
BLESSUSDT is positioned within a long-term accumulation structure .
A confirmed breakout could initiate a multi-stage expansion toward higher liquidity zones .
Patience is key — this type of setup often leads to explosive moves.
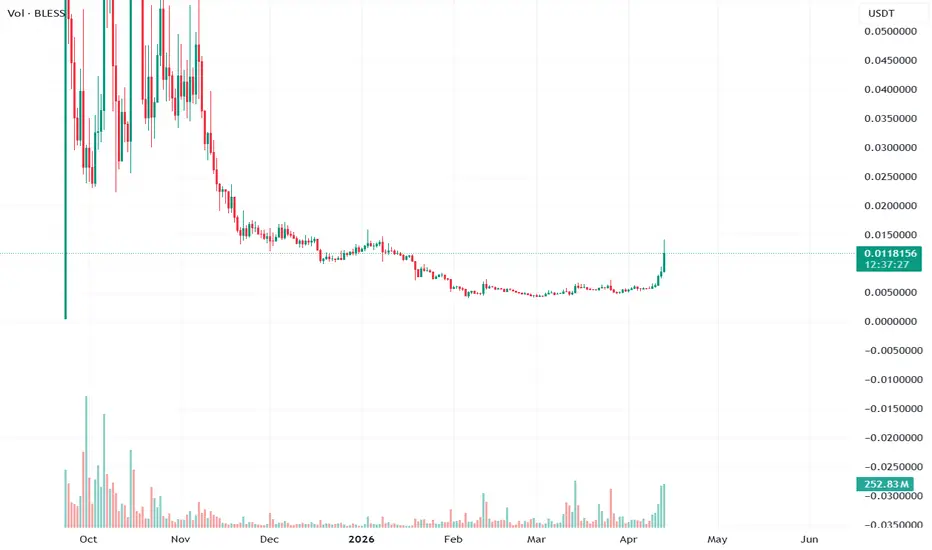
BLESSUSDT Extreme Bull Signal — Squeeze Fired at FloorBLESSUSDT is trading at 0.01160 with spot printing 506.57M against 5.17B in futures volume — roughly a 10x futures-to-spot ratio, not the ghost-market danger zone but futures are clearly in control of this move. Dollar flow comes in at 5.84M spot vs 59.58M futures, confirming retail participation is still thin on the spot side.
46 green signals to 11 red out of 112 puts bull bias at 79.1% with bear at 7.9. EMA alignment is full green at 9 to zero. Candle structure reads 10 green 4 red, Ichimoku TK at 11 green 2 red, C>T at 11 green 2 red. DD/SS is sitting 1 supply to 3 demand — demand heavy. The squeeze has fired, momentum is pointing bull, and bandwidth is at 96.73% flagging blowoff conditions with the 5-bar Bull Cascade already extending 102.6%.
Spot Z elevated at 1.01, futures Z active at 0.75, combined at 0.78. Spot:Fut relationship reads Ignition with a 5-bar acceleration from a -0.57 trough up to 1.58. Spot momentum is expanding at 308.1% with a loosening signal, meaning the velocity is real but the easy part of the move may already be in.
Leverage has dropped to 10.26x and is declining — constructive. Percentile is at 22.9%, firmly in floor territory, which is the structural long signal. All-time max leverage was 31.77x just 51 bars ago, meaning the flush is recent and clean. Price percentage sits at 3.1% bottom, historically cheap within the full range of 0.004052 to 0.0386.
OBV Z at 0.28 with a 5-bar swing from -0.91 up to 1.19 reads Power Up — buyers are stepping in and holding the move. No bearish OBV divergence. Liquidations are clear, no whale prints. Bull:Bear Z at 1.37 to -0.62 confirms volume-weighted order flow is bullish lean.
The honest read: BLESSUSDT has a textbook structural setup — leverage flushed to floor, OBV accelerating, squeeze fired, cascade running at 102.6%. The problem is the blowoff bandwidth at 96.73% and the premium yield screaming bear at 656% APY meaning momentum chasers are exposed. The supply zone overhead from the BOS is the next real test. This is not a chase — the squeeze already fired. The trade is either wait for the -18.2% retrace back into demand or sit out until the next squeeze builds fresh.
Is That Crypto Pump Real? Data Says No. Here's Why.
Stop Losing Money to Fake Volume. Find Real Moves Now.
Trade the REAL Crypto Volume. Stop Getting Faked Out.
BLESSUSDT Forming Bullish MomentumBLESSUSDT is forming a clear bullish momentum pattern, a classic bullish reversal signal that often indicates an upcoming breakout. The price has been consolidating within a narrowing range, suggesting that selling pressure is weakening while buyers are beginning to regain control. With consistent volume confirming accumulation at lower levels, the setup hints at a potential bullish breakout soon. The projected move could lead to an impressive gain of around 90% to 100% once the price breaks above the wedge resistance.
This bullish momentum pattern is typically seen at the end of downtrends or corrective phases, and it represents a potential shift in market sentiment from bearish to bullish. Traders closely watching BLESSUSDT are noting the strengthening momentum as it nears a breakout zone. The good trading volume adds confidence to this pattern, showing that market participants are positioning early in anticipation of a reversal.
Investors’ growing interest in BLESSUSDT reflects rising confidence in the project’s long-term fundamentals and current technical strength. If the breakout confirms with sustained volume, this could mark the start of a fresh bullish leg. Traders might find this a valuable setup for medium-term gains, especially as the pattern completes and buying momentum accelerates.
✅ Show your support by hitting the like button and
✅ Leaving a comment below! (What is your opinion about this Coin?)
Your feedback and engagement keep me inspired to share more insightful market analysis with you!
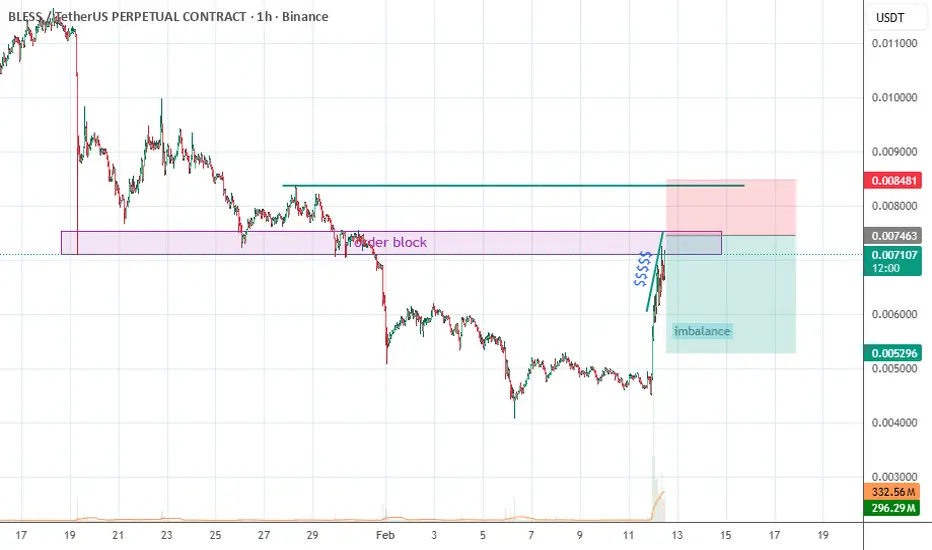
BLESSUSDT plan 12-02-26BlessUSD plan 12-02-26
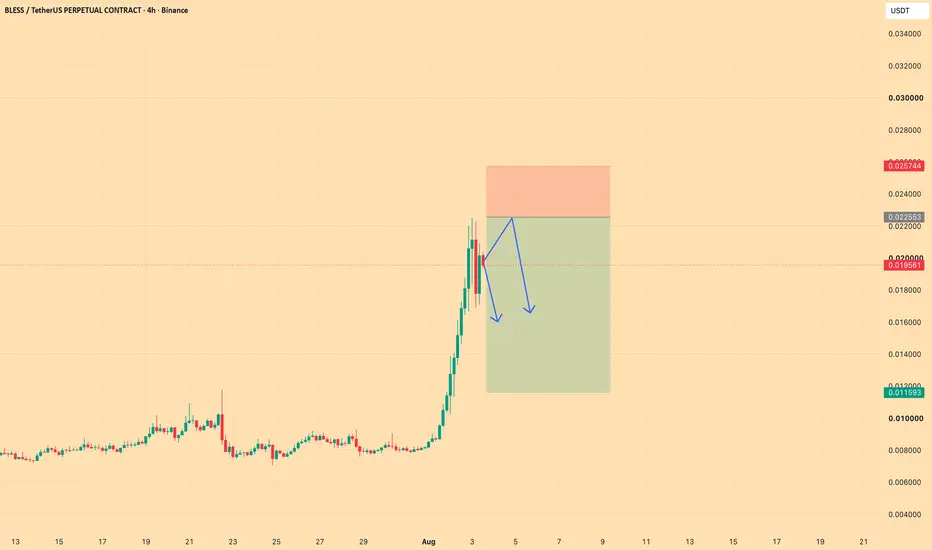
The price has been pumped up into the supply area, but there has been no rejection. It continues to rise, forming a compression. In this situation, when the price enters the fresh supply area, it doesn't necessarily mean it will fall. It would be better to wait for a bearish engulfing to form in the supply area, with confirmation of a change in character on a lower timeframe.