EURO STOXX 50 Wave Analysis – 24 July 2026- EURO STOXX 50 reversed from support zone
- Likely to rise to resistance level 6330.00
EURO STOXX 50 INDEX recently reversed up from the support zone between the key support level 6200.00 (former strong resistance from February), lower daily Bollinger Band and the 50% Fibonacci correction of the upward impulse from June.
The upward reversal from this support zone started the active minor impulse wave v of the intermediate impulse wave 3 from May.
Given the clear daily uptrend, EURO STOXX 50 can be expected to rise to the next resistance level 6330.00 (top of the previous impulse wave i).
In-depth trading ideas
EURO STOXX 50 ($STOXX50) Daily: Testing Key EURO STOXX 50 ( ICMARKETS:STOXX50 ) Daily: Testing Key LTA Channel Support at 6,178 — Bullish Rebound vs. Deep Correction
### 🇪🇺 EURO STOXX 50 Index ( ICMARKETS:STOXX50 ) Daily Technical Framework (Ref: STOXX50_2026-07-21_09-27-32.png)
We are releasing a tactical multi-week technical study on the EURO STOXX 50 Index ( ICMARKETS:STOXX50 ) on the Daily (1D) interval. Following a corrective dip from its major high at 6,636.73, the European benchmark index is testing a critical structural boundary that defines its mid-term trend health.
The index is showing strong intraday buy-side absorption today, trading up at **6,254.80 (+0.98%)**.
---
### 🔍 Structural Architecture & Fibonacci Confluences:
Our quantitative framework highlights a pivotal decision zone defined by several overlapping layers of support and resistance:
1. **The Ascending Channel Support Floor (LTA):** Price action is directly testing the lower boundary of its ascending channel (red diagonal LTA), which has guided the primary upward structure since the April/May swing lows.
2. **Static Role-Reversal Level (6,178.17):** The 0.0 Fibonacci baseline sits squarely at **6,178.17**, matching the horizontal breakout level from March. Buyers have stepped in aggressively to defend this former resistance as new support.
3. **Overhead Fibonacci Retraction Arrays:** Immediate resistance layers above current price sit at **6,296.39 (0.236 Fibo)** and **6,353.34 (0.382 Fibo)**.
---
### 🔄 Dual Structural Scenarios:
We are tracking two distinct pathways depending on how price action resolves relative to the 6,178 support floor:
#### 🐂 Bullish Rebound Scenario (Blue Vector)
* **The Play:** As long as price sustains daily closes above the **6,178.17** baseline, the structural integrity of the ascending channel remains intact.
* **The Upside Targets:** Clearing **6,296.39** opens the path for a recovery leg toward **6,353.34 (0.382 Fibo)**, with extended target projections aiming for the upper trendline near **6,500.00** and eventually the swing high at **6,636.73**.
#### 🐻 Bearish Breakdown Scenario (Red Vector)
* **The Play:** A confirmed daily candle close below **6,178.17** will break the ascending channel to the downside.
* **The Downside Targets:** This failure will trigger a broader corrective cycle, driving price down toward the dynamic dynamic band of the **72-period SMA cluster (6,032.07 – 6,103.99)** and ultimately the institutional **200-period EMA (purple line at 5,891.54)**.
### 📊 Tactical Parameters Summary:
* **Current Bias:** Neutral-Bullish (Holding Support)
* **Primary Support Floor:** 6,178.17 (LTA Confluence)
* **Immediate Resistance Target:** 6,353.34 (0.382 Fibo)
* **Macro Invalidation (Bearish Trigger):** Daily Close below 6,178.00
---
📊 **ChartPro Data**
*European Equity Architecture, Structural Channel Dynamics & Systematic Risk Frameworks.*
⚠️ **Disclaimer:** For educational and informational purposes only. This active market study represents a personal trading framework and does not constitute financial or investment advice.
Euro Stoxx 50 Wave Analysis – 14 July 2026- Euro Stoxx 50 reversed from key resistance level 119.00
- Likely to fall to support level 100.00.
Euro Stoxx 50 index recently reversed from the support zone between the strong support level 6200.00 (former multi-month resistance high from February), lower daily Bollinger Band and the 50% Fibonacci correction of the upward impulse from June.
This support zone was further strengthened by the upward sloping support trendline from March.
Given the clear daily uptrend, Euro Stoxx 50 can be expected to rise further to the next resistance level 6300.00.
Euro Stoxx 50 (STOXX50) LONG — 6H ALMA Setup (WR 76%)█ SETUP
ICMARKETS:STOXX50 · 6H · long only.
(Context: Euro Stoxx 50 — pan-European large-cap index, EUR beta.)
ALMA Averaging Strategy: ALMA 3 / σ2, SD band 2, min diff 4/3, 25% per bar, up to 4 adds, hard stop −10% from average entry.
Strategy Tester (STOXX50 6H):
Win rate 76% · profit factor 2.5 · max drawdown 18%
Avg win +3.8% · avg loss −2.8% · typical hold ~54×6H bars on winners — patient index mean-reversion grid
═
█ WHY NOW
Wednesday evening 6H bar — ALMA long fired 08 Jul 18:00 UTC on the ICMARKETS STOXX50 print ~ 6,234 .
First lot on a fresh cycle — snapshot ~ 6,214 (~−0.5% under fill, day-one index noise). Daily VWAP Support touch 08 Jul tags the same shelf ~ 6,216 .
Hard stop zone −10% from fill ~ 5,611 . Exits follow Pine ALMA flip + min diff or the hard stop.
█ MACRO
Asset: STOXX50 = Eurozone large-cap basket — ECB path, EUR, energy import costs, and global risk appetite move the index more than any single headline name.
Tape (8 Jul): Iran ceasefire breakdown lifted oil ~+5% and pushed euro-area yields higher on inflation fears; Northwest European gasoline margins compressed as crude jumped — European equities trade geo/oil beta, not a clean growth read.
Parallel book: a GER40 4H ALMA long opened earlier the same day on Germany cash — related Europe risk, **different** index and chart; this idea tracks STOXX50 6H only.
═
█ OUTLOOK
Positive factors
- 76% WR · PF 2.5 · avg win +3.8% vs avg loss −2.8% — positive skew on a deep 283-day 6H sample
- Fresh 6H entry inside the 24h publish window — first lot on the evening close, not a scale-in add
- ALMA — 4H: SHORT · S:7 vs SAvg 3.6 — OVERHEAT-S on the execution ladder; mean-reversion long frame at the fill bar
- EMA — 1H: Below · S:23 vs ~ 5.5-bar norm — fast index stretched ~1.0% under the hourly average; bounce setup on the 6H template
- SMC — 1W bull FVG raid ~6,413: bounce B 67% Br33% (n=63) — elevated weekly bounce skew on the euro50 inefficiency; supports grind if price works back toward the raid zone
- SMC — 1D FVG enter bull ~6,324: bounce B 56% Br44% (n=395) — mild daily bounce bias on the prior session cluster
- SMC — 4H FVG enter bull ~6,185: bounce B 56% Br44% (n=1520) — demand shelf under fill with bounce skew
- VWAP — chart touch: Support 08 Jul ~ 6,216 on the STOXX50 board — tags the same zone as snapshot ~6,214
Negative factors
- ALMA — slow board: 1W LONG · L:8 vs LAvg 4.4 — OVERHEAT-L on the weekly band; higher-TF long stretch conflicts with a fresh 6H long at a marginal pullback
- ALMA — fast ladder: 1H SHORT · 4H SHORT · 1D SHORT — execution and medium boards still short into the new 6H long
- EMA MTF — mixed stack: 1H–4H Below but 1D–1W Above on ~6,214 — fast indices under the rail while slow boards still hold above; not a clean discount reclaim
- First Bar Close: 1H below 1D EMA on the 08 Jul snapshot — fast ladder lost the daily line again
- SMC — 4H at fill ~6,236: FVG New Bear plus OB Breaker Bear bounce B45% · break Br 55% (n=130) — marginal break bias and new bear inefficiency at the entry print ; churn, not clean bid
- VWAP — active supports ~6,201 / 6,289: bounce B44% · break Br 56% (n=206) — elevated break through support ribbon vs bounce; conflicts with 6H long if the shelf fails
- TL AI — Rising Wedge (Contracting) GEO 06 Jul: bounce B54% · break Br46% (n=24) — flat pattern odds; index geometry not confirming a clean bounce setup
- Price action: Fractal High Formed on the STOXX50 board — local top risk into a flat fill
- Geo/oil gap risk on EU cash — −10% stop can slip on an energy headline open
- Single lot only — no scale-in discount yet
Takeaway: 4H ALMA OVERHEAT-S, hourly EMA stretch, and weekly bull FVG bounce skew support the 76% WR 6H long, but weekly OVERHEAT-L, VWAP Br56%, and 4H bear FVG at ~6,236 cap the first leg — probability layer says patient index grind at entry, not breakout chase toward ~6,413; nominal risk on −10% / Pine exit.
Base case: 6H ALMA holds ~6,180–6,280 · VWAP support shelf holds · slow work toward daily/weekly inefficiency zones ~6,324–6,413 if European risk appetite stabilizes.
Bear case: lose 6H ALMA · 4H bear FVG extends · VWAP support breaks Br56% · geo/oil gap on EU cash · −10% toward ~5,611 from ~6,234 entry.
Chart: ICMARKETS:STOXX50 6H — ALMA Averaging Strategy.
Educational idea. Live position — past backtest ≠ future results. NFA.
Euro stoxx 50 index Wave Analysis – 8 July 2026 - Euro stoxx 50 broke two upward sloping support trendlines
- Likely to fall to support level 6200.00
Euro stoxx 50 index recently fell sharply breaking the two upward sloping support trendlines from June and March.
The breakout of these support trendlines accelerated the active minor corrective wave 4.
Euro stoxx 50 index can be expected to fall further to the next support level 6200.00 (former low of wave iv) – the breakout of which can lead to further losses toward the next support level 6100.00.
Euro Stoxx 50 ($SX5E) Daily: Bullish Channel Extension EyesEuro Stoxx 50 ( TVC:SX5E ) Daily: Bullish Channel Extension Eyes 6,332 Target Ahead of Overextended Mean-Reversion Alert
### 🇪🇺 Euro Stoxx 50 Index ( TVC:SX5E ) Daily Macro Framework (Ref: SX5E_2026-06-25_09-05-04.png)
We are deploying a macro-structural trend analysis on the Euro Stoxx 50 Index ( TVC:SX5E - TVC) on the Daily (1D) timeframe. While the primary aggregate European equity order flow remains aggressively bullish, our quantitative matrix flashes a vital tactical alert regarding short-term price overextension relative to long-term institutional moving averages.
The benchmark index is currently trading up at **6,252.70 (+0.61%)**, advancing inside a highly defined geometric ascending corridor.
---
### 🔍 Trend Geometry & Immediate Upside Target:
1. **The Ascending Channel:** The index continues to firmly validate its primary bullish structures, cleanly bracketed by the upper and lower diagonal red parallel trendlines. Momentum remains strongly skewed to the upside.
2. **The Near-Term Ceiling:** The immediate path of least resistance points toward a continuation sweep to test the absolute upper boundary of the channel. This retest perfectly aligns with the heavy historical horizontal supply barrier locked at **6,332.50** (thick horizontal red line).
---
### ⚠️ Technical Overextension & Mean-Reversion Risk:
Despite the clear bullish velocity, professional risk management requires analyzing the vertical space separating current spot prices from the underlying institutional baselines. The short-term extension has grown highly stretched compared to the following defensive clusters:
* **The Intermediary Filter:** The 72-period SMA (orange line sitting down at **5,928.11**).
* **The Long-Term Baseline:** The core institutional 200-period EMA (purple line sitting at **5,815.49**).
### 🎯 Proportional Pullback Projections:
Once the price achieves its immediate target at the top of the channel or near the **6,332.50** ceiling, we anticipate a healthy technical cooling phase to initiate a substantial mean-reversion rotation:
* **Correction Target 1 (Structural Re-test):** An initial healthy down-leg of **-2.43% (-152.36 points)** to seek liquidity at the lower ascending support line of the active channel.
* **Correction Target 2 (Institutional Demand Node):** If broader profit-taking materializes, a macro correction extending down to **-6.50% (-406.95 points)** will push the index into our primary demand cluster (highlighted by the yellow circle). This zone marks the key structural rebalancing node where the 72 SMA and 200 EMA converge.
### Tactical Playbook:
The market remains a strong 'buy-the-dip' structure on a macro level, but chasing fresh long positions directly into the upper parameters of the channel carries poor structural risk/reward parameters. We favor securing profits on near-term longs as the index approaches **6,332**, patiently waiting for a technical rotation toward the lower support geometries before re-engaging with high-asymmetry long exposure.
---
📊 **ChartPro Data**
*European Blue-Chip Architecture, Mean-Reversion Matrices & Systematic Risk Mitigation.*
⚠️ **Disclaimer:** For educational and informational purposes only. This technical study represents a personal trading framework and does not constitute financial or investment advice.
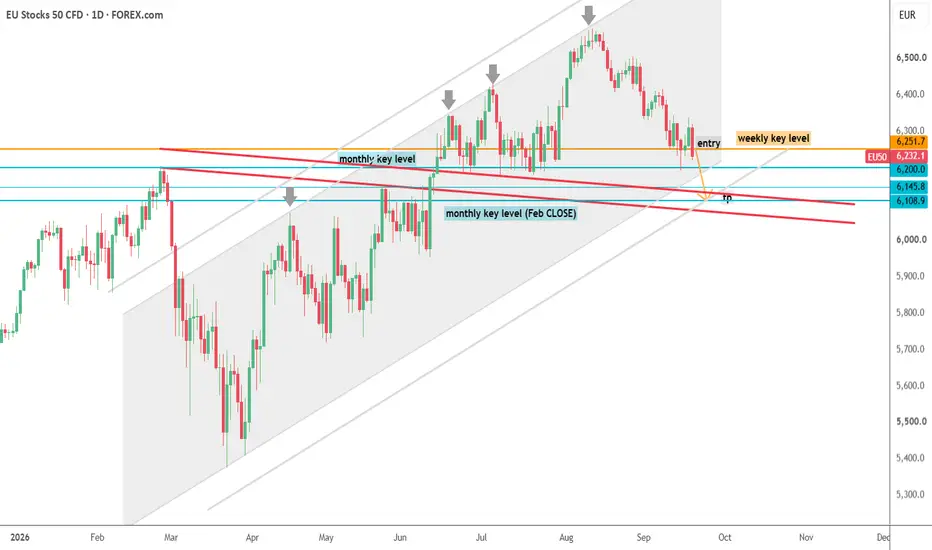
European stocks extend gains thanks to oil collapseFollowing the drop post FOMC, global equity markets have bounced back today, and European markets in particular looking strong. European equity markets remain at or close to record highs, supported by softer energy prices, not-so-bad economic data, and growing confidence that the European Central Bank may not have to hike rates any further - thanks to the collapse in oil prices.
The Euro Stoxx 50 Index has staged a key breakout above 6,200 area of prior resistance this week, and it has held above that level since. Previously, the index was consolidating inside a flag-like pattern before staging a breakout.
The index has already been making a series of higher highs and higher lows, holding for the most part above the 200-day moving average and the 21-day exponential moving average. The fact that the index is holding above both of those moving averages provides a clear indication that the trend is indeed strong, and we could potentially see further gains in the days and weeks ahead.
The key question now is: where do we go from here?
Given that the index is trading at all-time highs, we could use Fibonacci extensions as our guide. The 127.2% extension of the most recent significant downswing comes in at 6,424. So, that will be the next upside objective. The 161.8% extension comes
I’m at 6,709.
Keep support is at 6200, old resistance. Below that 6080/5 area is where we have the 21-day exponential moving average converging with last Wednesday’s high, which was engulfed by the big rally on Thursday of last week. That makes it the most important support to watch.
By Fawad Razaqzada, market analyst with FOREX.com
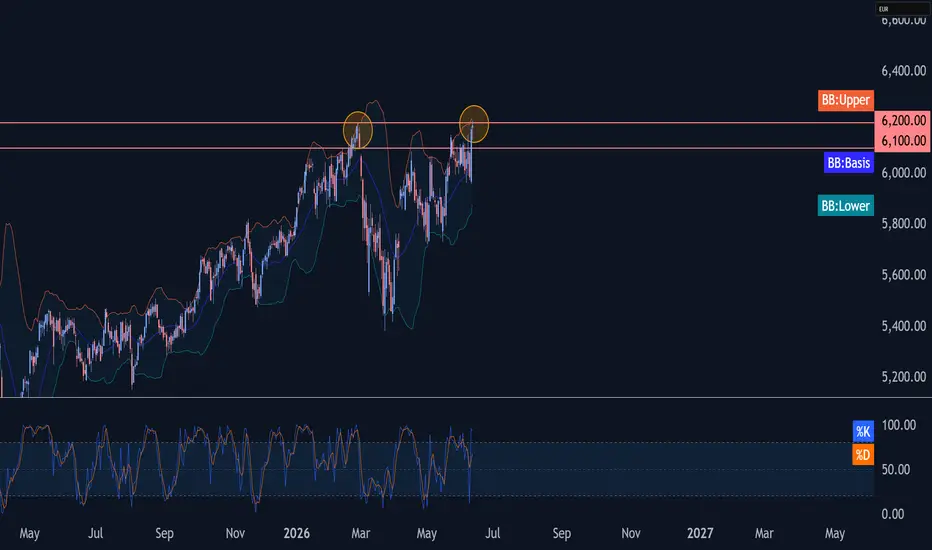
EURO STOXX 50 Wave Analysis – 12 June 2026- EURO50 reversed from powerful resistance level 6200.00
- Likely to fall to support level 6100.00
EURO50 index recently reversed from the powerful resistance level 6200.00 (which stopped the previous sharp daily uptrend at the end of February, as you can see from the daily EURO STOXX 50 chart below).
The resistance zone near the resistance level 6200.00 was strengthened by the upper daily Bollinger Band.
Given the strength of the resistance level 6200.00, EURO50 index can be expected to fall to the next support level 6100.00.
EURO STOXX 50 (SX5E): Testing All-Time Highs – Two Tactical PlayEURO STOXX 50 (SX5E): Testing All-Time Highs – Two Tactical Playbooks for the Ultimate Breakout Resolution
### 🇪🇺 EURO STOXX 50 Structural Outlook (Ref: SX5E_2026-06-12_09-06-44.png)
The Eurozone’s primary blue-chip benchmark, the Euro Stoxx 50 Index ( TVC:SX5E ), is trading in an intensely bullish daily session (+2.14% at 6,186.56), making a direct run at its major structural All-Time High ceiling plotted at the solid horizontal red resistance line of **6,198.95**.
Trading absolute historical peaks requires maximum operational discipline and patience. Rather than chasing price blindly, our tactical blueprint maps out two distinct, highly strategic conditional execution paths depending on how the market resolves this level.
---
### 📈 Playbook A: Valid Structural Breakout (The Long Continuation)
* **The Trigger:** We are strictly monitoring today's daily candle close. If the session completes a decisive breakout and prints a clean candle body closing sustained above **6,198.95**, an active bullish bias is unlocked.
* **The Execution Protocol:** To mitigate institutional risk, we will not chase the initial breakout candle. We will patiently wait for price action to execute a textbook **throwback** (a retest of the broken resistance line flipping into a new horizontal support floor).
* **The Confirmation:** Once a definitive bullish/buyer candlestick structure prints within this retest zone (indicated by the yellow circle at the red line), a long position is initiated targeting a strict **2:1 Risk/Reward profile** (as projected by the blue arrows).
### 📉 Playbook B: Failed Breakout / Bull Trap (The Mean-Reversion Short)
* **The Trigger:** If the market briefly breaches the 6,198.95 peak but subsequent daily candles immediately lose momentum and collapse back *inside* the horizontal resistance boundaries, a major **Bull Trap (Fakeout)** is confirmed.
* **The Execution Protocol:** This failed breakout signature triggers a structural distribution narrative. Capital flow will highly likely initiate a deeper liquidation sweep to clean out late-buyer liquidity.
* **The Targets:** This failure opens a premium short-term shorting or hedging window, targeting a swift mean-reversion move down into our dynamic moving average clusters (marked by the lower yellow targets):
1. **Target 1:** The intermediate **72-period EMA (red line currently at 5,931.47)**.
2. **Target 2:** The long-term trend base—the **200-period EMA (blue line currently at 5,772.88)**.
---
### Strategic Summary:
Patience is everything at historical extremes. Let the daily chart reveal its cards first. We will execute precisely at the key inflection nodes mapped above, maintaining strict risk parameters for either the continuation impulse or the sweeping mean-reversion drop.
---
📊 **ChartPro Data** | By Rogerio Zaglia
*Macro Technical Research, Market Structure Inflexions & Systematic Execution Matrix.*
⚠️ **Disclaimer:** For educational and informational purposes only. This multi-path technical study represents a personal trading framework and does not constitute financial or investment advice.
Euro Stoxx 50 Analysis | Daily & 4H Timeframes📈 Euro Stoxx 50 Analysis | Daily & 4H Timeframes
Hello TradingView traders and investors! 👋📊
I hope you're having a profitable trading week. Today we're taking a look at the Euro Stoxx 50 Index (EUSTX50), one of the most important equity indices in Europe, representing some of the largest and most influential companies across the Eurozone. 🇪🇺💼
As a benchmark for European market sentiment, the index often provides valuable insight into institutional capital flows, economic expectations, and overall risk appetite in global markets.
🌍 Market Overview
The broader market structure remains bullish on higher timeframes. 📈
Despite recent consolidation, buyers continue to maintain control of the long-term trend, and the overall structure still favors upside continuation unless key support levels are broken.
However, as traders, we must separate the long-term trend from the current short-term trading environment. 🎯
📊 Technical Analysis
🚀 Higher Timeframe Trend
Looking at the daily and higher timeframes, the market continues to print a bullish structure with higher highs and higher lows.
✅ Long-term trend remains bullish
✅ Buyers are still defending major support areas
✅ No significant bearish structure has formed yet
⚠️ 4H Breakout – Real Move or Fakeout?
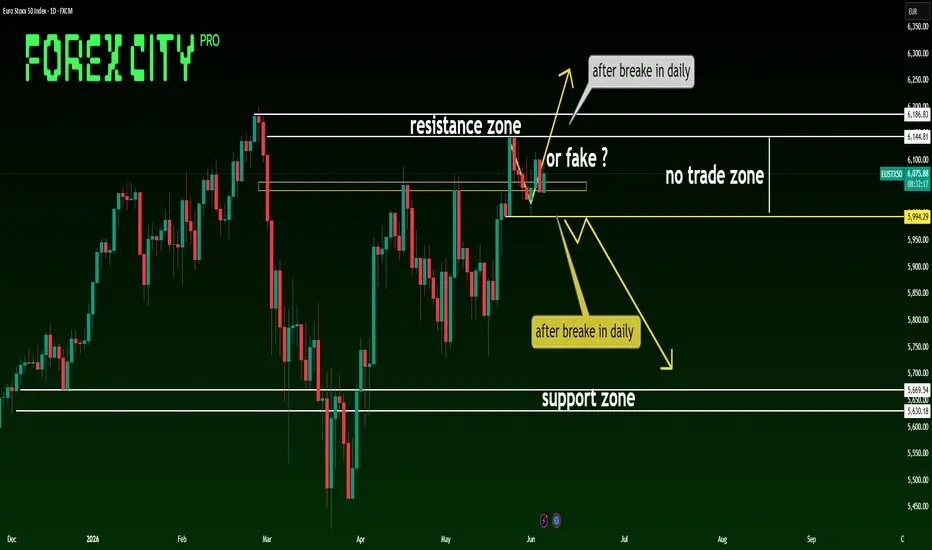
On the 4-hour timeframe, price has recently pushed above the local range high and resistance area. 📦➡️📈
While this breakout is technically bullish, traders should remain cautious because:
🔸 The breakout has occurred directly beneath a major daily resistance zone.
🔸 False breakouts are common around key liquidity areas.
🔸 Price still needs confirmation before a sustainable trend continuation can be expected.
At this stage, the breakout remains promising, but the possibility of a fake move should not be ignored. ⚠️
🚫 Daily "No Trade Zone"
One of the most important observations on the chart is the current location of price.
📍 Price is trading inside a major daily decision area — a zone where neither buyers nor sellers currently have a clear advantage.
For this reason, the highlighted area can be considered a No Trade Zone until a confirmed directional breakout occurs.
Patience is often the highest-probability trade. ⏳
🟢 Bullish Scenario
If buyers manage to achieve a confirmed daily breakout above the resistance zone:
✅ Bullish momentum could accelerate
✅ Institutional buying may increase
✅ A new long-term expansion phase could begin
In this case, the market would likely target higher resistance levels and continue the broader bullish trend. 🚀📈
🔴 Bearish Scenario
If price fails to hold above the current area and breaks the No Trade Zone to the downside on the daily timeframe:
✅ Sellers could regain control
✅ Momentum may shift toward lower support levels
✅ Short opportunities would become technically attractive
A confirmed daily breakdown would be the first meaningful warning sign against the current bullish structure. 📉
⚖️ Current Market Bias
At the moment, I view the bullish and bearish scenarios as equally probable.
📊 Bullish Weight: 50%
📊 Bearish Weight: 50%
The market is currently positioned at a key decision point, and confirmation will be required before committing to a directional bias.
For now, patience and risk management remain the priority. 🎯
🗳️ Community Poll
What do you expect next for the Euro Stoxx 50?
🔘 Daily breakout and continuation higher 🚀
🔘 Fake breakout and move lower 📉
🔘 Continued consolidation inside the current zone 📦
Share your opinion in the comments below! 👇
⚠️ Disclaimer
This analysis reflects my personal interpretation of market structure and price action and is provided for educational purposes only. It should not be considered financial advice. Always conduct your own research, follow proper risk management rules, and never invest more than you can afford to lose.
🏷️ Tags
#EUSTX50 #EuroStoxx50 #EuropeanMarkets #StockMarket #Indices #PriceAction #TechnicalAnalysis #TradingView #SwingTrading #DayTrading #MarketStructure #SupportAndResistance #BreakoutTrading #RiskManagement #Investing #GlobalMarkets #Bullish #Bearish #MarketAnalysis #ForexCity 📈🇪🇺🚀📉
EURO stoxx 50 breaks out, targeting new highsThe EU stocks 50 index has recently broke above former resistance in the 6000 - 6040 area. In the last few days, the index has been testing this area from above and so far has managed to hold above it. The index has also been consolidating inside a bullish continuation pattern, namely a bull flag. Today, it is peaking above the resistance trend of this pattern to suggest that the rally is resuming here. Next target is the all-time of 6,200 hit on Feb 25.
By Fawad Razaqzada, market analyst with FOREX.com
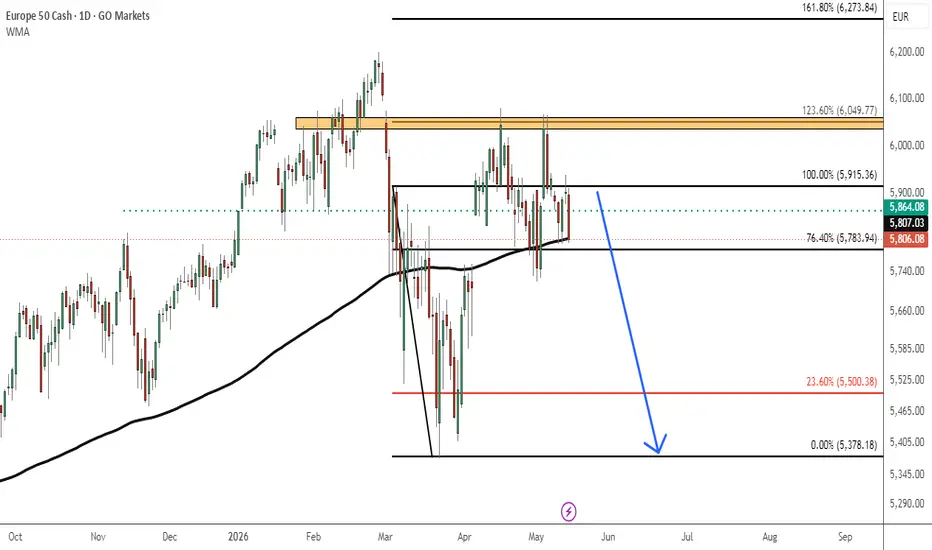
Euro Stoxx 50 Daily: Price Nears Key Confluence of Ascending TreThe Euro Stoxx 50 Index ( TVC:SX5E / FOREXCOM:EU50 ) is presenting a clean technical corrective structure on the Daily Chart, drifting lower toward a well-defined confluence zone where buyers are expected to re-emerge.
Following a strong bullish expansion, the index is experiencing a healthy mean-reversion phase, offering a highly readable environment for swing traders tracking European benchmarks.
### Key Technical Factors:
* **The Aggressive Ascending Trendline (LTA):** A steep green support line is climbing rapidly, acting as the immediate dynamic floor for the medium-term bullish momentum.
* **The Fibonacci Retraction Framework:** Drawn from the recent structural swing, the price is currently battling near the **0.236 Fibonacci level (6,047.0)**. A minor extension lower points directly to a test of the **0.382 level (5,986.3)**, which perfectly intersects with the rising LTA.
* **The Macro Support & EMA 200:** Should the corrective phase accelerate, a massive structural floor is located lower at the **1.0 Fibonacci level (5,729.0)**. This static level aligns seamlessly with the long-term **200-period Exponential Moving Average (EMA 200 - purple line at 5,739.3)**.
* **Overhead Target Wall (6,194.4):** The historical macro resistance remains firmly established at the **6,194.4** horizontal red line.
### Strategic Scenario & Execution Plan:
The dashed trajectory line on the chart illustrates a classic technical retest sequence:
1. **The Downside Drift:** Short-term selling pressure is leading the price to interact with the intersection of the green LTA and the internal Fibonacci retracements (between 6,047 and 5,986).
2. **The Bullish Reaction:** Because this area represents a structural cluster, it is a high-probability zone for buyer absorption. A clean hold here opens the path to target a retest of the major 6,194.4 overhead resistance wall.
We will monitor lower timeframes (such as H4 or H1) as the price enters this confluence zone, looking for deceleration signs or a structural shift (CHoCH) to define a tight, low-risk long entry.
---
📊 **ProData Chart** | By Rogerio Zaglia
*12+ years of daily global market technical analysis.*
⚠️ **Disclaimer:** This analysis is for educational and informational purposes only. It does not constitute financial advice or an investment recommendation. Past performance is not indicative of future results.
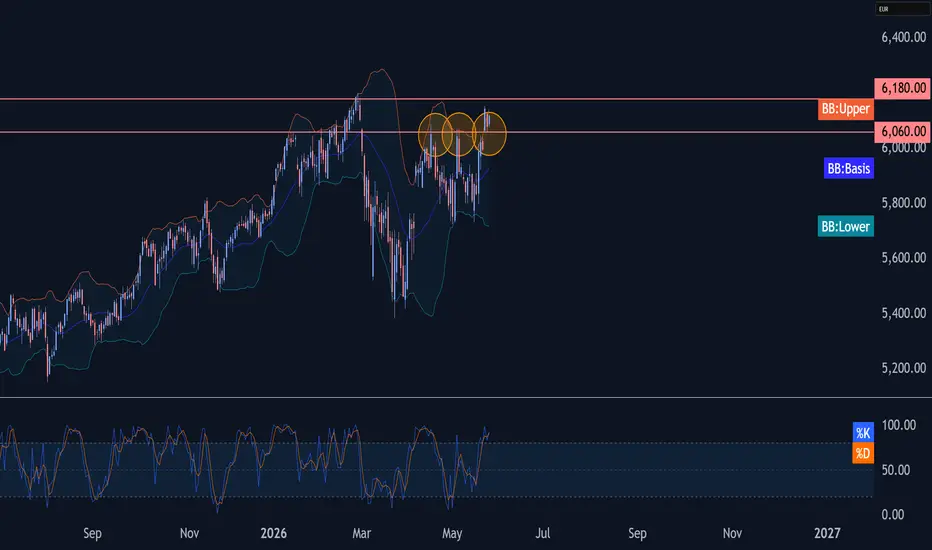
EUR50 index Wave Analysis – 27 May 2026 - EUR50 reversed from pivotal support level 6060.00
- Likely to rise to resistance level 6180.00
EUR50 index recently reversed up from the pivotal support level 6060.00, former resistance level which stopped previous waves 1 and I (acting as support after it was broken).
The upward reversal from the support level 6060.00 continues the active short-term impulse wave (iii) from the middle of May.
Given the clear daily uptrend, EUR50 index can be expected to rise to the next strong resistance level 6180.00 – which stopped the multi-year uptrend in February.
EU50 | Trade-Setup📌 We hace one bigger active structure on the daily chart, which B-C correction area already got triggert and i am in an active trade.
When price reversed out of the B-C area we also actived another valid structure which i will also trade on a different trading account
Trademanagement:
- I'm placing short orders at each level and SL right before the next level.
- Once the trade reaches a 2 R/R, I’ll move the stop-loss to break-even.
- From a 3 R/R onward, I’ll start locking in profits.
✅ I welcome every upside correction from here on.
Price can also continue climbing down without reaching the total correction zone!
Price can also continue climbing above the correction zone, but highest chance of a reversal is there.
EUR50 Index Wave Analysis – 3 March 2026
- EUR50 Index broke support zone
- Likely to fall to support level 5685,00
EUR50 Index recently broke the support zone between the support level 5830,00 (former resistance from November and the support from January), 50% Fibonacci correction of the upward impulse 3 from November and the support trendline of the daily up channel from November.
The breakout of this support zone accelerated the active short-term correction iv from the end of February.
EUR50 Index can then be expected to fall further to the next support level 5686.00 (former support from the end of December).
EuroStoxx 50: the market corrects, but still far from panicBy Ion Jauregui – Analyst at ActivTrades
European stock markets are going through a phase of contained correction in an increasingly tense geopolitical context, marked by the diplomatic clash between the United States and the European Union following Donald Trump’s threats regarding Greenland and the possible imposition of new tariffs. Even so, the market, for now, is clearly avoiding “panic mode.”
From the January highs, the EuroStoxx 50 is correcting by around 2.5%, a move that is starting to unsettle shorter-term investors, but which remains very moderate when analysed in historical perspective. It is enough to recall that in recent episodes, such as the so-called “Liberation Day” last year, the index fell by close to 13%, more than tripling the current correction.
Flows into safe-haven assets, especially gold, confirm that there is concern, but not capitulation. Capital is not leaving equities in a disorderly manner; instead, exposure is being adjusted and tactical risk reduced in response to rising political and trade uncertainty. The recent slump in sectors such as utilities, particularly sensitive to regulatory and geopolitical noise, is a clear example of this selective behaviour.
From a broader perspective, the major corrections of the past five years have averaged close to 9%, occurring in much more extreme contexts: the inflation crisis, aggressive interest-rate hikes, the war in Ukraine, tensions in the banking system, or disruptions in the currency market. Against that backdrop, the current adjustment in the EuroStoxx 50 still fits within a normal consolidation phase following a mature bullish run.
Technical Analysis EuroStoxx 50 (Ticker AT: EURO50)
From a technical standpoint, with a long-term bullish trend, the European index had broken through relevant resistance levels at the beginning of the year, reinforcing the idea that the current declines are more a digestion of gains than a structural change in trend. As long as the key supports built in November are not lost, the underlying bias remains bullish. These types of corrections, in the absence of severe macro deterioration or a fully unleashed trade war, tend to act as rebalancing zones rather than a prelude to a bear market. Risk exists and should not be ignored, but price behaviour remains consistent with a market that is adjusting expectations, not entering panic.
Looking at the chart, the 50-day moving average support was lost in yesterday’s session, and the market opened positive but still without the strength required to recover the highs area this week. The RSI stands in the mid-zone at 53.50%, and the MACD is in correction, still positive but with a red histogram, confirming the thesis of increased European risk volume, with the ActivTrades Europe Market Pulse indicator still trending higher after the pullback from highs. The point of control around 5,735 points, a previous consolidation area, could confirm the plausible scenario of a return to that prior consolidation zone if the 100-day moving average is lost. If this level holds, a new test of highs could follow.
European Countermeasures
The EuroStoxx 50 faces a complex environment, with geopolitics, tariff threats and sectoral volatility, but the magnitude of the correction does not yet justify extreme interpretations. As long as the market does not begin to lose key technical levels and uncertainty does not translate into concrete measures, the base scenario remains one of controlled corrections within a still constructive primary trend. Much will depend on the European response to tariff conflicts and the potential application of a “bazooka of European protection measures,” which could affect both economies very sharply. For now, attention turns to corporate earnings to see whether the data support a renewed upside test. Among these are ASML, SAP, Siemens, TotalEnergies, LVMH, Bayer and Allianz, among others, which could drive or consolidate a sideways phase in the index.
*******************************************************************************************
The information provided does not constitute investment research. The material has not been prepared in accordance with the legal requirements designed to promote the independence of investment research and such should be considered a marketing communication.
All information has been prepared by ActivTrades ("AT"). The information does not contain a record of AT's prices, or an offer of or solicitation for a transaction in any financial instrument. No representation or warranty is given as to the accuracy or completeness of this information.
Any material provided does not have regard to the specific investment objective and financial situation of any person who may receive it. Past performance and forecasting are not a synonym of a reliable indicator of future performance. AT provides an execution-only service. Consequently, any person acting on the information provided does so at their own risk. Political risk is unpredictable. Central bank actions can vary. Platform tools do not guarantee success.
EUR50 Index Wave Analysis – 19 January 2026
- EUR50 Index reversed from resistance area
- Likely to fall to support level 5900.00
EUR50 Index recently reversed from the resistance area between the resistance level 6040.00, upper daily Bollinger Band and the resistance trendline of the daily up channel from December.
The downward gap from this resistance area stopped the earlier impulse waves 5 and (3).
Given the strength of the resistance level 6040.00 and the overbought daily Stochastic, EUR50 Index can be expected to fall to the next support level 5900.00.
The Euro Stoxx 50 Index Reaches a Record HighThe Euro Stoxx 50 Index Reaches a Record High
As the charts show, the Euro Stoxx 50 price climbed above 6,055 points today, thereby setting a new all-time high.
Bullish sentiment is being supported by expectations of ECB interest rate cuts in 2026 and other fundamental factors, including:
→ News from China. Data released today have fuelled optimism about China’s economy, with Europe being one of its key trading partners.
→ Rising defence-sector stocks amid geopolitical tensions. For example, Rheinmetall shares have gained around 20% since the start of 2026.
An analysis of the Euro Stoxx 50 chart shows that:
→ price fluctuations are forming an ascending channel, with the price often remaining in its upper half (evidence of strong demand);
→ earlier this week, the price encountered resistance around the 6,040-point level. Today’s breakout above this level (marked by an arrow) may have attracted new buyers, pushing the price even higher.
It cannot be ruled out that today’s break to record highs may form another support zone (two similar zones are highlighted on the chart), helping bulls to maintain the trend.
On the other hand, some analysts point to significant market overbought conditions. As a result, a pullback towards the lower boundary of the channel remains a possible scenario.
How the Euro Stoxx 50 index moves next will largely depend on shifts in the unpredictable news backdrop. Note that today the US Supreme Court may rule Trump’s tariff policy — which also affects trade with Europe — unlawful.
This article represents the opinion of the Companies operating under the FXOpen brand only. It is not to be construed as an offer, solicitation, or recommendation with respect to products and services provided by the Companies operating under the FXOpen brand, nor is it to be considered financial advice.
E