BLUR at macro floor: base recovery toward $0.01774BLUR has spent the summer grinding lower from $0.029 into the low $0.013s, and price has now stopped falling right on its structural floor. This is where accumulation setups live — a market that has stopped bleeding and started building a base.
The Macro Picture 🗺️
The broader trend has been a steady downtrend, but the sell-off has lost momentum near the lows. Local High / Decision sits far overhead at $0.02570, while price coils just above the level that has held every recent test.
The Setup ⚙️
Price is trading at $0.01352, sitting right on top of Macro Support at $0.01326. The Local High / Decision line at $0.02570 marks the ceiling that a full recovery has to reclaim.
The Accumulation Zone 🟢
$0.01326–$0.01352 is the zone that matters. This is where patient buyers step in — building a position into weakness rather than chasing strength, letting the floor do the work.
The Decision Point 🔴
$0.02570 is the level that flips the story. Lose the floor and the base breaks; reclaim the decision line and the path higher opens up.
The Roadmap 🛣️
Holding $0.01326 keeps the base intact and points price toward the $0.01774 bull target. Invalidation is a daily close below $0.01326 — lose the floor and the accumulation thesis is off.
A DCA bot thrives in exactly this kind of setup — automatically averaging into the Accumulation Zone while price bases, so you build size at the floor instead of guessing the exact bottom.
#BLUR #Crypto #Bitcoin #Altcoins #DCA #TradingView #3Commas
In-depth trading ideas
$BLUR How to Short and Exploit WeaknessMost retail traders would be scared to short a coin such as CRYPTOCAP:BLUR down ~98% over the past ~900 days.
Many would actually see this as a BUYING opp because of “potential upside”.
Pros see opportunity in weakness and exploit it.
Study this 🤓
#BuiltDifferent
#BLURUSDT#BLUR
The price is moving within a descending channel on the 1-hour timeframe and has reached the lower boundary. It is now poised for a bounce and is expected to retest this boundary.
The Relative Strength Index (RSI) indicates a downward trend, which is likely to continue given the overbought conditions.
There is a key support zone in green at 0.01488, and the price has bounced off this zone several times, making it a strong support level.
The price is trending towards the 100-period moving average, which we are approaching. This trend supports an upward move.
Entry Price: 0.01570
Target 1: 0.01590
Target 2: 0.01616
Target 3: 0.01647
Stop Loss: At the resistance zone in green
Remember this simple rule: Money management.
Any questions? Please leave a comment.
Thank you.
BLUR Holds Monthly SupportBLUR has recently experienced a technical rejection from the 0.618 Fibonacci retracement, signalling that sellers remain active at higher prices. Following the rejection, price has moved back below the range Point of Control (POC), indicating that momentum has shifted slightly in favor of the bears in the short term.
Despite this weakness, BLUR continues to hold an important monthly support level. This area represents the key foundation of the current trading range and is where buyers are expected to defend the broader market structure. As long as price remains above this support, the recent decline can be viewed as a corrective move rather than the beginning of a larger bearish trend.
From a technical perspective, maintaining the monthly support opens the probability of a rotation higher, with the first objective being a move through the weak high that currently sits above price. Clearing this liquidity would strengthen bullish momentum and increase the likelihood of a rally toward the daily resistance, allowing BLUR to continue trading within its established range.
However, a loss of the monthly support would invalidate the current bullish outlook and increase the probability of a deeper correction.
For now, BLUR remains in a constructive position while holding above monthly support. Traders should closely monitor this level, as a sustained defense could provide the catalyst for the next rotation back toward the upper boundary of the current trading range.
BLUR/USDT — Long at Retest, Second Signal at Higher BaseBLURUSDT Perpetual
Context:
BLUR has been one of the strongest movers this month — rallying from 0.018 to 0.036, nearly doubling in two weeks. That kind of impulsive move doesn't happen without institutional participation. After the rally peaked, price corrected back to 0.028 — a healthy 22% pullback that's now finding support.
Why this setup works — three confluences:
Second Buy signal at a higher base — the first Buy signal at 0.021 launched a 70% move. Now a second Buy has fired at 0.027 — significantly higher than the first. This is the clearest sign of accumulation: institutions are willing to pay more each time they reload. Rising signal levels = rising demand
Breakout retest — the 0.027–0.029 zone was where BLUR consolidated before the explosive breakout to 0.036. Price has pulled back exactly to this breakout zone. The most reliable entry in a strong trend is the first retest of the level that launched the move
Correction structure — the sell-off from 0.036 to 0.028 was corrective — overlapping candles, slow grind, no panic. Compare that to the impulsive rally — clean bullish candles with follow-through. Impulsive moves in the trend direction and corrective moves against it = trend continuation
A Buy signal fired at 0.02817. We took it.
Trade management:
Entry: 0.02817
Stop Loss: 0.02438 — below the demand zone and previous structure
TP1: 0.03077 — mid-range resistance, 50% off, stop to breakeven
TP2: 0.03224 — upper target for 100% exit
R:R: ~1:0.7 to TP1, ~1:1.1 to TP2. Managed exit secures profit early, TP2 rides risk-free.
Invalidation: Close below 0.02438 — the higher base breaks and the bullish structure fails.
The lesson:
After a massive impulsive move, the instinct is to think "I missed it." But the best entries often come after the move — on the first pullback to the breakout zone. The move proved the direction. The pullback gives you the entry. The signal confirms the timing. You don't need to catch the bottom. You need to catch the retest.
Signal fired. We took it. Update coming.
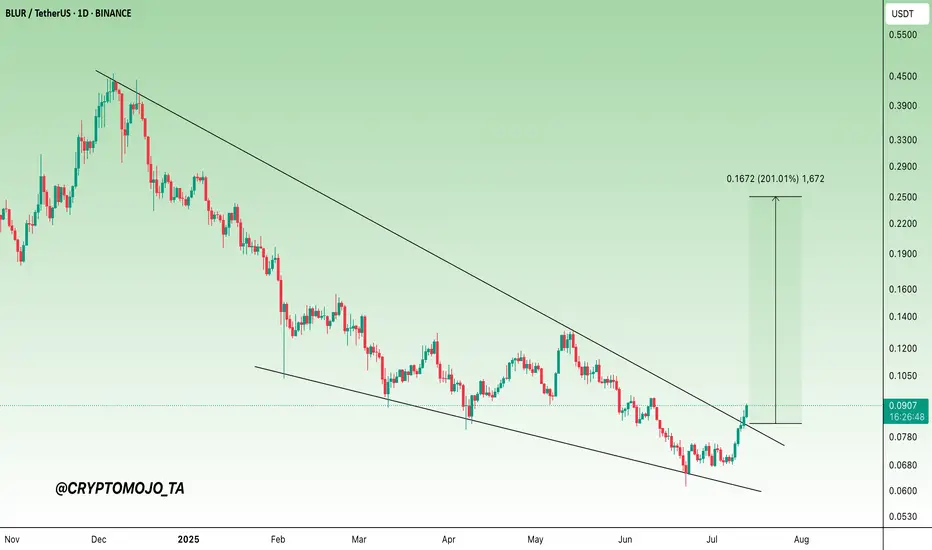
BLURUSDT Forming Falling WedgeBLURUSDT is forming a clear falling wedge pattern, a classic bullish reversal signal that often indicates an upcoming breakout. The price has been consolidating within a narrowing range, suggesting that selling pressure is weakening while buyers are beginning to regain control. With consistent volume confirming accumulation at lower levels, the setup hints at a potential bullish breakout soon. The projected move could lead to an impressive gain of around 30% to 40% once the price breaks above the wedge resistance.
This falling wedge pattern is typically seen at the end of downtrends or corrective phases, and it represents a potential shift in market sentiment from bearish to bullish. Traders closely watching BLURUSDT are noting the strengthening momentum as it nears a breakout zone. The good trading volume adds confidence to this pattern, showing that market participants are positioning early in anticipation of a reversal.
Investors’ growing interest in BLURUSDT reflects rising confidence in the project’s long-term fundamentals and current technical strength. If the breakout confirms with sustained volume, this could mark the start of a fresh bullish leg. Traders might find this a valuable setup for medium-term gains, especially as the wedge pattern completes and buying momentum accelerates.
✅ Show your support by hitting the like button and
✅ Leaving a comment below! (What is your opinion about this Coin?)
Your feedback and engagement keep me inspired to share more insightful market analysis with you!
BLUR/USDT — Breakout from Downtrend or Rejection?The BLUR/USDT (2D timeframe) chart shows a strong downtrend structure, clearly defined by a descending trendline resistance that has consistently pushed the price lower since its previous peak.
Currently, price is sitting at a crucial area — retesting the trendline while attempting to break out from a consolidation phase near the bottom.
---
Structure & Key Pattern
Primary Trend: Bearish (clear Lower High & Lower Low structure)
Dominant Pattern:
➤ Descending Trendline / Downtrend Structure
➤ Potential Accumulation Base around the low zone (0.016 – 0.021)
Price is starting to show:
A rebound from strong support (0.01654)
An attempt to break above the trendline resistance
This is a critical phase that could signal an early reversal if confirmed.
---
Key Levels
Main Support: 0.0165 – 0.0210
Nearest Resistance: 0.0260
Next Resistance / Targets:
0.0330
0.0390
0.0490
---
Bullish Scenario 🚀
Bullish confirmation occurs if:
Price breaks and closes above the trendline + resistance at 0.026
A higher low forms after the breakout
Potential movement:
Target 1: 0.0330
Target 2: 0.0390
Target 3: 0.0490
📌 This could mark the early stage of a trend reversal after a prolonged downtrend.
---
Bearish Scenario 📉
Bearish remains valid if:
Price fails to break the trendline (fake breakout)
Strong rejection occurs around 0.026
Price breaks back below minor support
Potential movement:
Retest 0.0210
Even a move back to the low at 0.0165
📌 This would indicate a continuation of the downtrend.
---
Conclusion
BLUR is currently in a decision zone. The breakout from the trendline will determine whether the market will:
Reverse into a bullish trend, or
Continue its bearish trajectory
The next move heavily depends on price reaction around 0.026 and the trendline.
#BLURUSDT #CryptoAnalysis #TechnicalAnalysis #Altcoin #Breakout #Downtrend #BullishScenario #BearishScenario #CryptoTrading #PriceAction #SupportResistance
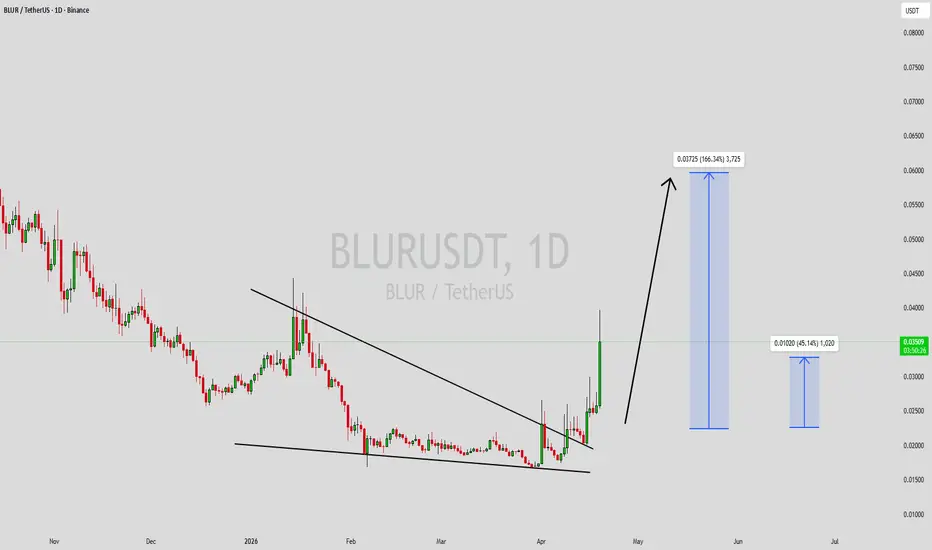
BLURUSDT UPDATECRYPTOCAP:BLUR Technical Setup Pattern: Falling Wedge Breakout Current Price: $0.02266 Target Price: $0.0300, $0.0340 Target % Gain: 55.20% BLUR is breaking out of a falling wedge on the 1D timeframe with a strong bullish candle pushing above the descending resistance, supported by momentum shift and indicating potential continuation toward higher levels Time Frame: 1D
BLURUSDT Forming Falling WedgeBLURUSDT is forming a clear falling wedge pattern, a classic bullish reversal signal that often indicates an upcoming breakout. The price has been consolidating within a narrowing range, suggesting that selling pressure is weakening while buyers are beginning to regain control. With consistent volume confirming accumulation at lower levels, the setup hints at a potential bullish breakout soon. The projected move could lead to an impressive gain of around 140% to 150% once the price breaks above the wedge resistance.
This falling wedge pattern is typically seen at the end of downtrends or corrective phases, and it represents a potential shift in market sentiment from bearish to bullish. Traders closely watching BLURUSDT are noting the strengthening momentum as it nears a breakout zone. The good trading volume adds confidence to this pattern, showing that market participants are positioning early in anticipation of a reversal.
Investors’ growing interest in BLURUSDT reflects rising confidence in the project’s long-term fundamentals and current technical strength. If the breakout confirms with sustained volume, this could mark the start of a fresh bullish leg. Traders might find this a valuable setup for medium-term gains, especially as the wedge pattern completes and buying momentum accelerates.
✅ Show your support by hitting the like button and
✅ Leaving a comment below! (What is your opinion about this Coin?)
Your feedback and engagement keep me inspired to share more insightful market analysis with you!
BLUR READY FOR BREAKOUT🔥 Fortune AI Radar — CRYPTOCAP:BLUR
Fresh activity detected on CRYPTOCAP:BLUR today.
Data suggests increasing market interest & buyers stepping in.
Technicals currently lean bullish, with momentum trending upward.
Whales showing hints of accumulation and hype rising among trader
$BLUR Breakout AttemptBINANCE:BLURUSDT is gaining momentum with a 21% move, backed by a strong spike in volume relative to its market cap.
Liquidity appears to be rotating back into NFT-related sectors, with trading platforms seeing renewed activity. Price action is showing a clear breakout structure, with volatility expanding and buyers stepping in consistently.
The elevated volume suggests participation from both retail and algo flows, making BLUR one of the key gauges for speculative appetite across NFT infrastructure tokens in the short term.
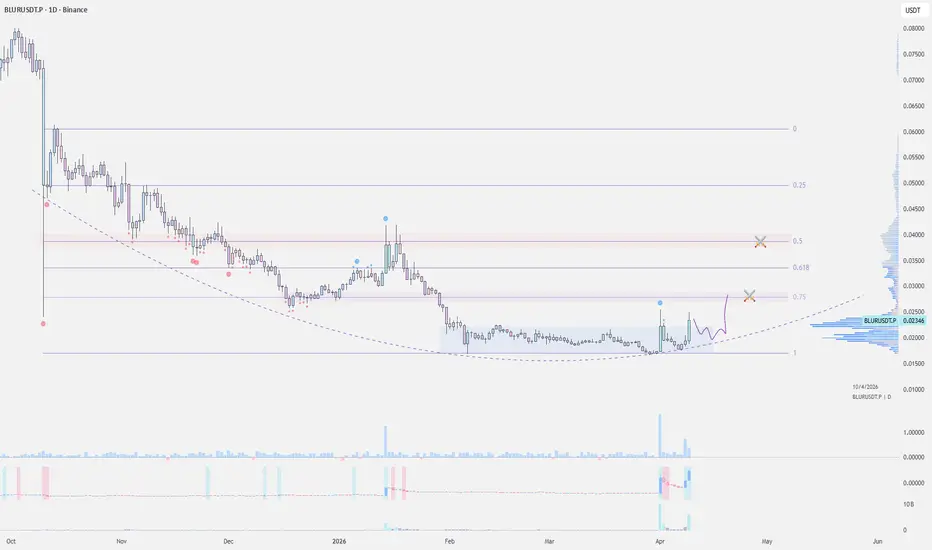
BLUR is attempting to break out of its 2-month consolidation range and is now pushing toward 0.024.
As long as $0.018 holds, continuation targets sit at:
→ $0.030
→ $0.040
If $0.018 fails, downside opens toward:
→ $0.014
→ $0.012
BLURUSDT — Frenzy Volume SHORT REKT Confirmed ... With Backwardation Deepening to -4.9 Sigma
Spot:Fut reading Euphoria with futures dollar flow at 182.33M against spot 22.15M — the 8.2x futures dominance ratio is unchanged from the prior read and the Euphoria tag persists. Unit volume at 941.04M spot versus 7.75B futures confirms leveraged positioning is fully in control of this move. SHORT REKT liquidation still active — short squeeze has not exhausted yet one minute later.
Signal board holds 26 green to 23 red out of 112 — the neutral board persists against the volume frenzy backdrop. Strong BULL 30.61% at 1.88x, clarity 44%. EMA 3:1, Ichi TK 6:6, C>T 6:8 red, Candle 7:7, DD/SS 1:7 unchanged — the pattern and signal layer is still not confirming the frenzy below it. Squeeze FIRED, momentum bull rising, BW 35.83% normal. Weak Bull Cascade 3 bars at 21.9%. The signal board has not deteriorated or improved in one minute — the structure is locked in transition.
Spot Z 4.79 Frenzy, Fut Z 4.55 Frenzy, combined 4.61 Frenzy — all three holding frenzy state with Spot Z range now accelerating from 0.33 to 4.46 with double arrows. Bull:Bear Z 4.9 to -0.53 Bull Dominance — marginally stronger than the prior read. OBV Z 4.15 Rush rising, no divergence. Spot momentum expanding at 753.2% wide. The volume intelligence layer is sustaining, not fading — this is the key distinction from a one-candle frenzy that exhausts immediately.
Leverage at 8.01x elevated, percentile 6.8% floor — holding near identical to prior read. Prem has deepened to -2.63% extreme backwardation at -4.9 sigma with yield -2884% APY bull — that sigma moved from -4.1 to -4.9 in one minute, meaning the backwardation is accelerating deeper rather than collapsing upward as expected. MeanZ -1.19 sigma falling. That deepening backwardation against a sustained frenzy volume read creates an increasingly unstable tension — the further it stretches the more violent the snap back when it releases.
The honest read: One minute later and BLUR's frenzy is sustaining rather than fading — Spot Z holding 4.79, OBV Rush still rising, SHORT REKT still active, Bull Dominance strengthening slightly to 4.9. The backwardation deepening to -4.9 sigma is the new data point — it moved the wrong direction for equilibrium and is now at an extreme that historically forces resolution fast. DD/SS at 1:7 and the neutral signal board remain the friction. The setup is not weakening but the backwardation compression is building toward a violent resolution in either direction. Frenzy conditions at price floor with deepening backwardation — this is the highest risk highest reward configuration in this session.
Is That Crypto Pump Real? Data Says No. Here's Why.
Stop Losing Money to Fake Volume. Find Real Moves Now.
Trade the REAL Crypto Volume. Stop Getting Faked Out.
BLURUSDT— Spot BlackSwan Volume,-3.27% Backwardation, SHORT REKTSpot dollar volume printed 23M against 160.45M on the futures side as BLUR erupted off the demand zone with a volume event that the data classifies as BlackSwan territory across every Z-score band. The futures-to-spot notional ratio sits at 6.74x Elevated — not in manipulation range, but futures are running the show. The squeeze fired and the move is real. Price is now at 0.02323 with futures at 0.02255, confirming backwardation of -3.27%.
Signal count reads 46 green to 4 red out of 112, with 13 green to 1 red on close-versus-Tenkan confirming the move is structurally clean into higher timeframes. Candle bias is 14 green to zero red. EMA trend is 4 green to 1 red. Three pattern signals fired — 2 Three Soldiers, 3 Morning Stars, 5 total bullish candle patterns with zero bearish opposition. Supply-demand zones show 1 demand to 7 supply, meaning overhead is loaded. Spread reads 74.6% Extreme conviction. Squeeze FIRED with momentum bear ↑ and BBW at 30.69% Normal — the release is underway, not exhausted.
Spot Z is at 8.23 BlackSwan. Futures Z is at 9.47 BlackSwan. Combined F+S Z hits 9.52 BlackSwan. SpotZ 1:5 reads 8.23 against -0.44 five bars ago — an 8.67 acceleration delta with double-up arrows. Spot:Futures status is Full Send, meaning both sides elevated simultaneously. This is not a futures-only ghost pump. Bull:Bear Z is 10.47 to -0.64, pure bull dominance with no bear volume present.
Leverage at 6.74x trending down with percentile at 5.7% Floor. AT Max printed 109.26x only 5 bars ago — the leverage peaked on the squeeze and is already unwinding, which is structurally healthy. AT Min is 0.58x at 897 bars ago. Price percentile is 9% Floor, meaning price has only recovered to the very bottom of its historical range despite this move. The retrace reads -10.3% Deep off the prior structure high, and bounce from lows is 40.4% at 3.9x ratio, classified as Breakout.
OBV Z sits at 0.93 with Strong ↑ slope, confirming spot accumulation is running behind the price. OBV Div shows Spread Divergence, meaning OBV Z and Spot Z are separated — the volume spike is outpacing OBV's ability to absorb it cleanly. Liquidation status is SHORT REKT. Whale BUY confirmed. Yield is -3582% APY at -7.9 sigma — extreme backwardation signals shorts are paying longs to hold, the funding structure is forcing short exits. Bull:Bear Z dominance at 10.47 leaves no ambiguity about who controls this candle.
The honest read: this is a real spot-backed breakout from a multi-month low with BlackSwan volume on both spot and futures firing simultaneously — the Full Send classification is earned. The concern is overhead supply: 7 supply zones to 1 demand means the move will face distribution walls rapidly. Leverage is already unwinding from a 109x peak just 5 bars ago, which historically marks the exhaust zone. The backwardation at -7.9 sigma is extreme and will normalize — when it does, the short squeeze fuel runs out. This is a scalp breakout event, not a position entry. Chasing at 0.02323 into 7 supply zones without a pullback confirmation is the wrong trade.
Is That Crypto Pump Real? Data Says No. Here's Why.
Stop Losing Money to Fake Volume. Find Real Moves Now.
Trade the REAL Crypto Volume. Stop Getting Faked Out.
BLUR Cryptocurrency potential Sell-Off soon!BLUR serves as the governance token for Blur, a non-fungible token (NFT) marketplace and aggregator platform.
BLUR Market Cap is $813Mil
BLUR Fully Diluted Market Capitalization is $1,96 Billion!
49.46M $BLUR(about $32.50M) was unlocked yesterday and they will be unlocking more coins next month!
I have a rival to study for comparison, Rarible and its token RARI.
Rarible operates as an NFT marketplace and issuance platform with a focus on empowering creators. The platform leverages the RARI token to reward users engaged in active interactions with the protocol.
RARI Market Cap is $32Mil
RARI Fully Diluted Market Capitalization is $35Mil!
In 2021 RARI was trading at $63.53 and its fully diluted Mk cap was $1.57 Billion! Sounds familiar?
Then the DILUTION started!
And now is trading 45X lower, at $1.4!
In case it will follow RARI`s rule, my price target for BLUR is $0.015.
Now it`s trading at $0.657!
Blur Recovers, No Longer Trading At Bottom PricesLook at this chart and consider the candles. Look at the size of the candles. What do you see?
On the left side these candles are really big. Late 2023 to early 2024.
Notice the right side of the chart, present day. See how small the candles are but notice the volume. The 21-July week has really high volume but notice the size of the candle, very small. While there wasn't much change in price, the action was similar to November 2024. Something big happening behind the scenes.
These are bottom signals. BLURUSDT is trading at bottom prices.
If you zoom in, you will find several interesting signals. Signals that support a bullish bias based on the short-term. Chart:
The current candle (active session) is trading as a hammer, which is a bullish pattern when it happens at low prices after a downtrend. The same candle is also a higher low compared to June. The session is green.
Summary
Long-term, we have signals pointing to a bottom. The size of the candles and price action going flat. Short-term, we have high volume and also a higher low.
BLURUSDT is about to produce a new bullish wave.
Thank you for reading.
Namaste.
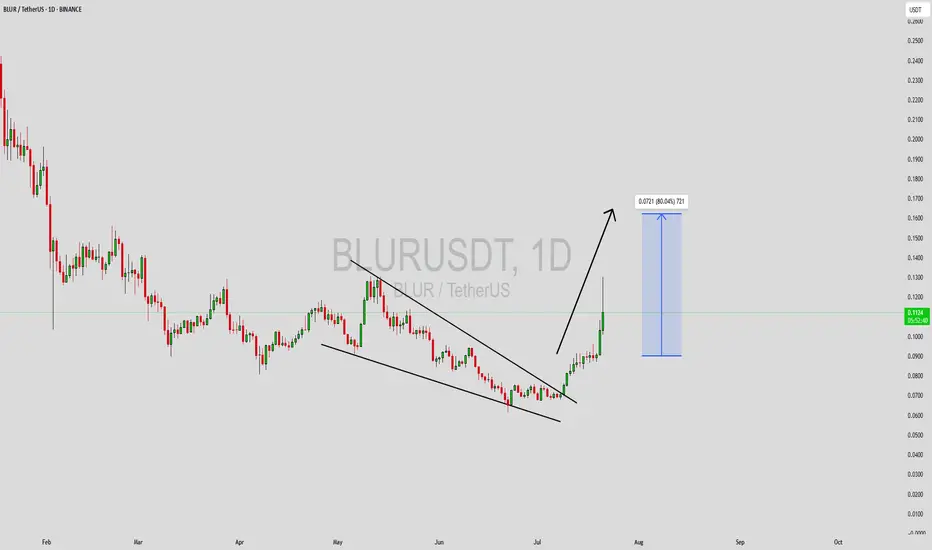
BLURUSDT Forming Descending TriangleBLURUSDT is currently forming a descending triangle pattern, a structure that often signals a potential breakout — either bearish or bullish depending on key support levels. In this case, strong buying pressure and good volume hint at a bullish reversal from this consolidation phase. If price breaks above the descending trendline resistance, traders could see an upward move of 70% to 80%+, especially given BLUR's recent accumulation behavior and increased market interest.
The fundamentals behind BLUR, a token powering the Blur NFT marketplace, are also contributing to its market traction. As interest in NFT infrastructure and marketplace tokens grows again, BLUR appears to be regaining investor confidence. This renewed momentum aligns with the technical structure that shows tightening price action and lower volatility — often a precursor to significant movement.
Traders and analysts will be watching the breakout levels very closely. A sustained move above the upper boundary of the triangle, accompanied by rising volume, would provide a strong confirmation of the bullish scenario. With current on-chain activity and increasing social engagement, BLUR may surprise the market with its next impulse wave.
✅ Show your support by hitting the like button and
✅ Leaving a comment below! (What is You opinion about this Coin)
Your feedback and engagement keep me inspired to share more insightful market analysis with you!
BLURUSDT Forming Bullish WaveBLURUSDT is currently shaping up a promising bullish wave that’s catching the eye of both swing traders and long-term crypto investors. With a strong surge in trading volume, this pattern indicates that fresh buying momentum is entering the market. Traders are watching closely for confirmation that BLUR can sustain this upward move, potentially delivering an impressive 80% to 90% gain if momentum continues to build over the next few weeks.
The BLUR token, known for its role in the decentralized NFT marketplace ecosystem, has been gaining traction as new developments and integrations add value to its use case. This increased investor interest is translating into healthy market activity and supports the idea that BLURUSDT could maintain its upward trajectory. The growing NFT sector remains one of the hottest trends in crypto, and BLUR stands to benefit as it continues to expand its user base and ecosystem.
From a technical analysis perspective, the bullish wave pattern suggests a strong push toward higher resistance levels if buyers can defend key support zones. Watching for consolidation and a series of higher lows will be essential for traders looking to ride the next leg up. If the crypto market remains favorable and Bitcoin stays stable, BLUR could hit its projected targets with relative ease.
✅ Show your support by hitting the like button and
✅ Leaving a comment below! (What is You opinion about this Coin)
Your feedback and engagement keep me inspired to share more insightful market analysis with you!