American Superconductor Corporation
No trades
No trades
54.91 MXN
2.40 B MXN
5.36 B MXN
46.79 M
Next report date
—
Report period
—
EPS estimate
—
Revenue estimate
—
Details
Sector
Industry
CEO
Daniel Patrick McGahn
Website
Headquarters
Ayer
Founded
1987
IPO date
Dec 12, 1991
ISIN
US0301112076
CUSIP
030111207
FIGI
BBG00ZVMW2W4
Identifiers
ISIN US0301112076
American Superconductor Corp. engages in the provision of megawatt-scale power solutions. Its products include electric control systems, generators & drivetrains, power converters, renewable interconnectivity solutions, software, turbine designs, utility and industrial resilience and modernization solutions, and utility voltage solutions. It operates through the Grid and Wind segments. The Grid segment enables electric utilities and renewable energy project developers to connect, transmit, and distribute power with efficiency, reliability, security, and affordability. The Wind segment permits the manufacturers to field wind turbines with power output, reliability, and affordability. The company was founded by Yet Ming Chiang, David A. Rudman, John B. Vander Sande, and Gregory J. Yurek on April 9, 1987 and is headquartered in Ayer, MA.
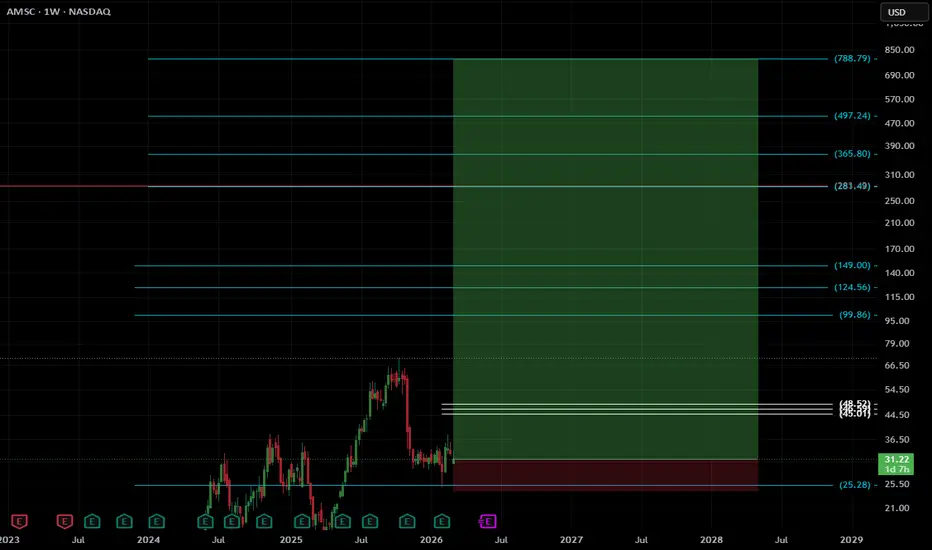
Confirmed Triple Bottom with >10x AheadConfirmed HTFs textbook triple bottom w/ a successfully re-tested neckline, a golden cross of its 2 weekly 50/200 EMAs. Volume picking up into the move more than it ever has since 1992.
Fundamentally, the company has been experiencing successful earnings over the last decade while bottoming and in
$AMSC , SetupENTRY : CMP
TP1 : 45.01
TP2 : 99.86
TP3 : 149
TP4 : 283.42
TP5 : LET IT ROLLLLLLLL
SL : If you wish
My SL is never a SELL, just an alarm to stop adding money and wait for better dca
Follow, Boost, Thank You !!
⚠️ Financial Disclaimer:
This post is not financial advice. I am not your financial
AMSC heads up at $63.00: Golden Genesis fib could HALT the surgeAMSC surged with the quantium computing sector.
It has just hist a Golden Genesis fib at $63.00 round.
Look for a Dip-to-Fib or Break-n-Retest for entries.
See the "Related Publications" for previous charts with 100% gains.
Hit BOOST and FOLLOW for more such PRECISE and TIMELY charts.
============
AMSC eyes on $40.18: Golden Genesis fib holding up new ATHAMSC has been bobbing into a Golden Genesis fib at $40.18
Look for a Break-n-Retest to start next leg of uptrend.
Beware of a possible rejection for a high velocity dip.
.
Previous Analysis that gave a PERFECT SWING trade:
Hit the BOOST and FOLLOW for more such a PRECISE and TIMELY charts.
====
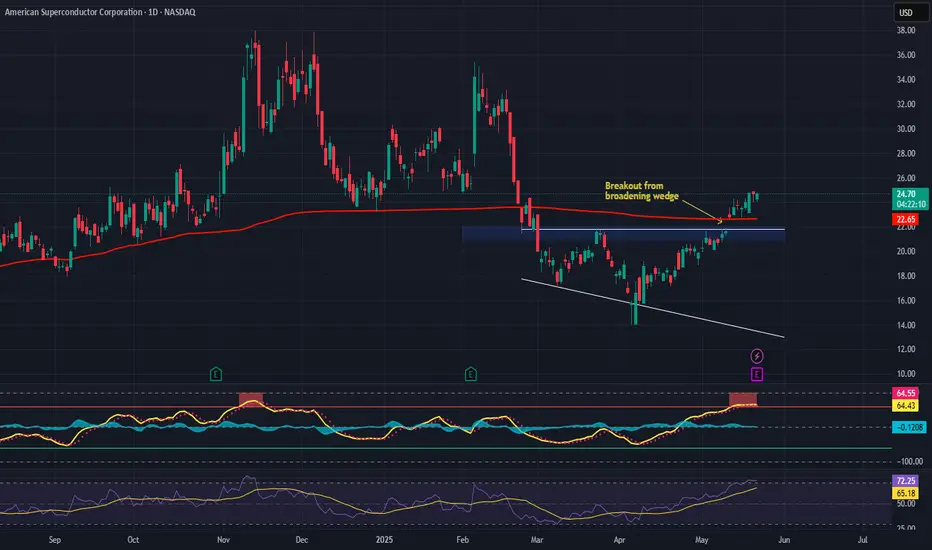
AMSC | Bullish Momentum Building Breakout in Progress?📈 NASDAQ:AMSC 🚀
American Superconductor (AMSC) is quietly showing strength, and it's time to pay attention. After bouncing off the support zone near $18.80–$19.30, the stock has reclaimed the $20.50–$21.10 entry range, with volume picking up as it challenges key resistance.
🧠 Why it's interesting
American Superconductor–Powering the Future of Energy & Defense Company Overview:
NASDAQ:AMSC is at the intersection of three megatrends: grid modernization, clean energy, and military innovation. With proprietary high-temperature superconducting (HTS) technology and a growing portfolio of energy and defense solutions, the company is moving from niche player t
AMSC – 30-Min Long Trade Setup !📈 🟢
🔹 Asset: American Superconductor Corp. (AMSC – NASDAQ)
🔹 Timeframe: 30-Min Chart
🔹 Setup Type: Symmetrical Triangle Breakout + Retest
📊 Trade Plan – Long Position
✅ Entry Zone: $18.17 (Breakout above triangle + reclaim of yellow level)
✅ Stop-Loss (SL): $17.40 (Below structure & rising trendlin
See all ideas
Summarizing what the indicators are suggesting.
Neutral
SellBuy
Strong sellStrong buy
Strong sellSellNeutralBuyStrong buy
Neutral
SellBuy
Strong sellStrong buy
Strong sellSellNeutralBuyStrong buy
Neutral
SellBuy
Strong sellStrong buy
Strong sellSellNeutralBuyStrong buy
An aggregate view of professional's ratings.
Neutral
SellBuy
Strong sellStrong buy
Strong sellSellNeutralBuyStrong buy
Neutral
SellBuy
Strong sellStrong buy
Strong sellSellNeutralBuyStrong buy
Neutral
SellBuy
Strong sellStrong buy
Strong sellSellNeutralBuyStrong buy
Displays a symbol's price movements over previous years to identify recurring trends.
Weight0.05%
Market value36.51 M
Weight0.17%
Market value19.07 M
Weight0.09%
Market value13.26 M
Weight0.06%
Market value11.26 M
Weight0.03%
Market value7.50 M
Weight0.19%
Market value4.91 M
Weight1.16%
Market value4.58 M
Weight2.13%
Market value4.45 M
Weight0.09%
Market value3.84 M
Weight0.29%
Market value3.73 M
Weight0.37%
Market value3.47 M
Explore more ETFs
Frequently asked questions
The current price of AMSC is 624.00 MXN — it hasn't changed in the past 24 hours. Watch American Superconductor Corporation stock price performance more closely on the chart.
Depending on the exchange, the stock ticker may vary. For instance, on BMV exchange American Superconductor Corporation stocks are traded under the ticker AMSC.
AMSC stock hasn't changed in a week, the month change is a −12.36% fall, over the last year American Superconductor Corporation has showed a 7.87% increase.
We've gathered analysts' opinions on American Superconductor Corporation future price: according to them, AMSC price has a max estimate of 1,238.88 MXN and a min estimate of 942.24 MXN. Watch AMSC chart and read a more detailed American Superconductor Corporation stock forecast: see what analysts think of American Superconductor Corporation and suggest that you do with its stocks.
AMSC reached its all-time high on Nov 5, 2025 with the price of 1,118.00 MXN, and its all-time low was 101.49 MXN and was reached on Jan 25, 2023. View more price dynamics on AMSC chart.
See other stocks reaching their highest and lowest prices.
AMSC stock is 0.00% volatile and has beta coefficient of −0.88. Track American Superconductor Corporation stock price on the chart and check out the list of the most volatile stocks — is American Superconductor Corporation there?
Today American Superconductor Corporation has the market capitalization of 25.91 B, it has decreased by −3.99% over the last week.
Yes, you can track American Superconductor Corporation financials in yearly and quarterly reports right on TradingView.
American Superconductor Corporation is going to release the next earnings report on Aug 5, 2026. Keep track of upcoming events with our Earnings Calendar.
AMSC earnings for the last quarter are 5.38 MXN per share, whereas the estimation was 3.32 MXN resulting in a 62.16% surprise. The estimated earnings for the next quarter are 3.54 MXN per share. See more details about American Superconductor Corporation earnings.
American Superconductor Corporation revenue for the last quarter amounts to 1.55 B MXN, despite the estimated figure of 1.47 B MXN. In the next quarter, revenue is expected to reach 1.53 B MXN.
AMSC net income for the last quarter is 81.22 M MXN, while the quarter before that showed 2.12 B MXN of net income which accounts for 0.00% change. Track more American Superconductor Corporation financial stats to get the full picture.
No, AMSC doesn't pay any dividends to its shareholders. But don't worry, we've prepared a list of high-dividend stocks for you.
As of Jul 25, 2026, the company has 1.2 K employees. See our rating of the largest employees — is American Superconductor Corporation on this list?
EBITDA measures a company's operating performance, its growth signifies an improvement in the efficiency of a company. American Superconductor Corporation EBITDA is 473.74 M MXN, and current EBITDA margin is 8.46%. See more stats in American Superconductor Corporation financial statements.
Like other stocks, AMSC shares are traded on stock exchanges, e.g. Nasdaq, Nyse, Euronext, and the easiest way to buy them is through an online stock broker. To do this, you need to open an account and follow a broker's procedures, then start trading. You can trade American Superconductor Corporation stock right from TradingView charts — choose your broker and connect to your account.
Investing in stocks requires a comprehensive research: you should carefully study all the available data, e.g. company's financials, related news, and its technical analysis. So American Superconductor Corporation technincal analysis shows the sell today, and its 1 week rating is strong sell. Since market conditions are prone to changes, it's worth looking a bit further into the future — according to the 1 month rating American Superconductor Corporation stock shows the sell signal. See more of American Superconductor Corporation technicals for a more comprehensive analysis.
If you're still not sure, try looking for inspiration in our curated watchlists.