BNB: Watching the $600 Breakout After Months of AccumulationThe biggest market moves rarely begin from overextended rallies.
They usually begin after long periods of consolidation, when volatility contracts and the market quietly transfers ownership from impatient traders to stronger hands.
That is exactly what has caught my attention on BNB.
After several months of sideways price action, the market is now approaching one of the most important resistance levels on the chart.
For me, the opportunity doesn't come from buying inside the range.
It comes from buying **only after a confirmed breakout above $600.**
---
## The Importance of the Accumulation Phase
Since the sharp correction earlier this year, BNB has spent months trading inside a relatively tight range.
Rather than continuing lower, price stabilized and repeatedly found buyers around the same region.
This type of behavior often represents accumulation rather than continuation of the previous downtrend.
Markets rarely transition directly from bearish trends into powerful bull markets.
Accumulation usually comes first.
Momentum comes later.
---
## Why $600 Matters
The **$600** level is much more than a psychological number.
It represents the upper boundary of the current accumulation range and the level where sellers have repeatedly regained control.
A breakout above this area would completely change the short-term market structure.
Instead of producing lower highs, BNB would begin printing higher highs for the first time since the correction began.
That is the confirmation I'm waiting for.
---
## Buying Confirmation Instead of Prediction
I'm not interested in predicting breakouts.
I'm interested in trading confirmed strength.
For me, confirmation means:
- A decisive weekly close above **$600**.
- Buyers holding that level during a pullback.
- Increasing trading volume.
- Acceptance above the previous range.
If those conditions develop, the probability of trend continuation increases significantly.
Until then, patience remains part of the strategy.
---
## Market Structure
Looking at the broader picture, BNB continues to trade above one of the strongest historical support regions on the chart.
The market has already absorbed months of selling pressure without producing new significant lows.
That behavior suggests supply may gradually be drying up.
Now the market only needs a catalyst strong enough to push price beyond resistance.
---
## Risk vs. Reward
This is what makes the setup attractive.
Waiting for confirmation allows risk to remain relatively small.
Once price breaks above **$600**, my invalidation can remain just below the breakout level.
Meanwhile, the upside extends toward the next major resistance around **$900**, offering a reward that is several times greater than the predefined risk.
This is exactly the type of asymmetric opportunity I look for.
---
## What Needs to Happen Next?
For the bullish thesis to gain credibility, I would like to see:
- A weekly close above **$600**.
- Strong buying volume accompanying the breakout.
- A successful retest of $600 as new support.
- Higher highs and higher lows.
- Continuation toward the next major resistance around **$900**.
If those conditions unfold, the current accumulation may simply become the foundation for the next major trend.
---
## What Invalidates This Idea?
This is not a blind buying opportunity.
If BNB fails to reclaim **$600** or quickly falls back below the breakout level after briefly exceeding it, my bullish thesis becomes invalid.
False breakouts are common.
That's why confirmation always comes before commitment.
---
## Final Thoughts
The strongest trends often begin quietly.
Not when everyone is excited, but when the market has spent months moving sideways while most participants lose interest.
BNB appears to be approaching one of those moments.
The accumulation phase may already be complete.
Now the market has one job:
**Prove that buyers are strong enough to reclaim $600.**
If that happens, I believe the next impulsive leg could already be underway.
Until then, I'm simply waiting for confirmation.
---
*This publication reflects my personal interpretation of the current market structure and should not be considered financial advice. Always conduct your own research before making investment decisions.*
---
### What do you think?
**Will BNB finally break above $600 and begin a new expansion phase, or will sellers defend the range once again?**
I'd love to hear your perspective in the comments.
In-depth trading ideas
BNB/USD Buy-the-Dip Setup | Bulls Eye Key Resistance at $630💰🔥 BNB/USD — "THE VAULT TOKEN vs U.S. DOLLAR" 🔥💰
Capital Flow Blueprint Plan | Day/Swing Trade | Thief Trader Edition 🕵️♂️📊
⚠️ Correction Note: Original draft mislabeled this pair as "Ethereum vs U.S. Dollar." BNB (Binance Coin) is a distinct asset from ETH — corrected below. ✅
━━━━━━━━━━━━━━━━━━━━━━━━━━━━━━━━━━━━━━
🎯 THE PLAN — Bullish Blueprint
Setup: Bullish continuation confirmed via smooth moving average pullback structure 📈
Vault Entry Zone: Flexible — any price level within current structure works for entry 🔓
💹 GETAWAY POINTS (Profit Targets)
🏁 Scalper/Day Trader TP1: @ 610.00
🏁 Scalper/Day Trader TP2: @ 620.00
🏆 FINAL VAULT TARGET: @ 630.00
🚨 Police Barricade Zone Ahead: The 630.00 area is stacked with resistance + overbought signals + classic trap/reversal risk. If you're in profit near this zone — escape the vault before the alarm goes off. 🚔💸
Dear Ladies & Gentlemen — Thief OG's 🎩: I'm not dictating your TP. Your getaway, your call. Make money, then TAKE the money. Risk is yours to own. 🙏
━━━━━━━━━━━━━━━━━━━━━━━━━━━━━━━━━━━━━━
🛑 THIEF SL (Stop Loss)
Thief SL @ 570.00
Dear Ladies & Gentlemen — Thief OG's 🎩: I'm not dictating your SL either. Set your own exit based on your own risk tolerance. This is a reference point, not a rulebook. 🙏
━━━━━━━━━━━━━━━━━━━━━━━━━━━━━━━━━━━━━━
🔗 CORRELATED PAIRS TO WATCH
₿ BITSTAMP:BTCUSD — BNB moves in the same risk-on/risk-off current as Bitcoin. A BTC breakdown drags BNB with it; BTC strength usually lifts the whole exchange-token complex.
Ξ BITSTAMP:ETHUSD — The other major smart-contract heavyweight. ETH and BNB often move together as "large-cap alt beta" — watch for divergence as an early warning signal.
◎ BINANCE:SOLUSDT — High-beta alt correlation. When SOL outperforms, it often signals broader alt-season risk appetite that BNB also benefits from.
💵 TVC:DXY (US Dollar Index) — Inverse correlation. A weakening DXY tends to support crypto risk assets including BNB; a strengthening dollar caps upside.
━━━━━━━━━━━━━━━━━━━━━━━━━━━━━━━━━━━━━━
📰 FUNDAMENTAL & MACRO FACTORS (Neutral — What the Market Is Actually Showing)
🏛️ Institutional Angle: Grayscale and VanEck have both filed amended SEC paperwork for spot BNB ETFs, signaling sustained institutional interest in regulated BNB exposure.
📊 Index Inclusion: BNB was just ranked #2 of 18 constituents in a new S&P Dow Jones Indices / Pantera Capital digital-asset index that screens assets by protocol revenue rather than market cap alone — a fundamental strength signal for the BNB Chain ecosystem.
⚙️ On-Chain Growth: Token Terminal data shows global stablecoin holders across smart-contract platforms hit 289.0M, up 54.5% year-over-year — a broad tailwind for chain activity across ecosystems including BNB Chain.
📉 Derivatives Positioning: Recent 24H liquidation data (CoinGlass) showed short positions absorbing significantly more losses than longs, suggesting short-side pressure has been building into recent price action. This is positioning data, not a directional guarantee.
⚖️ Headline Risk: BNB Chain is pursuing legal action against a former employee accused of misusing wallet access tied to a memecoin launch. Isolated governance/security headline — company has distanced itself and is cooperating with authorities. Limited direct fundamental impact so far.
━━━━━━━━━━━━━━━━━━━━━━━━━━━━━━━━━━━━━━
🗓️ UPCOMING HIGH-IMPACT ECONOMIC CALENDAR (London Time — Week of 10–16 Aug 2026)
🇺🇸 US Retail Sales — later in the week, week of Aug 10–16
🇩🇪 German Economic Data — week of Aug 10–16
🇦🇺 RBA Rate Decision — week of Aug 10–16
🇬🇧 UK Economic Data — week of Aug 10–16
🇳🇿 New Zealand Data — week of Aug 10–16
🌍 Ongoing Middle East geopolitical developments — monitor for risk-sentiment spillover into crypto
⏰ Exact release times weren't pinned to the minute in available sources — confirm precise London-time slots on your calendar provider closer to release, since these are high-impact, volatility-triggering events for risk assets including crypto.
━━━━━━━━━━━━━━━━━━━━━━━━━━━━━━━━━━━━━━
🕵️♂️ THIEF TRADER WISDOM
"A real thief doesn't chase the vault — he waits for the vault to open." 🔓
"Plan the heist. Manage the risk. Escape with the bag." 💰
"The market pays patience, not panic." ⏳
Stay sharp, Thief OG's. Protect your capital like it's the last bag in the vault. 🛡️💹
BNB: The Trend Still Looks Bearish… But the Market Is ChangingAt first glance, BNB still appears firmly trapped beneath long-term trend resistance. The descending trendline and sequence of lower highs continue to favour sellers, making the broader structure difficult to challenge.
Yet there is one detail that deserves more attention.
Each bearish impulse over the past several weeks has delivered less downside progress than the one before. Sellers continue to defend resistance, but they are no longer extending the trend with the same efficiency. That doesn't confirm a reversal, though it often marks the stage where a mature trend begins to lose momentum.
The broader market narrative has also become more constructive. BNB benefits from renewed activity across the Binance ecosystem, while improving sentiment toward digital assets has reduced the impact of negative headlines that previously drove sharp declines. Markets often change character when price becomes less sensitive to bad news and more responsive to underlying participation.
For now, buyers have not regained control. The primary trend remains bearish until the descending resistance is broken and the sequence of lower highs is invalidated.
My primary scenario is a continuation toward trend resistance, where buyers will face their first meaningful test. A decisive breakout would suggest the market is transitioning from correction to recovery. If support gives way instead, sellers would likely regain momentum and reinforce the existing downtrend.
The trend has not reversed.
But it may no longer be as strong as it appears at first glance.
BNB Pinned Between 570 & 585: The Break 591-562▪️ BNBUSD H1 SNAPSHOT — EXECUTIVE SUMMARY
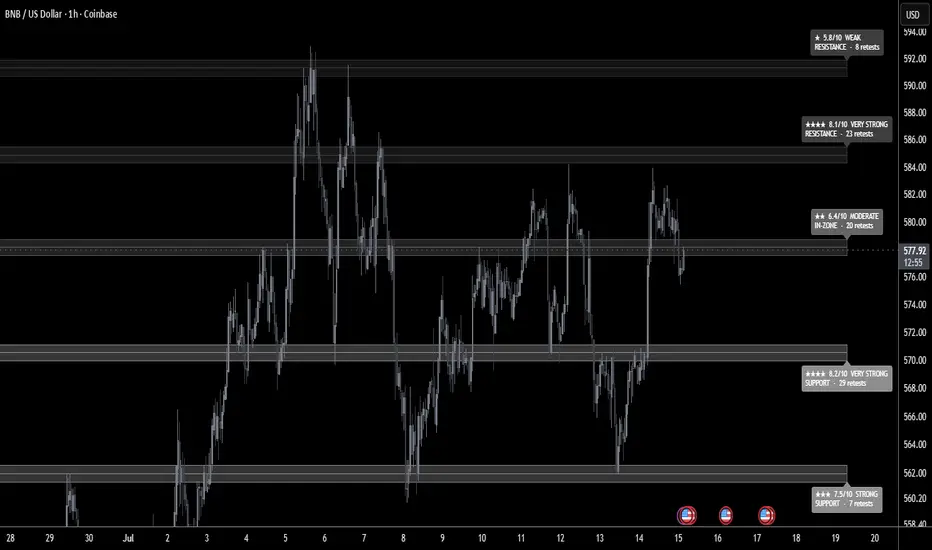
▪️ BNB is coiling in the middle of its range near 577.75, capped by overhead supply and holding above a defended demand shelf. Structure is consolidating, squeezed between a strong floor and a stacked ceiling.
▪️ Primary outlook is neutral — the reaction at 570.50 is the key tell. While sellers defend above, rallies stay vulnerable; a reclaim shifts the bias bullish, while losing 570.50 tilts momentum lower.
▪️ Key resistance zone: 585.00, where sellers have leaned 23 times and are expected to defend again on first test. Beyond it, 591.50 is the next hurdle.
▪️ Major defense line: 570.50 — a very strong level at 29 retests. Holding here keeps the range intact; a decisive break below opens a deeper corrective leg.
▪️ Primary downside targets: 562.00, where liquidity and demand are stacked.
▪️ Major liquidity magnet below: 570.50–562.00 — this zone could trigger a strong bounce or reversal once tested.
▪️ Bullish scenario: A daily close back above 585.00 re-opens the topside toward 591.50.
▪️ KEY LEVELS
RESISTANCE
▪️ 591.50 — ★ 5.8 Weak · 8 retests
▪️ 585.00 — ★★★★ 8.1 Very Strong · 23 retests
▪️ Current Price: 577.75
SUPPORT
▪️ 570.50 — ★★★★ 8.2 Very Strong · 29 retests
▪️ 562.00 — ★★★ 7.5 Strong · 7 retests
▪️ ProjectSyndicate Levels Desk — Overview of key S/R zones for BNBUSD, BTCUSD, NVDA, NQ, ES & GC traders every week. Subscribe to stay up to date with the latest levels.
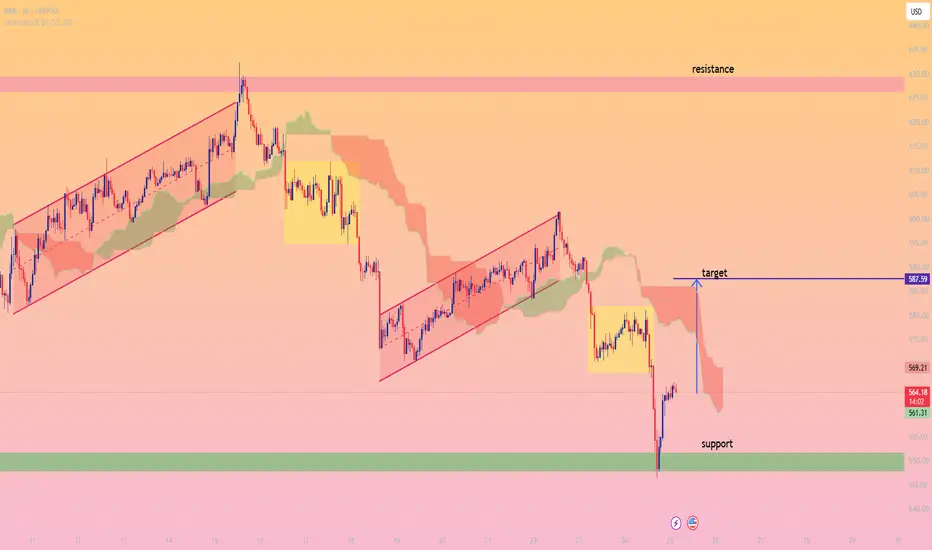
BNB/USD Bullish Rebound from Key SupportBNB/USD has experienced a sharp sell-off after breaking below a consolidation range and falling into a major support zone around **$550**. The strong bullish reaction from this support suggests buyers are defending the area, increasing the probability of a short-term recovery.
Price is currently attempting to reclaim levels above the Ichimoku cloud base after bouncing from support. If bullish momentum continues, BNB could target the nearby resistance zone at **$587.50–$590.00**, which aligns with previous support-turned-resistance and the lower edge of the cloud.
A successful break above this target could open the door for further upside toward higher resistance levels, while failure to hold above **$550** may expose BNB to another leg lower.
🎯 **Target:** **$587.59**
🛡️ **Support:** **$550.00**
🚧 **Resistance:** **$587.59 – $590.00**
📈 **Bias:** Bullish Recovery / Short-Term Rebound
BNB 1D/1W Analysis!!!Looking Bnb for taking the below pending liquidity.
if given a berish pattern confirmation here on 2hr/4hr then can take a swing downside. it can also test above line before falling so its just an analysis which can give good returns over the time.
Waiting for heavy confirmations before taking any step as its against the trend on lower timeframe.
all updates will be shared on notes.
BNBUSD – Daily Timeframe Technical AnalysisBNBUSD – Daily Timeframe Technical Analysis
Price has printed a Lower Low (LL) after breaking the previous swing low, confirming that the broader market structure remains bearish.
However, the latest bullish impulse from the LL shows strong buying momentum, pushing price back into the previous supply/resistance zone near the Lower High (LH).
Key observations:
✅ Market structure: Bearish (LL still intact).
✅ Current move: Bullish retracement within a bearish trend.
⚠️ Price is approaching a critical resistance area around 590–605.
📌 A rejection from this zone could create the next Lower High, increasing the probability of another bearish continuation toward the recent lows.
📈 If buyers manage to break and close above 605, it would weaken the bearish structure and open the door for a potential trend reversal.
Trading idea: I'm watching for bearish confirmation at resistance rather than chasing the current rally. Patience is key—let price reveal its intention before committing to a position.
Key Levels
Resistance: 590–605
Support: 540–550
Always wait for confirmation and manage risk accordingly. This is not financial advice.
# BNB 4H Chart: The Correction Continues — But Which Scenario Wi# BNB 4H Chart: The Correction Continues — But Which Scenario Will Prevail?
Following the two primary scenarios discussed on the daily timeframe, the 4-hour chart offers a closer look at the internal structure of BNB's ongoing correction.
## Aggressive Scenario: Wave (IV) Still in Progress
The current decline continues to support the view that **wave (IV)** has not yet completed. The recent break below the corrective channel strengthens the probability that the market is developing the final stages of a **double zigzag (W-X-Y)** correction.
Within this scenario, the current decline appears to be unfolding as the final leg of **wave Y**, where the internal five-wave structure is gradually taking shape. If this interpretation remains valid, the correction could extend toward the projected Fibonacci support zone between **$430 and $355** before establishing a higher-degree bottom.
Completion of wave (IV) would then create the foundation for the beginning of **wave (V)**, potentially initiating the next impulsive advance of the larger bullish cycle.
## Conservative Scenario: Wave A of a Larger Degree Wave II
The conservative outlook remains unchanged.
Rather than completing wave (IV), the market may be building the first leg (**wave A**) of a much larger **wave II** correction. Under this interpretation, the current impulsive decline would eventually be followed by a corrective **wave B** recovery before another **wave C** decline completes the larger corrective cycle.
This scenario continues to favor a prolonged corrective environment before the long-term uptrend resumes.
## Key Levels to Monitor
A sustained recovery above the highlighted invalidation levels would begin to weaken the bearish outlook, while continued rejection below these zones keeps both corrective scenarios active.
Until price proves otherwise, the larger picture continues to favor patience over prediction.
**The market has already chosen correction. What remains uncertain is only its degree.**
*Patterns whisper. I listen.* – **Mr. Nobody** 🎧📊
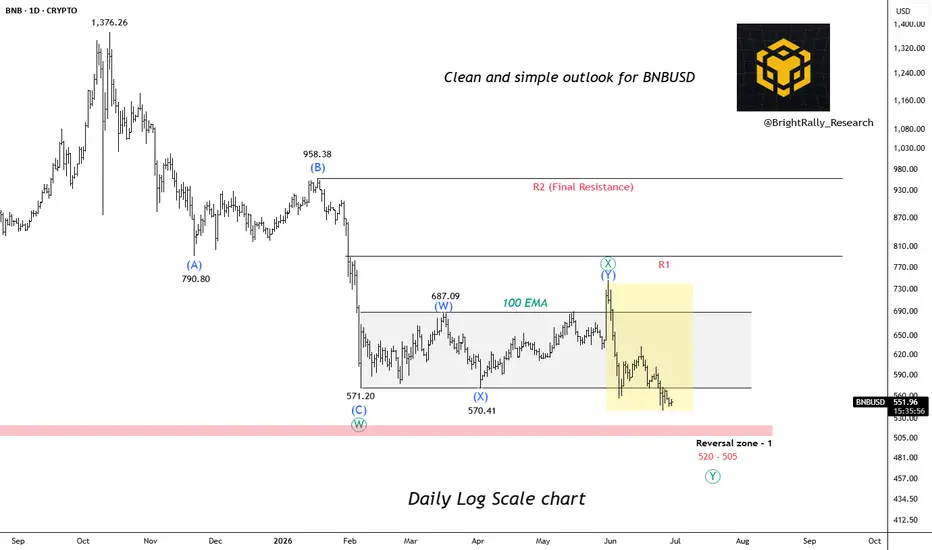
BNBUSD Could Be Setting Up for Another Heavy FlushBNB is still trading inside a broad range on the daily chart, but the overall structure continues to look weak. Price has been struggling to break above the 100 EMA , and every recovery attempt is getting sold into before a real breakout can happen. The recent bounce from the $570 area was decent, but buyers still failed to build strong momentum above resistance.
Right now, BNB is sitting near the top of the local range, which makes this area important. If the price gets rejected here again and starts losing strength, it would keep the bearish structure active. The chart also shows that the market has been making lower highs since the bigger decline started, which usually points toward sellers staying in control.
The key level to watch is $610 . As long as BNB stays below that zone, the downside outlook remains valid. A rejection from the current area could send the price back toward $570 first.
If selling pressure increases below that support, the next downside targets come in around $480 and $450 . Until BNB clearly reclaims the major resistance zone, the chart still leans bearish overall.
We will update further information soon.
@BrightRally_Research
Wave (IV) Correction or the Beginning of a Larger Degree Wave II# BNB Daily Chart: Wave (IV) Correction or the Beginning of a Larger Degree Wave II?
Following the two primary scenarios presented on the weekly chart, the daily timeframe provides a clearer perspective on the current corrective structure developing in BNB.
## Aggressive Scenario: Development of Wave (IV)
Under the aggressive Elliott Wave interpretation, the decline from the recent high is considered part of an ongoing **wave (IV)** correction following the completion of wave **(III)**. The proportional relationship between the previous impulsive waves continues to support this interpretation.
At present, wave (IV) appears to be evolving as a **complex double zigzag correction (W-X-Y)**. The recent breakdown below the terminal channel reinforces the possibility that the correction has not yet been completed and may continue toward deeper Fibonacci retracement levels before establishing a significant bottom.
If this scenario remains valid, the completion of wave (IV) would pave the way for the beginning of **wave (V)**. Historically, final impulsive waves within mature bullish cycles can become highly extended, suggesting that the next upward expansion may exceed the magnitude of both previous impulsive advances.
## Conservative Scenario: The Beginning of a Larger Corrective Cycle
The conservative interpretation continues to favor the existence of two completed **1-2 and 1-2 sequences**, implying that the market is developing a larger degree **(I)-(II)** structure.
From this perspective, the current decline may represent only the initial phase of a larger corrective process. The ongoing decline from the all-time high would therefore be labeled as **wave A**, which could later be followed by a corrective **wave B** rally and a subsequent **wave C** decline to complete the larger degree **wave II** correction.
This interpretation allows for a substantially larger corrective structure, potentially developing either as a multiple zigzag formation or as a broader zigzag correction spanning several market cycles.
## Key Observation
The breakdown of the terminal channel and the current price behavior suggest that the market remains in a corrective environment. However, whether this correction belongs to a developing **wave (IV)** or to a much larger degree **wave II** remains the critical question.
As always, Elliott Wave analysis is not about predicting a predetermined future. It is about recognizing the structure the market chooses to reveal and adapting as evidence unfolds.
**Sometimes the market whispers two different futures at the same time. The challenge is learning which whisper becomes reality.**
– Patterns whisper. I listen. – Mr. Nobody 🎧📊
Binance Coin
1 hour ago
# BNB: When Two Cycles Whisper Different Futures
# BNB: When Two Cycles Whisper Different Futures # BNB: When Two Cycles Whisper Different Futures | Elliott Wave Weekly Analysis
The current BNB weekly structure presents two valid Elliott Wave interpretations, each suggesting a significantly different long-term path while remaining fully consistent with Elliott Wave principles.
### Aggressive Scenario: Wave (IV) in Progress
Under the aggressive interpretation, the recent decline is viewed as the development of **wave (IV)** following the completion of **wave (III)**. One of the strongest arguments supporting this scenario is the proportional relationship between **waves (I) and (III)**, which often serves as an important guideline for identifying impulsive structures.
If this count proves correct, the market is currently developing a deep corrective phase that may evolve into a **multiple zigzag correction**. Such corrections frequently extend further than initially anticipated before exhausting themselves near key structural and Fibonacci support zones.
Upon completion of wave (IV), the market would be expected to begin **wave (V)**. Given the characteristics of late-stage bullish cycles, there remains a strong possibility that wave (V) could extend beyond the magnitude of both previous impulsive waves, creating a final expansion phase before the completion of the larger degree cycle.
### Conservative Scenario: Nested 1-2 Structures
The conservative interpretation proposes a more complex but equally valid Elliott Wave structure. In this scenario, the market has already completed two consecutive **1-2 and 1-2 cycles**, effectively forming two complete eight-wave sequences across multiple degrees.
Under this interpretation, BNB is currently developing a larger degree **(I)-(II)** cycle while simultaneously completing a secondary **I-II** sequence. The ongoing correction may therefore evolve either as a **multiple zigzag structure** or as part of a much larger corrective zigzag formation.
From this perspective, the decline from the all-time high to current market levels would represent only **wave A** of the larger correction. This would eventually be followed by a counter-trend **wave B** rally and a final **wave C** decline, completing the larger degree **wave II** correction before the next major impulsive cycle begins.
### Final Thoughts
At this stage, both scenarios remain technically valid within the Elliott Wave framework. The aggressive scenario anticipates the completion of a major fourth wave before a final bullish expansion, while the conservative scenario suggests that the market is still engaged in building a much larger corrective structure.
As always, the objective is not to predict what the market must do, but to identify the patterns it is currently revealing and adapt as new information emerges.
**The market never speaks loudly. It whispers through patterns.**
– Patterns whisper. I listen. – Mr. Nobody 🎧📊
BNBUSD: Already Captured 206 points, What's next?In the previous article, we successfully projected a 206 -point fall, or -27% .
Click here:
The wave count shows a slight change on the chart. BNB is below the lower band of the parallel channel. We can expect reversal zone 1, from which demand can take place. Unless it doesn't seem favourable to take a falling knife, unless price reverses into the channel again.
We will update further information soon.
By @BrightRally_Research
Binance Coin - A wonderful break and retest!🏅Binance Coin ( CRYPTO:BNBUSD ) creates a textbook pattern:
🔎Analysis summary:
For roughly six years, Binance Coin has been moving completely sideways. But during this time, you were also able to catch obvious rallied of +550% and +150%. With the current all time high break and retest, Binance Coin is now setting up for another parabolic bullrun.
📝Levels to watch:
$600
Keep your #LONGTERMVISION🙏
— Phil (@TheTraderPhil)
BNB: Is History Repeating? Next Stop $200?At first glance, BNB continues to look stronger than most altcoins.
However, that strength may be exactly what keeps investors optimistic while the market builds a very different setup.
Looking at the long-term chart, the current structure shares several similarities with the pattern that developed around 2019–2020.
Back then, BNB spent a long period consolidating within a contracting formation before eventually breaking out and beginning a major trend.
Today, a different but equally important structure appears to be developing.
After forming a large rising wedge, price broke below the lower boundary and produced a strong impulsive decline. Instead of recovering immediately, BNB entered a consolidation phase directly beneath former support.
This type of price action is often seen before trend continuation.
Rather than signaling accumulation, the current range may represent a pause following the initial breakdown.
As long as price remains below the broken structure, the risk of another leg lower remains elevated.
From a technical perspective, the $200 area stands out as one of the most important long-term support zones and could become a major downside target if sellers regain momentum.
What makes this setup interesting is the psychology behind it.
Many investors still view BNB as one of the strongest assets in the crypto market.
Markets, however, rarely move in the direction that benefits the majority.
The key idea is not that BNB must fall to $200.
The key idea is that the current consolidation may be preparing for continuation lower rather than a new bullish impulse.
Not financial advice.
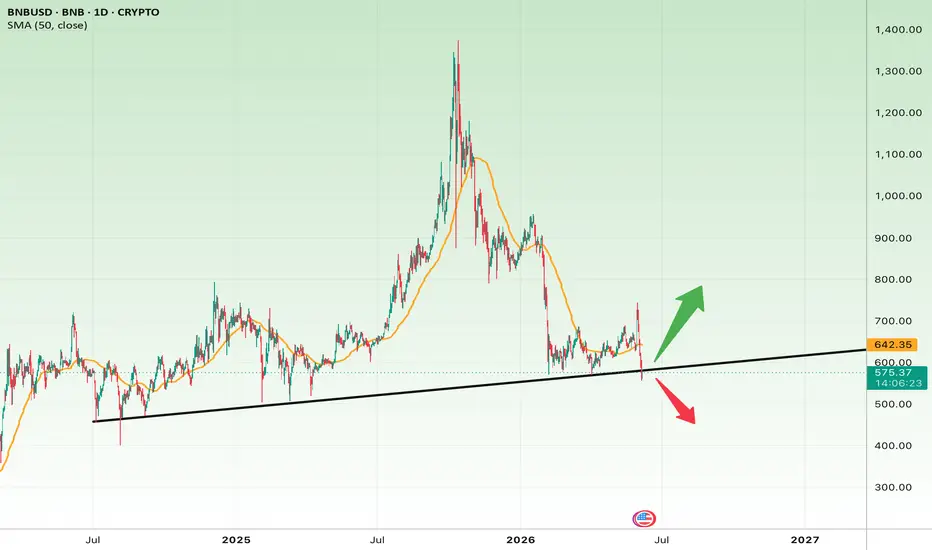
BNB at a Long-Term Trendline TestBNB is currently sitting on a major ascending trendline that has supported the market for months. This area around $560–580 is a critical decision zone and will likely determine the next major move.
Short-Term Outlook
As long as price holds above $560, the bullish scenario remains valid.
Targets: $650 → $700 → $780
Stop-loss: Below $550
Long-Term Outlook
The long-term structure remains bullish while the ascending trendline is intact.
A successful rebound from current levels could start the next upward leg.
Targets: $800 → $1,000 → $1,200
Stop-loss: Weekly close below $520
Summary
BNB is testing a major long-term support trendline near $560–580. If buyers defend this zone, the market could rebound toward $700+ and potentially revisit higher levels over time. However, a confirmed breakdown below the trendline would weaken the bullish structure and increase the risk of a deeper correction toward the $450–500 area.
BNB Price PredictionsBNB (Binance Coin) wasn't always a top-tier cryptocurrency used for smart contracts. Its journey began in 2017 with a very simple purpose.
The Beginning (2017): BNB was launched as an ERC-20 token on the Ethereum blockchain before its own mainnet launched. Its primary function was to be a utility token for the newly created Binance Exchange, offering users a discount on trading fees when they used it to pay for transactions.
The Shift to Binance Chain (2019): Binance launched its own blockchain, Binance Chain. BNB was moved from Ethereum to this new ecosystem, marking a significant step toward independence.
The Explosion of BSC (2020-2021): The launch of Binance Smart Chain (BSC) was a game-changer. BSC offered faster and cheaper transactions than Ethereum, attracting a massive wave of developers and users to its DeFi (Decentralized Finance) and NFT projects. This dramatically increased the demand for BNB, which is used to pay for all transaction fees (gas) on the BSC network.
The Token Burn Mechanism: A crucial part of BNB's value proposition is its token burn plan. Binance commits to using a portion of its profits to buy back and permanently destroy (burn) BNB tokens, with the goal of removing 50% of the total supply from circulation. In April 2026 alone, over $636 million worth of BNB was burned. This reduces supply and can contribute to long-term price appreciation.
BNB SCENARIO
1. What I Am Seeing
The Impulsive Leg : A massive, vertical bullish expansion that broke above historical key highs (indicated by the horizontal green line), leaving behind a significant market imbalance.
The Current Pullback : Price is undergoing a steep, corrective descent back to the origin of the move without any major structural counter-trend development so far.
The Premium/Discount Zone : Price has just tapped into the Golden zone, sitting precisely between the two yellow horizontal lines which mark my $70.5\%$ to $91\%$ Fibonacci retracement levels. We are officially deep in the institutional Discount Area. And in the same area of the golden zone we can see a lot of wicks, for their previous accumulation.
2 Why It Matters
The Spring Compressing : This retracement isn't a market crash; it is a mechanical necessity following the explosive rally. The market has completely flushed out late retail buyers (FOMO) and is hunting for deep, high-probability liquidity.
Ultimate Structure Test : The $70.5\% - 91\%$ zone represents a deep discount pivot area. This is where institutional players who missed the initial move look to heavily reload positions at an optimal wholesale price. If this zone holds, the HTF (Higher Time Frame) bullish bias remains valid. If it fails, the bullish narrative is completely invalidated.
3 What I Expect Next
The Ideal Scenario : An accumulation phase or a sharp rejection (a significant weekly wick) inside this $70.5\% - 91\%$ pocket. I am looking for the selling pressure to dry up, confirming that the "spring" is fully compressed and ready to expand back toward the top of the blue box (recent highs, $0\%$ Fibo), followed by further extensions.
Invalidation : A clean weekly candle close below the $91\%$ Fibonacci level (the lower yellow line / bottom of the grey box) will completely invalidate this setup, opening the doors for a full retracement back to the absolute origin of the move (lower black line).
Binance Coin Wave Analysis – 8 June 2026 - Binance Coin reversed from strong support level 575.50
- Likely to rise to resistance level 650.00
Binance Coin cryptocurrency recently reversed up from the strong support level 575.50 (which has been steadily reversing the price from February, ad can be seen on the daily Binance Coin chart below).
The upward reversal from this support zone created the daily Japanese candlesticks reversal pattern Morning Star Doji.
Given the strength of the support level 575.50 and the oversold daily Stochastic, Binance Coin cryptocurrency can be expected to rise to the next resistance level 650.00.
BNB | Day Chart | June Q2 26'Zoom out.
Along the top of the screen you'll notice Yr26' & 27' marked by vertical black lines. Between them are Quarters of the year.
Portfolio rebalancing happens at 25% events or at time intervals like Day, Week, month, quarter, or annual intervals - These time horizons are different for each investor and is a large reason why so many bicker in chat groups. What goes down on your timeframe as bearish is a bullish signal for another timeframe.
adding quarters to the X-Axis of time with vertical lines naturally frames price action between support and resistance. Fractally, the picture becomes clear as the T.A. illustrates the story.
----------------------------------
Multiple Time-Frame Analysis; Color Code | Strength favors the higher timeframe.
Yearly timeframe = black
Monthly timeframe = pink
weekly = grey
daily = red
4hr = orange
1hr = yellow
15min = blue
5min = green if they are shown. (Level visibility on intervals is set to timeframe the level was found on and below to keep chart view organized.)
BNB at a Critical Crossroads: Breakout or Breakdown?Based on the daily chart you shared, BNB is currently testing a major long-term ascending trendline that has acted as support for years. Price is trading around $581, while the 50-day SMA is near $642, meaning the market is still below an important short-term trend indicator.
Short-Term Analysis
BNB is sitting in a key decision zone.
Bullish Scenario
The long-term trendline remains intact, and buyers appear to be defending the support area. If price can reclaim and hold above $600, followed by a breakout above the $640–650 resistance zone, bullish momentum could accelerate.
Targets:
Target 1: $640
Target 2: $700
Target 3: $760–780
Stop Loss:
Daily close below $560
Bearish Scenario
A confirmed breakdown below the ascending trendline and a daily close under $560 would weaken the bullish structure and likely trigger further selling pressure.
Downside Targets:
$520
$480
$430
Bearish Invalidation (Stop Loss for Shorts):
Daily close back above $610
Medium- to Long-Term Analysis
From a broader perspective, BNB's multi-year uptrend is still technically intact. The trendline shown on the chart has been respected multiple times in the past, making the current test highly significant.
As long as this support remains valid, the recent decline can be viewed as a correction within a larger bullish structure rather than a full trend reversal.
Long-Term Bullish Scenario
If the support holds and BNB successfully breaks above $700, the market could enter a stronger recovery phase.
Long-Term Targets:
$800
$950
$1,100
In a strong bull market, a retest of the previous all-time high near $1,300
Investment Stop Loss:
Weekly close below $540
Long-Term Bearish Scenario
If the multi-year trendline is decisively broken, the long-term bullish structure would be damaged and deeper downside becomes likely.
Bearish Targets:
$500
$450
$380
$320
Professional Summary
The $560–600 zone is currently the most important area on the chart. As long as BNB holds above the long-term ascending trendline, the probability favors a move toward $640 and potentially $700+. However, a confirmed breakdown below $560 would significantly increase the risk of a deeper correction.
From a risk-to-reward perspective, long positions near the current support area can be attractive only if strict risk management is applied, with a stop below the support zone. If the trendline holds, the upside potential toward $700–800 offers a favorable reward relative to the risk.
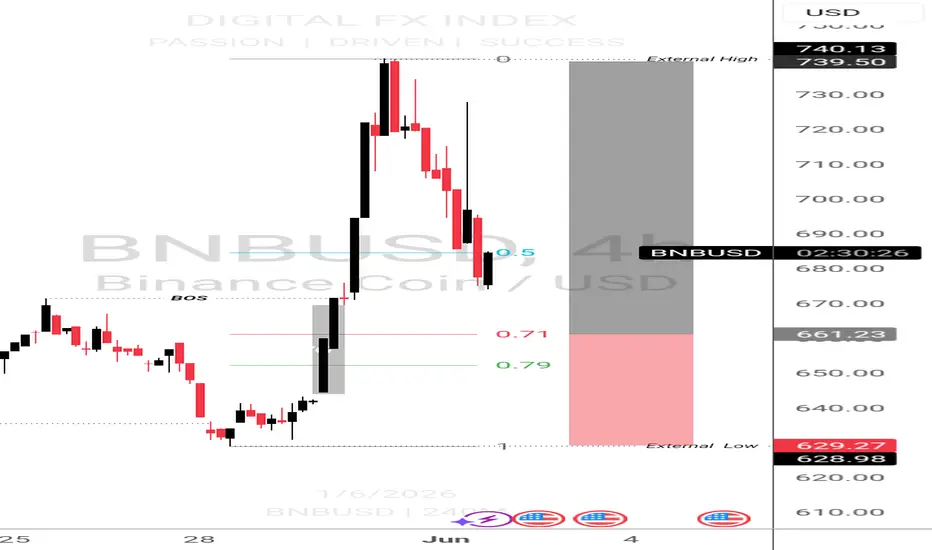
BNBUSD Bullish 📊 Market: BNBUSD
⏰ Timeframe: H4
🎯 Strategy: Smart Money Concepts (SMC)
Market Overview
Following a strong bullish displacement that broke market structure (BOS), price aggressively expanded into premium territory and swept the external high liquidity.
After taking buy-side liquidity, the market showed signs of weakness and delivered a bearish reaction from the premium zone, suggesting that smart money may be distributing positions before seeking lower prices.
Key SMC Confluences
✅ Break of Structure (BOS) to the upside
✅ External High Liquidity Taken
✅ Premium Market Conditions
✅ Bearish Reaction from Premium Zone
✅ Potential Retracement into Discount Levels
Trading Bias
📉 Short-Term Bias: Bearish
As long as price remains below the external high, I expect a continuation lower toward the discount area and potentially the external low liquidity.
Important Levels
🔹 External High: 739.50
🔹 0.5 Equilibrium: 685.00
🔹 External Low: 629.27
Trade Idea
A confirmed bearish market structure shift on lower timeframes could provide short opportunities targeting the discount zone and external low liquidity.
⚠️ This analysis is for educational purposes only and does not constitute financial advice. Always manage risk appropriately
BINANCE COIN (BNBUSD)The asset I’m most bullish on right now: BNB.
BNB has been structurally deflationary for years through its burn mechanisms, while price continues to hold major support levels.
What stands out to me is the shrinking volume while price remains elevated. That suggests sellers are drying up, and IF demand returns, price impact could become much more aggressive.
This is not just another exchange token anymore. It is increasingly behaving like a deflationary ecosystem reserve asset: limited supply, strong utility, and a burn model that keeps reducing float over time.
I already bought some and I’m keeping this one high on my watchlist. A move toward new ATHs in the coming months would not surprise me.