BNB: Bears Still Control the Bigger PictureFormer support becomes resistance
BNB continues to struggle beneath the $580 area, with this former support zone now acting as key resistance. Each rally into this region has attracted renewed selling pressure.
Moving averages remain bearish
The 100/50-day EMAs remain bearishly crossed, with price continuing to trade below both moving averages. Until this changes, the primary trend continues to favour the bears.
Momentum remains neutral
RSI is chopping around the 50 level, reflecting the current lack of direction. Meanwhile, StochRSI is climbing from mid-range, suggesting momentum is improving but has yet to become decisive.
Support remains important
The first level of support sits around $555.59, while a break below this level would increase the risk of another move towards the significant low at $537.25.
Bulls need to reclaim $580
A convincing break and close above $580 would be the first encouraging sign that momentum is shifting. Until then, rallies are likely to continue running into overhead resistance.
In Summary
BNB remains under pressure as price continues to trade below bearishly crossed 100/50-day EMAs and struggles beneath the important $580 resistance zone. Although momentum is broadly neutral, bulls have yet to regain control of the chart. Unless $580 is reclaimed, the risk remains skewed towards another test of $555.59 support, with a break below exposing the recent low around $537.25.
In-depth trading ideas
BNB/USDT: Buyers Defend SupportBNB/USDT is currently testing a key support zone after the recent bearish momentum pushed price lower. This area has previously attracted buying interest, making it an important level for buyers to defend.
If buyers can hold this support and trigger a strong rebound, the recovery could extend toward the 570.0 target zone. A clear bullish reaction from this area would strengthen the probability of a short-term upside move.
The reaction here will determine whether BNB can build enough momentum for the next push toward 570.0.
Binance Coin (BNB)Binance Coin (BNB)
Binance Coin is up 4% this week after buyers managed to take it above the support at $580. As long as this key level holds, bulls have the upper hand, and they may be aiming for $690 next, which is the key resistance.
At the time of this post, the ongoing uptrend is still early, and sellers could at any time reverse it. Therefore, best to wait for a confirmation of this breakout to avoid a bull trap scenario.
Looking ahead, BNB could continue to consolidate between $580 and $690. If so, the drop under $580 could be interpreted as a short-term deviation in the price action.
BNB: Sequential Lower-High Structure ContinuesBNB: Sequential Lower-High Structure Continues – Bearish Scenario Targeting the $500 Support Floor
BNB has recently confirmed the formation of another lower peak, validating that the broader weakening structure continues to dictate price action. Although the downward correction did not accelerate aggressively following our prior technical call, the price action fundamentally remains trapped inside a primary bearish wave. The brief recovery observed earlier did not reflect genuine buying power, but rather served as a temporary cooling-off phase for the market to re-accumulate supply for the next downside leg.
Observing the visual data from the daily chart , the emergence of a third peak (TOP 3) clearly lower than the preceding high zones (TOP 1 and TOP 2) provides clear evidence of persistent selling pressure. The fact that price candles are consistently suppressed beneath the dynamic moving average baseline indicates that buying demand is severely exhausted. Against a backdrop where the broader market sentiment remains relatively subdued, fresh liquidity is distinctly lacking to support the price.
Consequently, the primary technical outlook maintains that the price action will soon seek out at least the $500 psychological round number support zone to sweep for liquidity. This represents a strategic floor required to attract dip-buying interest. Proactively aligning trade positioning with the ongoing macro downtrend offers a substantial risk management advantage for market participants.
Disclaimer: This is not financial advice, DYOR.
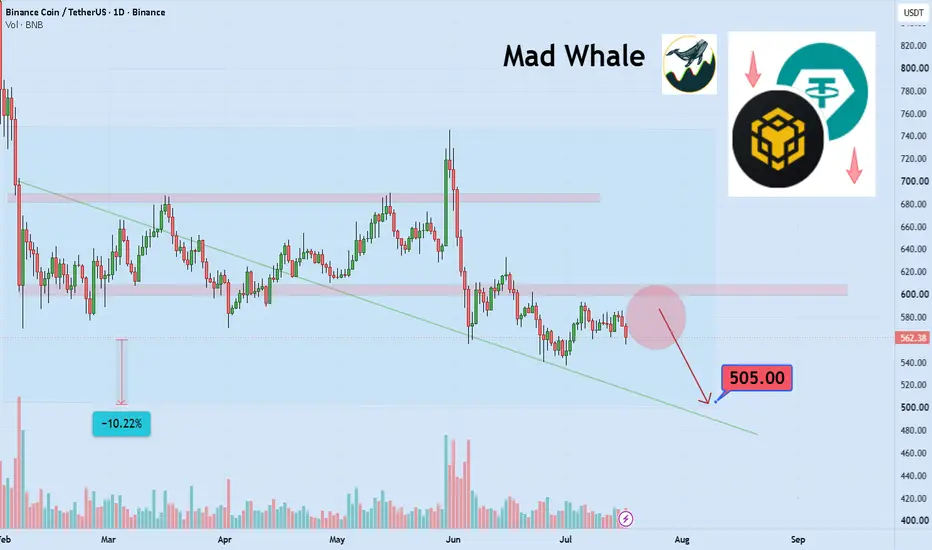
BNB Outlook: Potential 10% Decline Toward $500 Hi,
Binance Coin (BNB) is one of the assets with relatively low volatility, making it a very suitable option for long-term investment. However, in a declining market, even assets like BNB will eventually experience their share of the downside.
For now, in the short term, I expect at least a 10% decline, with a potential target near the $500 level. Over the past few weeks, BNB has formed a very clean and well-defined parallel trading range. There is also a possibility that it may begin forming a descending channel in the coming days and weeks.
Need a little love!
We pour love into every post your support keeps us inspired! Don’t be shy, we’d love to hear from you on comments. Big thanks
BNB: Bulls Still Have Work to DoFirst of Two BNB Charts
This first chart looks at the weekly timeframe, where the support zone just below $600 remains the main battleground. June’s breakdown was quickly reclaimed, but bulls have struggled to build any meaningful momentum since.
Support Under Pressure
BNB is once again testing the same weekly support area around $570-$590. Buyers are still defending the zone, but repeated tests increase the risk that support eventually gives way.
Trend Remains Bearish
The 21/8-week EMAs remain bearishly crossed, with price continuing to find resistance around the 21-week EMA. Until that structure improves, the broader trend continues to favour the bears.
Momentum Still Weak
RSI remains below 50, confirming that bullish momentum has yet to return. StochRSI is hovering just above oversold territory, suggesting the downside may be stretched but not yet exhausted.
Bulls Need to Reclaim $600
A convincing break back above $600 would be the first sign that sentiment is beginning to improve. Failure to reclaim that area keeps the risk of another move towards the recent $537 low firmly on the table.
In Summary
BNB remains pinned around a major weekly support zone, but the broader structure still favours the bears. The bearishly crossed 21/8-week EMAs, weak RSI and repeated tests of support all suggest bulls still have work to do. Reclaiming $600 would improve the outlook, while another rejection would keep the recent lows in focus.
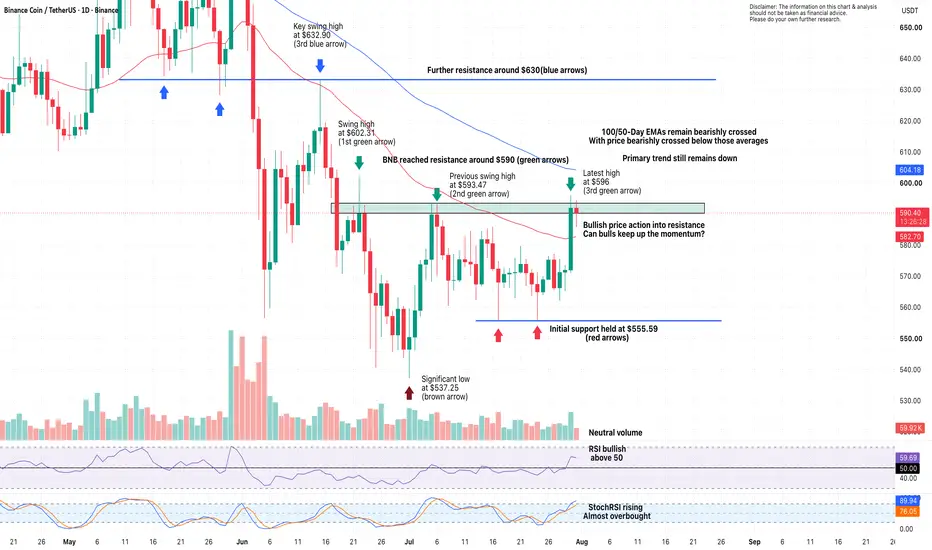
BNB: Bulls Face Their First TestPrimary trend still points lower
Despite the recent rally, BNB remains in a primary downtrend. The chart continues to respect lower highs, with buyers now facing the first major resistance zone around $590.
Moving averages remain bearish
The 100/50-day EMAs remain bearishly crossed, with price still trading below both averages. Until those EMAs are reclaimed, the broader technical picture continues to favour the bears.
Resistance overhead
The $590 area has repeatedly acted as resistance since June, making this an important test for the recovery. A convincing break and close above would shift the focus towards the next resistance around $630.
Support holding for now
Initial support around $555.59 has successfully attracted buyers on multiple occasions. Holding above this level keeps the current recovery alive, while a break below would increase the risk of a retest of the significant $537.25 low.
Momentum improving
RSI has moved back above the 50 level, suggesting momentum is beginning to favour the bulls, while StochRSI is rising towards overbought territory. Volume remains relatively neutral, meaning a breakout may require stronger buying participation.
In Summary
BNB has staged an encouraging recovery, but the first real test has now arrived at the $590 resistance zone. While momentum has improved and support at $555.59 continues to hold, the 100/50-day EMAs remain bearishly crossed and the broader trend is still down. Bulls need a decisive break above $590 to strengthen the recovery, with $630 becoming the next major upside objective.
Short idea on BNBI've plotted resistance levels calculated using my own method on the chart. The color and number of each level indicate its strength. Blue is a weak level, orange is an average level, and red is a strong level. Strength (numbers) also influences the level. Strength from 20 to 50 is an average level, from 50 to 100 is strong, and from 100 and above is very strong.
I expect the price to break out of the Falling Wedge and stop around 612$-626$, and from there, a correction to 590$ will begin. I plan to enter with three equal limit orders.
BNB/USDT – Bearish Rejection Setup from Trendline 📉 BNB/USDT – Bearish Rejection Setup from Trendline 🔥
🧠 Market Overview
BNB is trading below a well-respected descending trendline, showing that sellers remain in control. Price is approaching a key resistance area where a rejection could trigger the next bearish leg.
🔍 Technical Analysis
📉 Bearish Trendline: Price continues to respect the descending resistance, keeping the bearish structure intact.
⚠️ Resistance Zone: The 570–584 USDT area is a strong supply zone. A rejection here would favor sellers.
🔄 Possible Fake Breakout: A brief push above resistance is possible to grab liquidity before the market reverses lower.
📦 Order Block Target: The major demand/order block around 542–538 USDT is the primary downside objective.
🎯 Trade Plan
✅ Entry: Wait for bearish confirmation in the 570–575 USDT zone.
🛑 Stop Loss: Above 584 USDT.
🎯 TP1: 560 USDT
🎯 TP2: 550 USDT
🎯 TP3: 538 USDT (Order Block Support)
⚡ Conclusion
As long as BNB remains below the descending trendline and resistance zone, the overall bias stays bearish. A confirmed rejection could lead to a strong move toward the highlighted order block. Always wait for price confirmation and manage risk properly. 📊
BNB Reaches Daily Channel Support – Bounce OpportunityBNB has reached the lower boundary of a well-defined parallel channel on the daily timeframe, a level that has acted as dynamic support in the past.
If buyers step in at this area, we could see a technical bounce toward the channel's midline or even the upper resistance. I'll be watching for bullish confirmation before adding to a position, as losing this support could lead to further downside.
Trade idea:
• Timeframe: 1D
• Bias: Bullish (if support holds)
• Key level: Lower boundary of the parallel channel
• Risk: A daily close below the channel would invalidate this setup.
As always, this is my personal market analysis, not financial advice. Manage your risk and wait for confirmation before entering
BNB 4H – Range Consolidation Under Descending TrendlineBNB on the 4H timeframe is currently trading around 593.96 after recovering from the early July low near 538–540 and establishing a choppy range between 565–572 and 584–594, with a descending trendline from above continuing to compress the upper boundary of every recovery attempt.
The chart shows a descending trendline originating from the late June high near 599,
connecting through the July 6 high near 592 and the July 14 high near 585, now sloping into the 580–582 area currently. Price dropped from the late June high into the July 1 low near 538–540 where a rising lower trendline provided support before price recovered sharply back into the range. That rising lower trendline connects the June 25 low through the July 1 low and continues to climb into the 535–538 area, though price has traded well above it since the recovery and it now sits as a distant backstop rather than an active reference. The horizontal level near 571–574 has become the central pivot of the current range, with price repeatedly crossing through it in both directions across the second half of July. The descending trendline has capped the July 6 recovery near 592 and the July 14 recovery near 585, with each successive high lower than the prior one.
Price is currently pressing back toward the descending trendline near 580–582 from below after bouncing off the 565–568 support zone, making this the third test of the trendline following two clean rejections.
Key Levels To Watch
→ 598–602 – Late June high, major resistance above
→ 584–586 – Descending trendline, current overhead resistance (dynamic)
→ 577–580 – Minor resistance, upper range reference
→ 571–574 – Horizontal pivot, range midline
→ 565–568 – Range support, recent bounce zone
→ 558–562 – Secondary support below range
→ 535–540 – Rising lower trendline and July low, major support below
A confirmed 4H close above the descending trendline near 584–586 and follow-through above 592–594 would signal a trendline break and range breakout, opening a move toward the late June high near 598–602 and potentially above it on continuation.
A rejection at the descending trendline near 580–582 and a loss of the 565–568 range support would keep the bearish trendline structure intact and expose price to a move toward 558–562 and potentially back toward the rising lower trendline near 535–540 on a deeper breakdown.
Third test of descending trendline inside choppy range, prior two attempts both rejected. Break above 584–586 → trendline cleared, eyes on 598–602. Reject here and lose 565–568 → range support gone, downside toward 558–540. Bias neutral inside range. Shift bullish only on confirmed close above descending trendline.
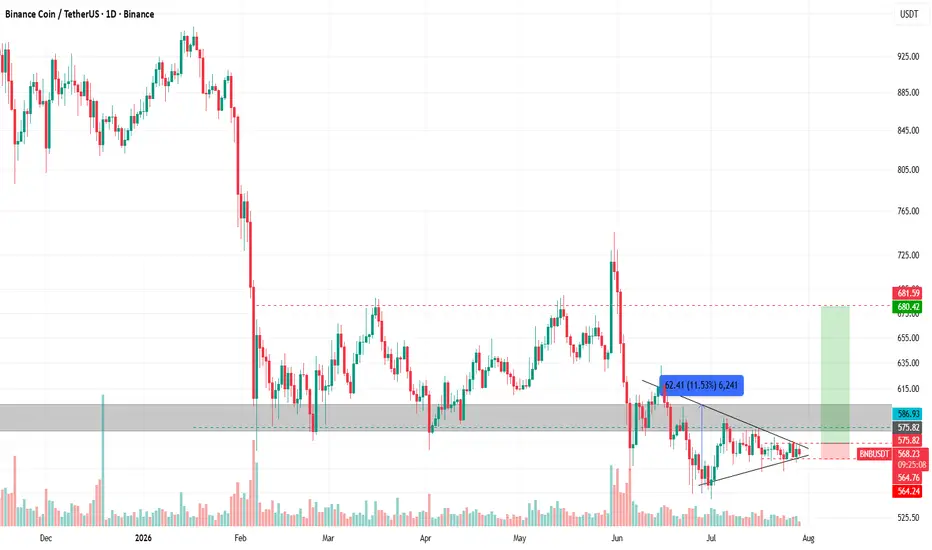
BNBUSDT: Strong Bullish Move Incoming, Get Ready! Dear Traders,
The overall trend remains bullish as the price approaches a liquidity void area. This area needs to be filled before further action or trend determination based on the market cycle. The price is moving nicely and likely to touch our buying zone before continuing the uptrend towards 800 to 900. This trade setup has significant potential to reach our target but we’ll need to wait for the setup to activate.
Good luck and trade safely!
Team Setupsfx_
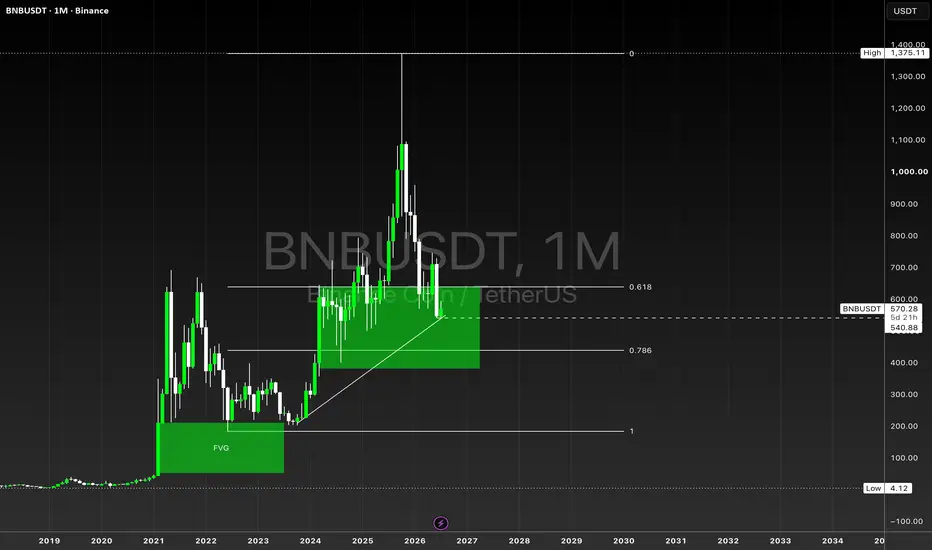
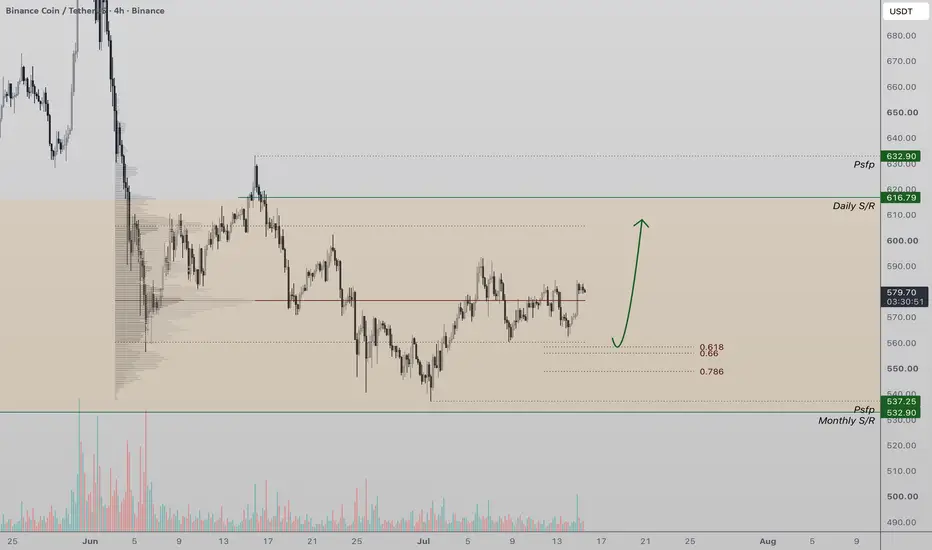
BNB Holds Key SupportBNB is currently consolidating around the midpoint of its broader trading range, reflecting a balanced market where buyers and sellers remain in equilibrium. Rather than showing signs of a breakdown, price continues to trade within the established range, suggesting that the recent pullback may simply be a pause before the next directional move.
The key level to monitor is the $550 support, which is reinforced by the Value Area Low (VAL) and the 0.618 Fibonacci retracement. This combination creates a strong zone of technical confluence where buyers are expected to defend the current market structure. Historically, areas where multiple technical indicators align often provide high-probability reversal opportunities.
As long as BNB continues to hold above the $550 region, the probability increases for the formation of a higher low. Establishing a higher low would reinforce the bullish structure and improve the chances of a rotational move back toward the upper boundary of the current range.
However, a failure to hold this support would weaken the short-term outlook and increase the risk of a deeper correction before buyers return.
For now, the technical picture remains constructive while price holds above the $550 support. A bullish reaction from the Value Area Low and 0.618 Fibonacci would provide strong confirmation that buyers remain in control and could trigger the next rally toward higher resistance levels.
#BNBUSDT D#BNBUSDT D
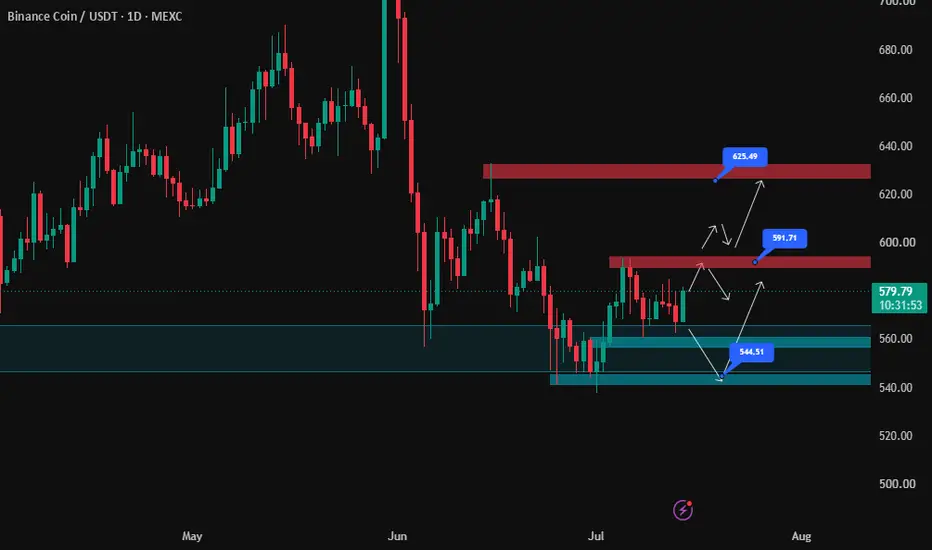
BNB is currently trading within an important FTR zone, and we're also seeing a QM pattern forming.
If the current bullish momentum continues, BNB could move toward **$590**.
If price manages to engulf the resistance and establish a solid close above it, the next short-term target could be around **$625**.
The second blue demand zone is also an important support area. However, if that level fails, the overall technical outlook would become significantly more bearish.
We'll keep you updated.
GETTEX:BNB
$BNBUSDT Inverse Head & Shoulders SetupThe chart shows BNB/USDT Perpetual (Binance) on the 12H timeframe forming an Inverse Head & Shoulders pattern. The structure consists of a visible left shoulder, head, and right shoulder, with a descending neckline acting as the primary resistance zone.
The current price is trading around 570.35 USDT, remaining below the neckline. This makes the neckline the key level to watch for a potential bullish confirmation.
Key Levels
- Support: ~537.31 USDT (pattern low/invalidation area)
- Resistance / Neckline: ~589–590 USDT
A confirmed breakout above the neckline (around 589–590 USDT) could validate the pattern. If confirmed, the chart projects a potential move toward 647.29 USDT, representing an approximate 10% upside from the breakout region.
If price fails to break the neckline and instead loses the 537.31 USDT support, the bullish pattern could become invalid, making this an important risk level to monitor.
This chart highlights a developing technical structure only. Watch for confirmation before drawing conclusions, as price action could change if key levels fail to hold.
BNB: Multi-Month Support Holding, But Resistance Still OverheadMulti-Month Support Still Holding
BNB continues to hold the key multi-month support zone between $500-$550, with buyers once again stepping in after the recent low at $537.25. The repeated defence of this area suggests demand remains strong, although the recovery has so far been fairly modest.
100/50-Day EMAs Still Bearish
The 100/50-day EMAs remain bearishly crossed, with price continuing to trade beneath both moving averages. Until those averages are reclaimed, the broader daily trend remains tilted in the bears' favour.
$632.90 Remains the Key Resistance
The June 15 swing high at $632.90 continues to act as the major resistance level. A decisive break above this area would be the first real sign that the bulls are beginning to regain control and could open the door to a move back towards the June highs.
Momentum Neutral as Price Consolidates
Volume continues to decline as price moves sideways, while the RSI remains around the 50 level and the StochRSI works off its recent overbought condition. This points towards a market that is consolidating rather than showing strong conviction in either direction.
In Summary
BNB continues to defend an important multi-month support zone, but the recovery is still lacking strong momentum. The bearish moving average structure and resistance at $632.90 remain the main hurdles, while the current consolidation suggests the market is waiting for its next catalyst before committing to a larger move.
Short time in BNB tooHello Traders!
Market is strong bearish and BNB is also showing very strong bearish patterns.
BNB is inside an expanding triangle. There is a chance that BNB will move up to touch the line but we are not waiting for that as market is strong bearish so we are Selling BNB From 573
Stoploss 600(-4.5%)
Target 535(+6.8%)
My goal is to be recognized as one of the highest win-rate traders in the TradingView community. :)
Trade Analysis Based on
> Fibonacci Tool (A1000x Way) – Custom Fibonacci approach for precise market analysis
> Candlestick Patterns – Strong price action confirmation through key candle formations
> A1000x Breakout Strategy – Identifying and trading high-probability breakout setups
> HH, HL & LH, LL Strategy – Market structure analysis for clear trend direction
> Swing Points – Tracking key highs and lows for accurate price movement insight
> A1000x Stoploss Strategy – Strategic stoploss placement for effective risk control
> A1000x Target Strategy – Structured target setting based on price action
We trade using carefully developed strategies and disciplined market analysis, always seeking the best possible accuracy while remembering that ultimate success comes only by the will of Allah.
In some trades, you may notice a relatively larger stop loss or a risk-to-reward ratio that may appear unusual at first glance. However, every trade is taken with proper planning and calculated analysis, not random entries.
Before entering any position, we perform detailed calculations and market evaluation. Based on this analysis, we carefully determine our stop loss and target levels.
I personally apply one of my specialized stop-loss and target strategies, designed to place the stop loss at a logical market level where price is less likely to reach before moving toward the intended target — InshaAllah.
Trading always involves risk, but with discipline, patience, and proper strategy, we aim for consistent and responsible decision-making.
Feel free to share your thoughts, leave a comment, or contact me.
BNB/USDT Technical Analysis 🚀 BNB/USDT Technical Analysis | Bulls Building Momentum Toward Major Resistance 📈
BNB/USDT is showing a strong recovery after confirming a Change of Character (CHoCH), signaling that market sentiment has shifted from bearish to bullish. Following the impulsive decline, buyers stepped in aggressively near the major support area, creating a sequence of higher highs and higher lows. This structure has developed into a well-defined ascending channel, suggesting that the bullish trend remains intact as long as the lower boundary of the channel continues to hold.
📊 Market Structure Analysis
The chart initially displayed a healthy uptrend before experiencing a sharp bearish correction. This correction broke the previous bullish momentum, but the market quickly found support around the $556–$560 zone. From there, BNB established a CHoCH, which often indicates the beginning of a new bullish phase.
Since that structural shift, price has respected the ascending channel, with buyers consistently defending every pullback. The recent rally toward $581 demonstrates increasing buying pressure and suggests that market participants remain optimistic.
🟢 Support Levels
🔹 Immediate Support: $574–$575
This area aligns with the middle portion of the ascending channel and has acted as a recent demand zone. A pullback into this region could provide buyers with another opportunity to enter the market.
🔹 Major Support: $556
This is the strongest support on the chart. It represents the origin of the bullish reversal and the point where buyers regained control. As long as price remains above this level, the overall bullish outlook stays valid.
🔥 Resistance Levels
🎯 First Resistance: $582–$585
This zone may generate temporary selling pressure as traders secure short-term profits.
🎯 Major Resistance: $592–$595
This highlighted resistance area has rejected price in the past and represents the next significant target. A confirmed breakout above this zone could trigger a fresh bullish expansion and open the door for higher price levels.
📈 Bullish Scenario
The overall trend favors buyers while price remains inside the ascending channel.
A healthy retracement toward the channel support around $575 would be considered technically constructive rather than bearish. If buyers defend this level with strong bullish candles and increasing volume, BNB could resume its upward movement toward $592–$595.
A decisive breakout above the resistance zone would confirm continued bullish momentum and strengthen the long-term uptrend.
📉 Bearish Scenario
Although buyers currently control the market, traders should remain cautious.
If price fails to hold above the ascending channel and closes below $574, short-term weakness may develop. Additional selling pressure could send the market toward $570 and eventually the major support near $556.
A breakdown below $556 would invalidate the current bullish structure and increase the probability of a deeper correction.
📌 Trading Plan
✅ Wait for confirmation near channel support before considering long positions.
✅ Watch for strong bullish candles or increased volume around support levels.
✅ Monitor price action closely near $592–$595, as this is the key resistance that will determine whether the bullish trend continues.
✅ Always maintain proper risk management and avoid entering trades without confirmation.
💡 Final Outlook
BNB/USDT continues to display a bullish market structure, supported by a confirmed CHoCH and a well-respected ascending channel. The trend remains positive while price stays above the channel support. A controlled pullback could provide the fuel needed for another rally toward the $592–$595 resistance zone. However, traders should remain patient and wait for confirmation, as resistance may produce temporary volatility before the next directional move.
📚 This analysis is based solely on technical price action and is intended for educational purposes only.
#BNB #BNBUSDT #BinanceCoin #Crypto #TechnicalAnalysis #PriceAction #TradingView #Bullish #SupportAndResistance #CHoCH #AscendingChannel #RiskManagement