GTLB: Whales Buying the AI Fear — Textbook Neckline Backtest🦊 💻🦊 💻 📈 🚀 📈 🚀
When the broader market panics over sweeping, generalised macro narratives, the smart money quietly separates the structural winners from the noise.Software names got absolutely hammered in June on widespread "AI disruption" fears.
Morgan Stanley recently characterised this environment as a "peak uncertainty" moment for the entire enterprise software landscape.
But while retail investors threw the baby out with the bathwater, the institutional tape tells a completely different story: 155 existing institutional positions were increased, and 55 brand-new whale positions were opened.
They didn't run away; they aggressively bought the fear.
The structural rotation out of pure speculative hardware and back into high-quality, cash-generating software platforms is officially underway—and GitLab (NASDAQ: GTLB) is sitting right at the front of the line.
📊 Part I: Fundamental Fuel & The $1B ARR MilestoneGitLab isn't an AI casualty; it is a primary AI beneficiary.
Its native DevSecOps platform is scaling rapidly as enterprise software groups scramble to deploy agentic coding workflows.
The numbers from the recent Q1 FY2027 print prove the business is firing on all cylinders:
The Billion-Dollar Threshold: GitLab officially crossed $1 billion in ARR while generating a robust $220 million in free cash flow for FY2026.
Corporate Confidence: Management didn't hesitate to authorise a massive $400 million share repurchase program.
This isn't a defensive posture—this is a structurally sound company aggressively buying its own dip because it knows the market is mis-pricing its equity.
Q1 FY2027 Earnings Blowout: Revenue hit $264.2 million (a stellar 23% YoY growth clip), easily beating consensus estimates.
Non-GAAP EPS landed at $0.23, serving up a clear 12.3% beat on the bottom line.
Guidance Lifted: Full-year revenue guidance was confidently lifted to a $1.12 billion baseline, completely contradicting the sector-wide slowdown narrative.
📐 Part II: Technical Architecture — High Volume Breakout, Low Volume Pullback
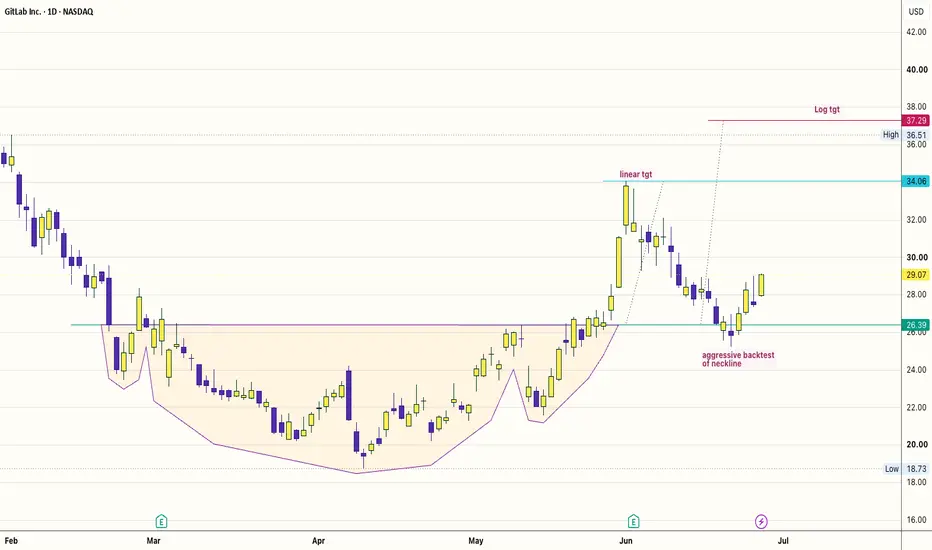
The chart setup captured in is absolutely textbook market structure.
We are witnessing a classic structural accumulation pattern that has just completed its introductory expansion phase.
➔ ➔ ➔
The Base & Neckline Break:
After grinding out a wide rounding accumulation floor from February through May, GTLB executed a massive, high-volume breakout candle in early June, violently slicing through structural resistance at $26.39.
The Controlled Cleanse: The subsequent decline wasn't a liquidation event—it was a highly controlled, incredibly low-volume pullback.
The Aggressive Neckline Backtest: As highlighted explicitly on the chart, price successfully completed an aggressive backtest of the neckline at the $26.39 level and immediately found strong institutional bids.
Volume is beginning to return right on cue, confirming that the weak hands have been thoroughly shaken out.
⚡ Part III: Execution Coordinates & Trade Parameters
The risk-to-reward ratio on this swing configuration is incredibly clean.
We wait for the confirmation trigger to unlock the sequence toward our primary targets.
🟢 Trigger Level> $29.5 above recent minor consolidation highs activates the trade.
🔴 Hard Stop< $29.00 A clean break back below the immediate pivot invalidates the localised bullish momentum.
🎯 Target 1 (Linear)$32.00 Initial liquidity pocket.
Take profit on the first 1/3 of the position to secure a risk-free trade.
🎯 Target 2 (Linear)$34.06 Major psychological resistance line mapped on. Trim harder here.
🚀 Target 3 (Log Tgt) $37.29. Exit the remaining core runner for a maximum risk-to-reward payday.
#GTLB #GitLab #DevSecOps #TechnicalAnalysis #PriceAction #SectorRotation #EarningsBeat #ChartPatterns #RoundingBottom #WhaleActivity #SoftwareRotation #TradingView #SwingTrade #BuyTheDip #MarketStructure
In-depth trading ideas
$GTLB - 50 SMA Breakout and Cup and Handle💡 Swing setup idea
Cup and handle completion
🔎 Analysis summary:
The stock crossed above the 50 SMA and is closing a cup and handle pattern. Buyers volume is also starting to step in.
👀 Levels to watch:
Entry trigger: Break above $34
Target: $49.46
Stop: Under the breakout level
💬 What do you think of this setup? Let me know in the comments! 👇
Good luck!
⚠️ Note: This is for educational purposes only and is not financial advice.
GTLB - End of long term downtrendGTLB appears to have finally put in a long-term bottom near its all-time low of $18, marking what could be the end of its extended bearish cycle. Price has since broken out of a Cup & Handle / Round Bottom pattern — a classic accumulation structure that signals a meaningful shift in trend.
The measured move from this breakout points to an initial target of $35, where price will face a significant confluence of resistance: the daily EMA 200 and a long-term descending trendline. This level will be the first major test of the new bullish structure.
Two scenarios & entry zones to watch:
Pullback entry: Price hits $35, faces resistance, and retraces toward $29–30 — offering a cleaner, lower-risk re-entry before the next leg higher
Breakout entry: Price pushes through $35 with conviction and sustains above it on a daily closing basis — confirming the trend continuation and opening the door to significantly higher levels
Invalidation: A breakdown back below the breakout zone would call the setup into question.
# GTLB (GitLab Inc.) Daily Chart Analysis – 6/2/26# GTLB (GitLab Inc.) Daily Chart Analysis – 6/2/26
### Company Information
GitLab Inc. provides a comprehensive DevSecOps platform that helps organizations manage software development, security, and deployment workflows in a single application. The company continues to benefit from long-term trends in cloud computing, AI-assisted development, and enterprise software modernization.
### Key Observations
• GTLB has experienced a significant multi-year correction from the 2021 highs near $137.
• The stock recently established a major bottom near:
• $18.73
• A powerful rebound has occurred over the past several weeks, pushing shares back above the daily 50EMA.
• Current price sits around:
• $33.07
• The recent move represents one of the strongest rallies GTLB has produced since entering its longer-term downtrend.
### Pattern Structure
• The long-term trend remains technically bearish due to the declining multi-year trendline.
• However, price has produced a meaningful higher low and higher high sequence from the spring bottom.
• The current rally has reached an important resistance cluster around:
• $33.61
• $36.69
• A breakout through these levels would likely trigger additional momentum buying.
### Support & Resistance Levels
#### Resistance
• $33.61
• $36.69
• $40.84
• $44.74
• $48.74
• $53.44
• $56.02
#### Support
• $28.62
• $26.83
• $23.75
• $18.73
### Volume & Trend Notes
• Volume expanded significantly during the recent rally off the lows.
• The sharp recovery suggests institutional accumulation may be occurring after the extended selloff.
• Momentum has shifted bullish in the short term, but GTLB remains below the larger multi-year descending trendline.
• Bulls will want to see consolidation above the 50EMA rather than immediately giving back gains.
### Daily EMA Analysis
• Price has reclaimed the daily 50EMA.
• The 50EMA is beginning to curl upward after a prolonged decline.
• The 200EMA remains above current price and continues acting as major resistance.
• A future reclaim of the 200EMA would be a significant long-term trend improvement.
### ✅ Trading Plan
#### Bullish Scenario
Trigger: Break and hold above $33.61
Targets:
• PT1: $36.69
• PT2: $40.84
• PT3: $44.74
• PT4: $48.74
Stop Loss:
• Close below $28.62
#### Bearish Scenario
Trigger: Rejection from $33.61 resistance and loss of $28.62
Targets:
• PT1: $26.83
• PT2: $23.75
• PT3: $18.73
Stop Loss:
• Reclaim above $33.61
### Summary
GTLB is showing some of the strongest technical improvement it has displayed in quite some time. The stock has rallied sharply from the $18 area, reclaimed the daily 50EMA, and is testing its first major resistance zone near $33.61. A successful breakout above this area could open a larger recovery toward the low-to-mid $40s. The longer-term trend is not fully repaired yet, but the recent price action suggests a potential trend reversal may be developing.
Load up $GTLB for $45-50- NASDAQ:GTLB has gotten ridiculously cheap. Market cap is 4.51B and currently trading at $26.73
- $GLTB might get taken out by big sharks like NASDAQ:GOOGL / NYSE:IBM
- NYSE:IBM has previously bought CFI:CFLT for 10x sales
- NASDAQ:GTLB has revenue of 955 mil for year 2026
- Market cap should at least be 8-9B
Software Selloff Meets Opportunity: Is GitLab Setting Up for a RAfter months of heavy selling across the software sector, charts like NASDAQ:GTLB (GitLab) are starting to look a lot more interesting. Growth names have been under pressure due to higher rates, valuation compression, and a general shift toward risk-off positioning. GTLB hasn’t been spared-price has been in a clear downtrend, reflecting the broader sentiment hitting names like Atlassian and other dev-platform peers.
But that’s exactly where things start to get interesting.
From a fundamental perspective, GitLab is still well-positioned in the software development lifecycle space. The push toward automation, AI-assisted coding, and integrated platforms continues to grow. While there hasn’t been a single explosive headline catalyst recently, the broader trend of AI integration into developer tools is a tailwind for the entire space—including GTLB and its competitors.
Now shifting to the chart.
We’re seeing a classic structure after a prolonged selloff: stabilization → consolidation → potential breakout. Price has been building a base and is now pushing into a clearly defined resistance zone (highlighted on your chart). This level has acted as a supply area before, so the reaction here matters.
The idea for a long setup is straightforward:
If GTLB can break and hold above this resistance zone, it could signal a shift in short-term momentum. That would likely attract fresh buyers, especially if the broader software sector starts catching bids again.
The drawn scenario (pullback after breakout → continuation higher) makes sense from a market structure perspective:
Breakout confirms strength
Retest shakes out weak hands
Continuation follows with momentum
This kind of move is typical after extended downtrends where sellers get exhausted.
Why this setup is interesting:
The stock is already heavily sold off → less downside asymmetry compared to earlier
Clear invalidation level → risk can be defined below the zone
Sector correlation → if software rebounds, GTLB can move fast
Psychological shift → from “sell rallies” to “buy dips”
Of course, this isn’t guaranteed. If price fails to break this level or gets rejected hard, it would suggest sellers are still in control and the range continues—or worse, another leg down.
So the key is patience and confirmation.
This is not about predicting-it’s about reacting.
If the breakout comes with strength and volume, the long thesis becomes valid. Until then, it’s just a setup forming in a beaten-down name within a weak (but potentially bottoming) sector.
Bottom line:
GTLB is sitting at a decision point. After a major drawdown, this kind of structure often precedes strong moves-but only if buyers step in and confirm it.
Code the BottomGitLab is trading near major long-term support, forming a textbook rounding bottom at historical lows that have acted as a critical demand zone. Price recently tagged the $18.73 level — the very bottom of its 52-week range — and is now showing early signs of stabilization and recovery. This is the ultimate "prove it" zone for the stock.
There may be one final gap fill near the $22.50 level before the real move begins — and how price reacts in that zone will be telling. A stock that absorbs that last dip and holds is showing exactly the kind of resilience buyers want to see.
A decisive break and close above $25 would confirm renewed bullish momentum and signal that the rounding bottom is complete, opening the door for a measured move toward the $37.80 resistance zone — aligning closely with the 200/150 moving average levels visible on the chart.
Key Levels:
🔵 Support / Entry Zone: $18.50 - $23.75 (current lows / rounding bottom base)
⚠️ Gap Fill Watch: $22.50
⚡ Breakout Trigger: $25.00
🎯 Price Target: $37.80
🛑 Stop Loss: $18.50
📊 Risk/Reward: 2.67:1
With a clearly defined stop at $18.50 and a target of $37.80, this setup offers a 2.67:1 risk/reward ratio — controlled downside while targeting a meaningful recovery move back toward prior demand levels.
GTLB will reverse soon and opportunity is immenseThis is one of my highest conviction ideas. SAAS has been broadly sold and it gives really good opportunity in owning Gitlab long term.
Given market sentiment, it is worth looking if there is any danger to Gitlab. I will not speak much about it, it is just ridiculous that such a DevSecOps platform like Gitlab is in the list. No one in the coming years will trust AI based/ vibe code based their infrastructure just because of security and uncontrolled uncertainty. GTLB, in turn, has multi-year contracts with US Gov, Enterprises and SMBs. It is just fun how rare is the opportunity in my opinion.
They charge a little compared to NOW, TEAM, NET, CRWD and the like however GTLB as sticky as the rest and once they start to raise subscription prices, their valuation will dramatically improve, not to mention current cheapness with 17-22% revenue growth YoY
- EV/sales ~4
- forward P/E ~23
Technically, I see the last steep drawdown as the wave 3 in 5 of the C. I'd give a month maximum for a reversal in trend. Buy area is between 19 and 25 USD. In my opinion, the stock can make 3x-5x in 2 years unless someone like IBM or DDOG buys them out for a good premium.
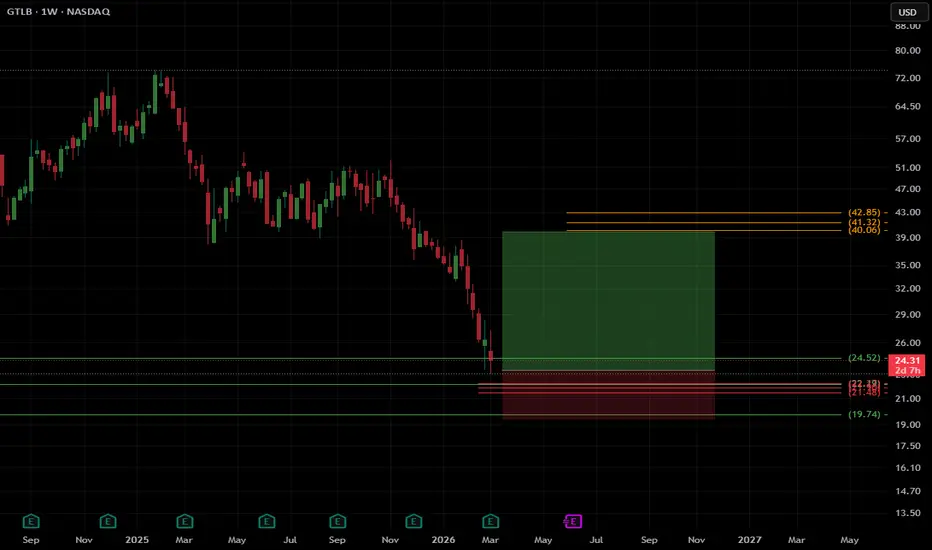
$GTLB , SetupENTRY : CMP
TP1 : 40.06
SL : If you wish
My SL is never a SELL, just an alarm to stop adding money and wait for better dca
Follow, Boost, Thank You !!
⚠️ Financial Disclaimer:
This post is not financial advice. I am not your financial advisor, your life coach, or your legally responsible adult.
Always do your own research and never trade based solely on internet comedy.
Counter-trend long on GitLab Inc. (Ticket GTLB)
NASDAQ:GTLB
Technicals:
- strong candle bounce from long-term support zone on 22 Jan. absorbing previous 10 sessions
- bounce from lower line of long-term descending channel
- corrective candle of 50% leaving 34.24-35.12 zone open for further retest
- therefore short-term stop below 16 Jan. low
- aiming retest of long-term descending channel middle line
- (3-year long support/ressistance zone) = short-term target
- for middle up to long term target is upper line of long-term descending channel 48.60-50.35
- scenario invalidated if two bars close below 32.90
Fundamentals:
- сompany demonstrated consistent Non-GAAP profitability throughout 2025 but still remains unprofitable.
- tracking existing users ratio is showing robust growth, averaging 20% annually.
- positive Free Cash Flow significantly mitigates the risk of further share dilution, so there is no immediate fundamental catalyst for a sharp decline in stock price.
- high-grade security protocols, a mature ecosystem, and the rapid integration of cutting-edge technologies (such as AI-driven DevSecOps) maintain the company's competitive edge in the market.
- on the downside, company faces intense competition from industry conglomerates, and a deceleration in revenue growth during 2025 triggered a wave of institutional sell-offs.
- due to its operations in a high-precision, mission-critical industry, GitLab may serve as a reliable "safe haven" for capital preservation during a recessionary period.
# - - - - -
⚠️ Signal - Buy ⬆️
✅ Entry Point - 36.38
# - - - - -
🛑 SL Short Term - 41.72
🤑 TP Short Term - 33.90
⚙️ Risk/Reward - 1:2.2 👌
⌛️ Timeframe - 2 weeks 🗓
# - - - - -
🛑 SL Long term - 32.44
🤑 TP Long Term - 48.73
⚙️ Risk/Reward - 1:3.1 👌
⌛️ Timeframe - 3-4 months 🗓
# - - - - -
Good Luck! ☺️
$GTLB acquisition target for $DDOG, Open AI, $GOOGL- NASDAQ:GTLB valuation has gotten too cheap to ignore.
- With Vibe Coding rising YOY% , NASDAQ:GTLB is a strategic asset for any company which wants to build and improve coding model.
- Open AI, Anthropic and NASDAQ:GOOGL could massively benefit from it
- NASDAQ:MSFT owns Github, It makes sense for NASDAQ:GOOGL or NASDAQ:AMZN to own NASDAQ:GTLB and embed it in their suit of offering.
- NASDAQ:DDOG + NASDAQ:GTLB could be a solid combination for full blown suite of DevSecOps + Observability
GitLab (NASDAQ: $GTLB) Hits 52-Week Low as Growth SlowsGitLab (NASDAQ: NASDAQ:GTLB ) has slipped to a new 52-week low, closing at $37.81, as the stock continues to face pressure from slowing growth expectations, cautious forward guidance, and broader uncertainty across software and DevSecOps markets. The stock is now down nearly 35% year-over-year, signaling investor concerns despite pockets of operational strength.
In its fiscal Q3 2026 earnings, GitLab delivered a modest 2.5% revenue increase, beating expectations on revenue, operating margin, and free cash flow. Growth was driven by stronger subscription and SaaS adoption, particularly within GitLab Ultimate, as enterprises leaned into consolidated DevOps solutions. However, the decline in license revenue and a sub-20% growth outlook for Q4—a first since going public—tempered market optimism.
Analyst sentiment remains mixed. Truist Securities trimmed its price target to $42, maintaining a Hold stance, while Mizuho lowered its estimate to $47. Meanwhile, Piper Sandler and Cantor Fitzgerald see long-term upside, reaffirming Overweight ratings with targets of $70 and $60, respectively. This divergence highlights uncertainty around GitLab’s ability to reaccelerate growth, expand margins, and compete effectively amid rising AI-driven DevOps platforms.
Technical Outlook
From the chart, GTLB has broken below its critical multi-year support zone around $42–$44, turning that region into fresh resistance. The breakdown triggered increased selling pressure, pushing the stock to new lows near $38. Momentum remains bearish, with no strong demand area until the $32–$34 region. Reclaiming $44 would be the first sign of recovery, but the trend currently favors further downside unless buyers step in aggressively.
GTLB Post-Earnings Bull Run – Don’t Miss Out!GTLB QuantSignals V3 – Earnings Trade Alert (2025-12-02) 🚨
Trade Direction: BUY CALLS (Bullish)
Confidence: 58% | Conviction: Medium
Recommended Strike: $41.50
Entry Range: $3.70
Target 1: $5.25 | Target 2: $6.60
Stop Loss: $2.10
Expiry: 2025-12-05 (3 days)
Position Size: 2% of portfolio (use small due to high risk)
⚠️ Risk & Conflict Notes
Katy AI shows neutral/bearish trend (-3.8% predicted move, 50% confidence), conflicting with LLM BUY CALL recommendation.
High implied volatility (IV 188%) → rapid price swings and time decay; trade carefully.
Earnings have passed (Dec 2); trading post-event requires confirmation of bullish thesis.
High Risk Warning: Only use a small position due to lower confidence and Katy conflict.
💡 Trade Insight
Strong fundamental backdrop: 244% revenue growth + consistent earnings beat history (100% success).
Post-earnings momentum and pre-earnings institutional accumulation (+3.39%) support continuation upside.
Balanced delta (0.619) and tight stop loss mitigate risk while targeting asymmetric gains.
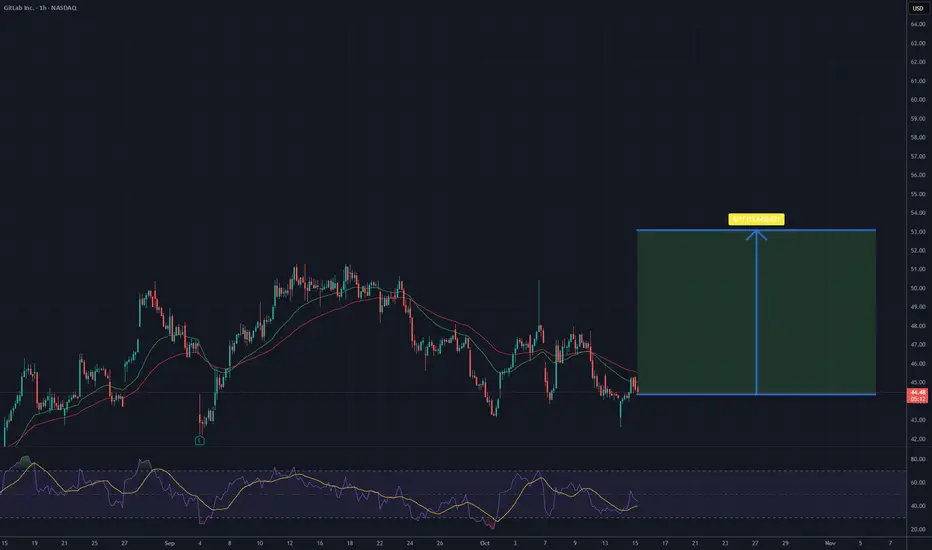
It's time for GTLB - 20% potential profit - 53 USDOn the hourly chart of GitLab Inc. (NASDAQ: GTLB), there are signs of a potential rebound after a recent downtrend. The price is currently holding around the $44–$45 zone, which has acted as a strong support area from previous lows. Increased buying activity in this region suggests that a short-term upward move may be developing.
The moving averages are starting to flatten, and the shorter EMA (green) may soon cross above the longer EMA (red), which often signals an early trend reversal. Additionally, the RSI has bounced from oversold levels and is trending upward, indicating growing buying pressure.
If the price manages to stay above the $44 support level and break through the short-term resistance near $46, further gains toward the next resistance at $49 and ultimately toward $53 are likely — the latter being a key supply zone from previous highs.
In summary, technical indicators point to a possible short-term recovery, with momentum building for a potential price increase toward $53 in the coming sessions.
TP Potential - 53 USD
GTLB Long Setup — Swing to $56GTLB has been building a solid base and is now showing signs of a breakout. Price has pushed above the key R1 pivot level around $50.68 and is holding above both the Ichimoku cloud and the 200-day moving average, which confirms a shift in momentum toward the bulls.
The chart structure shows a series of higher lows since early summer, signaling accumulation and improving demand. Immediate resistance sits at $54.85, followed by R2 at $56.30, which lines up as the first target zone. On the downside, support around $49.20–$48.50 has held multiple times and provides a clear level to place stops.
The risk/reward on this setup is favorable at roughly 4.5:1, with only about 2% downside against 8–9% potential upside. If the price closes below $49.20, this setup is invalidated, but as long as buyers defend that zone, the path of least resistance remains higher. A clean breakout and close above $54.85 would confirm continuation, with $56+ as the next logical upside target.
GTLB GitLab Options Ahead of EarningsAnalyzing the options chain and the chart patterns of GTLB GitLab prior to the earnings report this week,
I would consider purchasing the 50usd strike price Calls with
an expiration date of 2026-3-20,
for a premium of approximately $7.80.
If these options prove to be profitable prior to the earnings release, I would sell at least half of them.
Levels to manage GTLB between now and Thanksgiving 2025If the today's earnings report meets or exceeds expectations, GTLB could confirm the recent analyst optimism and trigger a bullish trend. Conversely, a miss on the earnings could lead to a short-term price decline, potentially testing the support level.
Given the positive analyst sentiment and upcoming earnings catalyst, a likely scenario for the next six weeks is a continuation of the short-term upward trend, with the stock price potentially moving toward the lower end of the analyst price targets.
How Does One Platform Navigate Eight Global Disruptions at Once?GitLab has emerged as a dominant force in the DevSecOps landscape during 2025, achieving a remarkable 29% year-over-year revenue growth to reach $759 million annually in fiscal Q4 2025. The platform's success stems from its ability to address multiple converging global challenges simultaneously, from geopolitical tensions and cybersecurity threats to economic volatility and technological transformation. Key milestones include GitLab Dedicated for Government earning FedRAMP Moderate authorization, enabling accelerated public sector adoption, and strategic partnerships like Sigma Defense's implementation that reduced U.S. Navy software deployment times from months to days.
The convergence of geopolitical and geostrategic factors has created unprecedented demand for GitLab's solutions. Rising data sovereignty requirements and U.S.-China tech rivalries have driven nations to enforce strict data residency laws, making GitLab's single-tenant SaaS architecture particularly attractive for compliance. Defense contractors and government agencies increasingly rely on GitLab's integrated DevSecOps capabilities to strengthen national security positions, with organizations like Sigma Defense achieving 90% cost reductions while dramatically accelerating vulnerability fixes and software deployment cycles.
Economic pressures and technological evolution have further accelerated GitLab's adoption across sectors. The platform delivers a compelling ROI of 483% within three years for large organizations, while the broader DevOps market grows at a 19.1% CAGR. GitLab's integrated approach addresses critical pain points, including toolchain consolidation, embedded security, and AI-powered automation, positioning it as essential infrastructure for cloud-native development. The company's strategic focus on eliminating silos through unified workflows from code to cloud has resonated particularly well with enterprises seeking to reduce complexity and operational costs.
Looking ahead, GitLab's intellectual property strategy and continued innovation in AI integration, exemplified by GitLab Duo's capabilities in code generation and vulnerability detection, suggest sustained competitive advantages. The platform's ability to serve diverse sectors-from federally-funded research centers requiring secure collaboration to high-tech firms demanding cutting-edge automation-demonstrates its versatility in addressing the complex, interconnected challenges defining the modern technology landscape.
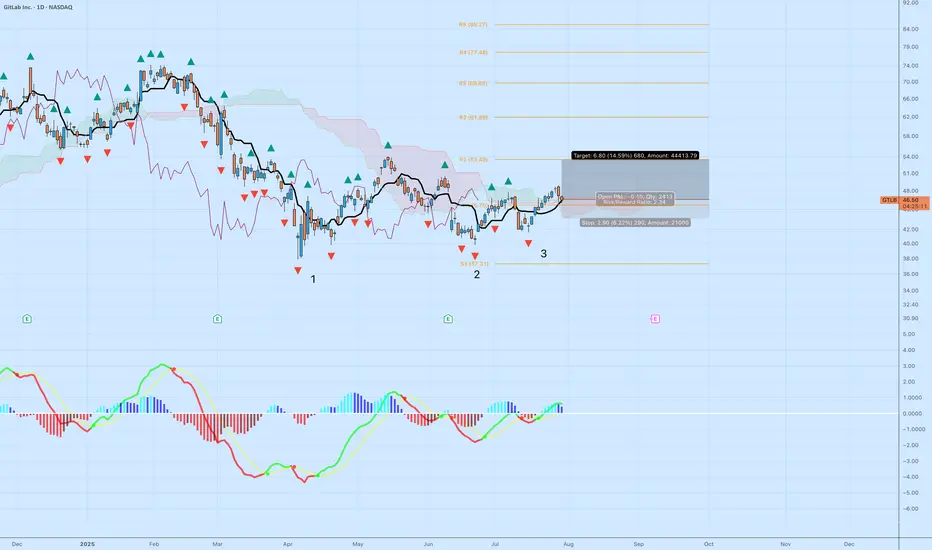
GTLB | Triple Bottom ReversalGitLab (GTLB) is setting up for a potential trend reversal following a textbook triple bottom pattern and a clean breakout above the cloud. Here's the technical breakdown:
Why This Setup Matters
Triple Bottom Pattern: Reversal structure is clear with three defined lows at ~$38, ~$40, and ~$41. The most recent leg up confirms buyers defending that zone.
Ichimoku Cloud: Price has broken above the Kumo with bullish Tenkan-Kijun cross. The leading span A is pointing up, and the cloud ahead is flat and thin — ideal conditions for continuation.
MACD Momentum: Histogram flipped positive again with green signal line crossover — a momentum shift from accumulation to breakout phase.
Trade Parameters
Entry: $46.53
Stop: $43.63 (below Tenkan and the neckline zone)
Target: $53.33
Risk:Reward Ratio: 2.34
Projected Move: +14.59%
Additional Confluence
Daily closes above cloud show growing strength from buyers.
Each bottom was followed by increasing MACD strength — a bullish divergence over time.
Pivot zone at R1 ($53.49) aligns with the price target, adding structure to the exit plan.
Risk Notes
Failure to hold $46 with volume could invalidate the breakout — watch for a retest.
If price closes below Tenkan, reevaluate the setup for weakness.
Volume confirmation needed on the next daily candle for strong conviction.
This is a technical breakout aligned with pattern recognition and trend metrics. Ideal for swing setups with controlled downside.
Worst Behind GTLB. Do you think the worst is behind for GTLB?
With news of senior management selling stock share and the downgrade, we see a clear test of low since April this year. Since the news always come out the latest, the decline during the last 3 months is likely the explaination to the selling pressure we have seen.
However, the bottom is well defended structural-wise, supported by a slow and steady increase in company revenue.
My expectation is that at least we should see a retest around the 200MA.
I am adding GLTB to my portfolio at a 3% position size.
$GTLB undervalued, Potential 2X, AI assisted coding tailwind- NASDAQ:GTLB is likely one of the play for Agentic AI. When other companies like Windsurf, Codium, Cursor are in a goldrush. NASDAQ:GTLB is selling shovels.
- AI assisted coding is now a theme and is happening at a fast pace. I'm certain NASDAQ:GTLB will be a beneficiary of this trend.
- NASDAQ:GTLB has launched various AI based features on its platform which will get adoption and it will be easier for the company to upsell these features.
- P/S for NASDAQ:GTLB is depressed. If they even execute on their fiscal goals, re-rating should lift the stock up.
- NASDAQ:GTLB should be a 2X in less than 3 years in my opinion given secular shift and macro as a tailwind.
Fair value for NASDAQ:GTLB as of now is $68-72