BOMEUSDT Forming Bullish MomentumBOMEUSDT is forming a clear bullish momentum pattern, a classic bullish wave signal that often indicates an upcoming breakout. The price has been consolidating within a narrowing range, suggesting that selling pressure is gradually weakening while buyers are beginning to regain control. With consist
BOME / BOMEUSDT Bullish Setup | Futures Trade IdeaMARKET ANALYSIS
BOME is currently reacting from a key technical area highlighted on the chart.
As long as the protected support zone remains intact, the bullish market structure remains valid and higher liquidity targets may continue to attract price action.
A breakdown below the invalidation
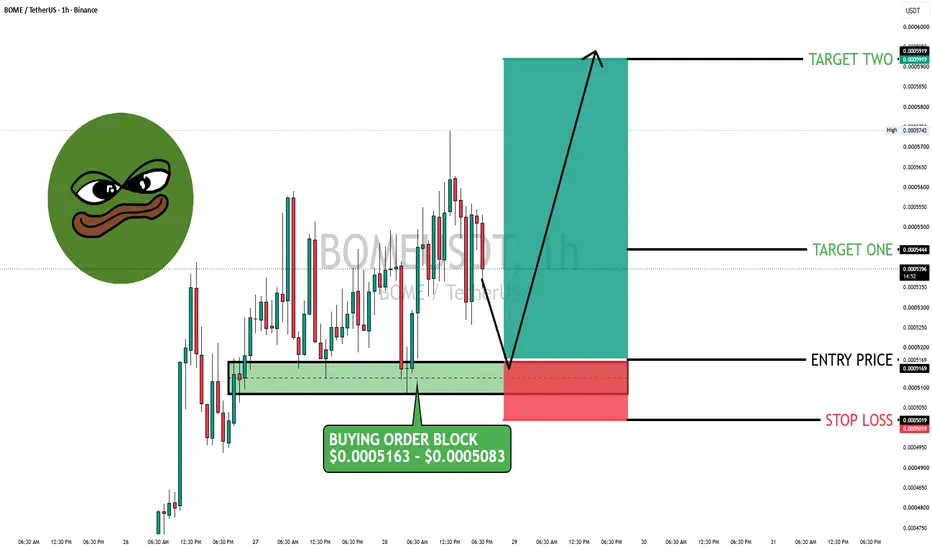
BOME's -2.23% pullback isn't random !BINANCE:BOMEUSDT 's -2.23% pullback isn't random — it's landing on the same $0.0005163–$0.0005083 zone that flipped this thing bullish last time.
News snapshot: BINANCE:BOMEUSDT (Book of Meme) has no formal roadmap or utility beyond speculation and transferability, per its own whitepaper — this m
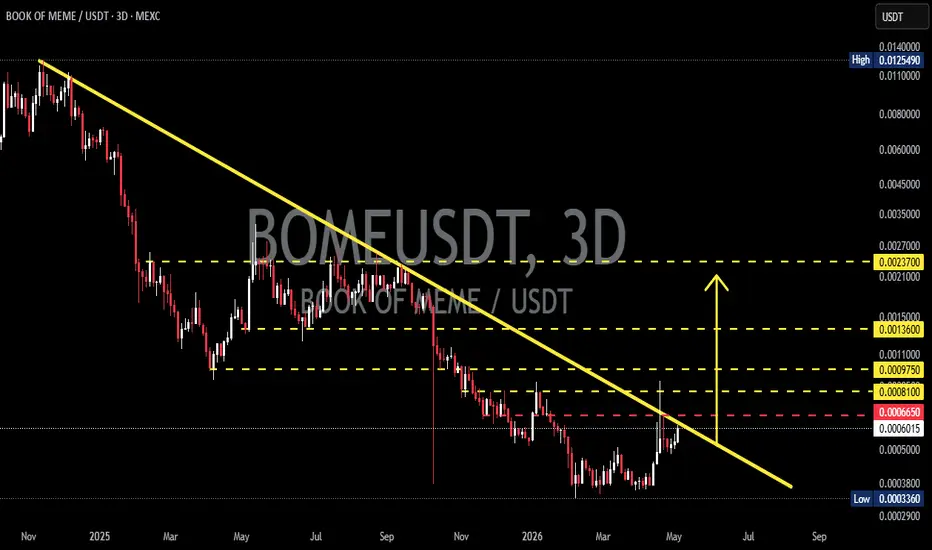
BOMEUSDT – Descending TrendLine Becomes the Decision Point!On the 3-Day (3D) timeframe, BOMEUSDT remains in a medium-to-long-term downtrend structure, highlighted by a major Descending TrendLine 🔻 connecting a series of lower highs since early 2025.
Price is currently trading near a major support area while once again approaching the primary trendline resi
BOOK OF MEME (BOME) Has Huge Growth Potential—1,145%The market always offers a second chance...
BOMEUSDT (BOOK OF MEME) is back within the sideways range while keeping a higher low compared to 6-February. After February higher lows are present in April and now June and this is pretty interesting.
The initial bullish breakout was corrected, a retrac
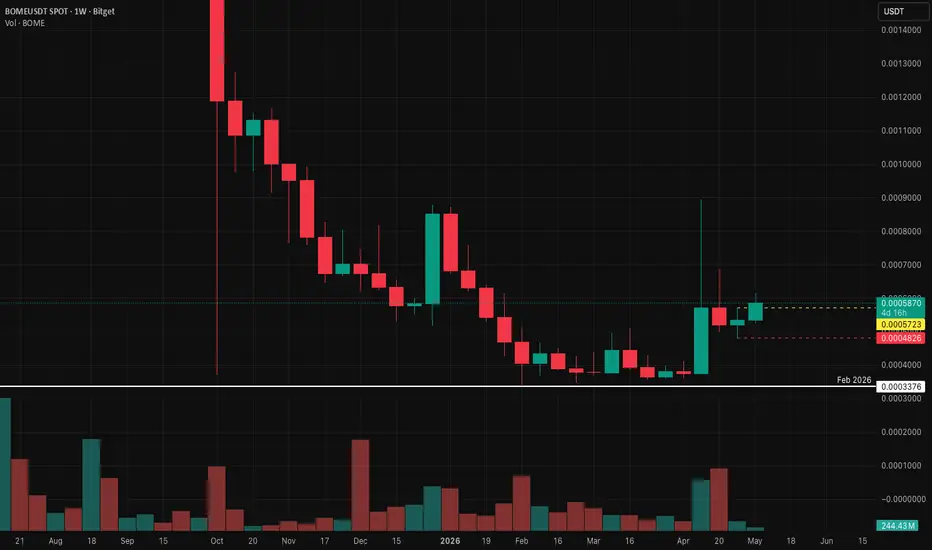
May 6, 2026 BOME. The time to go long has come.- Exchange: Bitget
- Instrument: BITGET:BOMEUSDT
- Timeframe: Weekly
- Trade type: Buy stop order
- Price: 0.0005723
- Take Profit: Open
- Stop Loss: 0.0004826 (-15.80 %)
Idea: Long on a breakout above last week's high — bullish momentum continuation.
Entry: Buy stop above last week’s high.
Stop
BOOK OF MEME (BOME): Update & Bullish ContinuationBOMEUSDT did its breakout mid-April. Just a quick mention: the same pattern of a low in February followed by some accumulation before this breakout is present here.
The breakout is coupled with really high volume and this the main signal that supports what happens next, a bullish continuation.
Jus
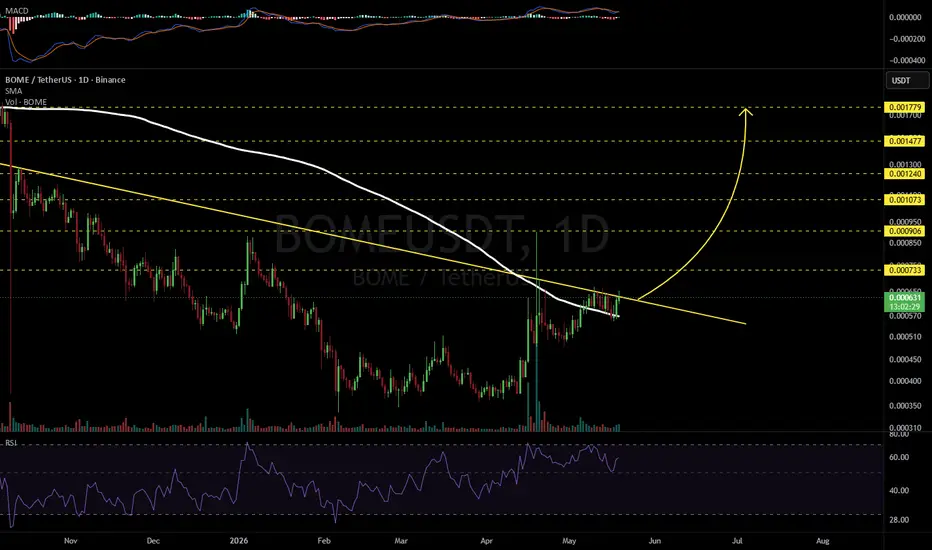
BOMEUSDT 1D#BOME is trading above the daily SMA200 and testing the descending resistance. Consider entering this coin only after a solid breakout above the descending resistance. If confirmed, the potential upside targets are:
🎯 $0.000733
🎯 $0.000906
🎯 $0.001073
🎯 $0.001240
🎯 $0.001477
🎯 $0.001779
⚠️ Always
BOMEUSDT — Downtrend Pressure vs Potential Major Breakout!On the 3D timeframe, BOME/USDT is still within a strong downtrend structure, clearly defined by a long Descending Trendline (yellow line). Price continues to form lower highs & lower lows, but is now showing early signs of recovery from the bottom area.
There are also several key horizontal zones (
BOMEUSDT Forming Bullish MomentumBOMEUSDT is forming a clear bullish momentum pattern, a classic bullish wave signal that often indicates an upcoming breakout. The price has been consolidating within a narrowing range, suggesting that selling pressure is weakening while buyers are beginning to regain control. With consistent volume
See all ideas
Summarizing what the indicators are suggesting.
Oscillators
Neutral
SellBuy
Strong sellStrong buy
Strong sellSellNeutralBuyStrong buy
Oscillators
Neutral
SellBuy
Strong sellStrong buy
Strong sellSellNeutralBuyStrong buy
Summary
Neutral
SellBuy
Strong sellStrong buy
Strong sellSellNeutralBuyStrong buy
Summary
Neutral
SellBuy
Strong sellStrong buy
Strong sellSellNeutralBuyStrong buy
Summary
Neutral
SellBuy
Strong sellStrong buy
Strong sellSellNeutralBuyStrong buy
Moving Averages
Neutral
SellBuy
Strong sellStrong buy
Strong sellSellNeutralBuyStrong buy
Moving Averages
Neutral
SellBuy
Strong sellStrong buy
Strong sellSellNeutralBuyStrong buy
Displays a symbol's price movements over previous years to identify recurring trends.