BOME/USDT (1h) Testing Support Inside a Descending TriangleBOME/USDT is consolidating inside a descending triangle on the 1H chart, with price forming a sequence of lower highs beneath the descending resistance while repeatedly testing the horizontal support around $0.00101–$0.00102.
Price is now sitting directly on this support near the apex. The repeated touches of the lower boundary are important — each test can weaken the support, increasing the risk of a bearish breakdown.
A confirmed 1H close below $0.00101 could validate the bearish setup and ope
In-depth trading ideas
BOOK OF MEME (BOME) Long-Term: 638% - 1,180% Profits Potential Pre-April 2025, BOMEUSDT was moving within a strong decline. A low was settled around 0.00089 followed by a multiple months long relief rally then a bearish continuation. A full-blown bearish wave.
September 2026 is much different to April 2025. BOMEUSDT ended its downtrend, decline and bearish cycle, 2-Feb 2026. This date produced the final bear-market bottom and low around $0.000337. Afterward, we see a recovery, increasing volume and, after a retrace, now a potential bullish continuation as
BOME Testing Descending Trendline — Breakout or Rejection?📉 BOME remains within a long-term bearish structure, characterized by a Descending Trendline that has been controlling price since the previous major high.
However, there are some interesting developments in the current structure:
🔹 Price has established a strong rebound from the 0.0003376 area.
🔹 After forming a base near the lows, BOME has started creating higher lows during its recovery phase.
🔹 Price is now testing the Descending Trendline, which represents the key dynamic resistance.
🔹 Th
BOMEUSDT Forming Bullish MomentumBOMEUSDT is forming a clear bullish momentum pattern, a classic bullish reversal signal that often indicates an upcoming breakout. The price has been consolidating within a narrowing range, suggesting that selling pressure is weakening while buyers are beginning to regain control. With consistent volume confirming accumulation at lower levels, the setup hints at a potential bullish breakout soon. The projected move could lead to an impressive gain of around 50% to 60% once the price breaks above
#BOME Strong Volume Surge – 55%+ Upside Loading…🔥 #BOME Strong Volume Surge – 55%+ Upside Loading… 🚀📈
ECONOMICS:BOME (BOOK OF MEME) is experiencing a massive volume inflow on the 1D chart! Price action has surged past local resistance levels, setting up a strong bullish continuation wave towards major targets.
When meme coins combine high volume with clean technical structure, the expansions can be swift! 🎯
📊Technical Snapshot:
• Timeframe: 1-Day (1D) Chart
• Pattern: Strong Bullish Expansion / Local Resistance Breakout
• Current Price:
BOME Reclaims Key Level After Choppy Correction — Buyers Steppin#BOME
After a period of volatility and correction, BOME has reacted off support once again and is now trading above the key $0.00095 zone.
🔹 Timeframe: 1D
📍 Entry Zones:
✔️ Step 1: 0.0009531
✔️ Step 2: 0.0007774
🎯 Targets:
➕ 0.00120
➕ 0.00140
➕ 0.00156
⚠️ A confirmed close below $0.00069 would invalidate this scenario
BOME/USDT (4h) Approaching a Breakout From a Symmetrical TrianglBOME/USDT has been consolidating inside a large symmetrical triangle on the 4H chart, with price forming lower highs beneath descending resistance while gradually maintaining higher lows along the rising support. The structure has tightened significantly, and price is now trading very close to the apex around $0.00085–$0.00087.
A confirmed breakout and hold above the upper trendline could trigger a strong bullish expansion toward the $0.00150 resistance area, with the full measured move extendi
BOME Bulls Are Finally Showing StrengthBOME is trading within a descending broadening wedge, with price showing a strong reaction from the lower boundary and breaking out of the recent internal consolidation.
The immediate test is 0.0015514 resistance. A clean breakout above this level could strengthen the bullish reversal and expose the HTF supply zone, with the broader projected setup target around 0.0903.
Bullish invalidation: 0.000397
WESLAD Research
Probability Over Prediction.
BOME the accumulation range has officially endedBOME / USDT
Strong breakout volume yesterday as BOME broke out of its accumulation range.
The move has been very aggressive, but the main question now is: where are the potential destinations?
I’ve highlighted the possible resistance zones where this move could face selling pressure.
⚠️ BOME is currently in a strong FOMO phase, so chasing the move can be risky.
1- If you’re already in, follow this chart for updates.
2- If you’re looking for a new entry, consider using well managed /sma
Massive reversal pattern in BOMEHello Traders!
There is a massive reversal pattern in BOME so we are redy to short it from here.
Short Bome from 0.00141
Stoploss 0.001526(-8.5%)
Target 0.0008651 (+38%)
My goal is to be recognized as one of the highest win-rate traders in the TradingView community. :)
Trade Analysis Based on
> Fibonacci Tool (A1000x Way) – Custom Fibonacci approach for precise market analysis
> Candlestick Patterns – Strong price action confirmation through key candle formations
> A1000x Breakout Strate
$BOMEUSDT| 1H | SELL SETUP |BINANCE:BOMEUSDT rejected supply. Next stop: $0.0007. 👋
What are your thoughts on BINANCE:BOMEUSDT right now?
Looking at the chart, BOME is showing a classic supply rejection pattern after a sharp impulse move. Price rallied hard from the demand zone, tagged a high, and got rejected — that kind of move often signals sellers stepping back in before any further upside is trusted.
The key level here is $0.0012413. This lines up with the selling order block between $0.0012438 and $0.0012829, a
BOME PERPETUAL TRADE SELL SETUP Short from $0.0012600BOME PERPETUAL TRADE
SELL SETUP
Short from $0.0012600
Currently $0.0012600
Targeting $0.0011200 or Down
(Trading plan IF BOME
go up to $0.0015 will add more shorts)
Follow the notes for updates
In the event of an early exit,
this analysis will be updated.
Its not a Financial advice
$BOME – Bearish Diamond Top + Anti-Crab at Golden Zone & POCVery interesting confluence zone forming on ECONOMICS:BOME right now.
We have a bearish Diamond Top pattern combining with an Anti-Crab harmonic, and both are aligning with the Golden Zone and the Point of Control (POC).
This creates a high-probability area that is calling for a short entry.
Of course, price action confirmation is still needed, but the technical confluence here is strong enough that I already have my entry planned.
Will be monitoring the reaction closely at this zone.
Wha
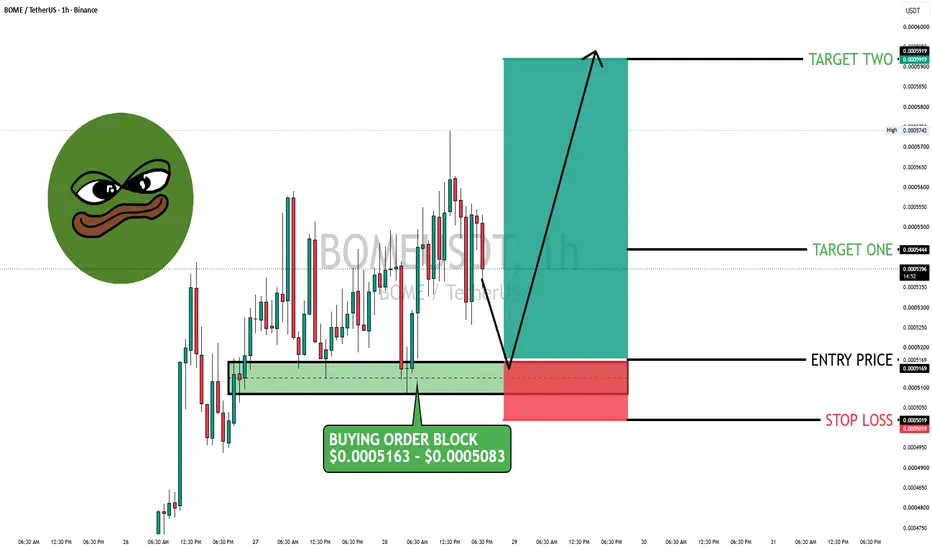
BOME's -2.23% pullback isn't random !BINANCE:BOMEUSDT 's -2.23% pullback isn't random — it's landing on the same $0.0005163–$0.0005083 zone that flipped this thing bullish last time.
News snapshot: BINANCE:BOMEUSDT (Book of Meme) has no formal roadmap or utility beyond speculation and transferability, per its own whitepaper — this move is purely technical, tracking broader memecoin and Solana sentiment rather than any project-specific news. No fresh catalyst in the last 24h; today's action is a straightforward pullback.
Bias: N
BOMEUSDT Forming Bullish MomentumBOMEUSDT is forming a clear bullish momentum pattern, a classic bullish wave signal that often indicates an upcoming breakout. The price has been consolidating within a narrowing range, suggesting that selling pressure is gradually weakening while buyers are beginning to regain control. With consistent trading volume confirming accumulation at lower levels, the current setup hints at a potential bullish breakout in the near future. The projected move could lead to an impressive gain of around 50
BOME / BOMEUSDT Bullish Setup | Futures Trade IdeaMARKET ANALYSIS
BOME is currently reacting from a key technical area highlighted on the chart.
As long as the protected support zone remains intact, the bullish market structure remains valid and higher liquidity targets may continue to attract price action.
A breakdown below the invalidation level would weaken the current bullish scenario and require a reassessment of market conditions.
📍 Entry, Stop Loss and Take Profit levels are marked directly on the chart.
━━━━━━━━━━━━━━
⚠️ DISCL
BOMEUSDT – Descending TrendLine Becomes the Decision Point!On the 3-Day (3D) timeframe, BOMEUSDT remains in a medium-to-long-term downtrend structure, highlighted by a major Descending TrendLine 🔻 connecting a series of lower highs since early 2025.
Price is currently trading near a major support area while once again approaching the primary trendline resistance. This zone represents a critical decision area ⚠️ that could determine whether BOME enters a new accumulation and reversal phase 🔄 or continues its broader bearish trend 📉.
---
📐 Pattern Stru
BOOK OF MEME (BOME) Has Huge Growth Potential—1,145%The market always offers a second chance...
BOMEUSDT (BOOK OF MEME) is back within the sideways range while keeping a higher low compared to 6-February. After February higher lows are present in April and now June and this is pretty interesting.
The initial bullish breakout was corrected, a retrace, and this retrace creates a beautiful, powerful and potentially highly profitable chart. Any doubts?
Can BOME continue crashing and move lower? Yes, absolutely.
Now, let me reply with a counter-qu
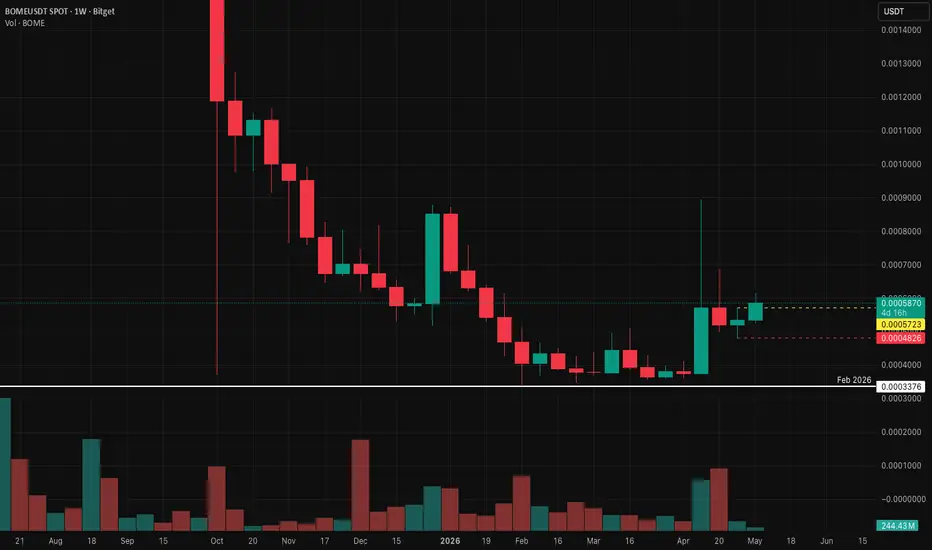
May 6, 2026 BOME. The time to go long has come.- Exchange: Bitget
- Instrument: BITGET:BOMEUSDT
- Timeframe: Weekly
- Trade type: Buy stop order
- Price: 0.0005723
- Take Profit: Open
- Stop Loss: 0.0004826 (-15.80 %)
Idea: Long on a breakout above last week's high — bullish momentum continuation.
Entry: Buy stop above last week’s high.
Stop-loss: Below the low of the same candle. A pullback below this level invalidates the trade.
Take Profit: Trailing stop following the lows of new weekly candles.
This is not an individual investment
BOOK OF MEME (BOME): Update & Bullish ContinuationBOMEUSDT did its breakout mid-April. Just a quick mention: the same pattern of a low in February followed by some accumulation before this breakout is present here.
The breakout is coupled with really high volume and this the main signal that supports what happens next, a bullish continuation.
Just weeks ago, mentioning a bullish continuation was still doubtful, for many. Now, it is as clear as a cloudless day. Everybody agrees; we can all see; Crypto is going up; long-term growth.
Now, after
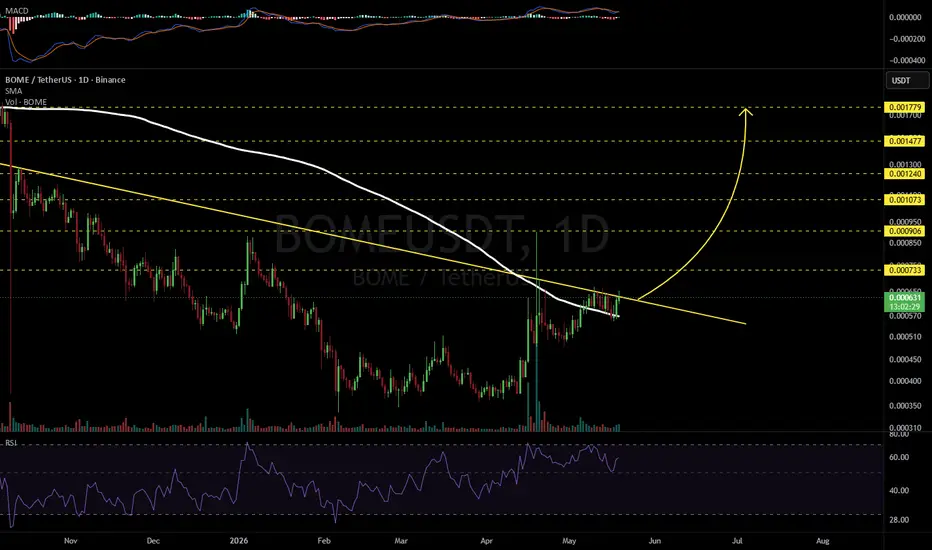
BOMEUSDT 1D#BOME is trading above the daily SMA200 and testing the descending resistance. Consider entering this coin only after a solid breakout above the descending resistance. If confirmed, the potential upside targets are:
🎯 $0.000733
🎯 $0.000906
🎯 $0.001073
🎯 $0.001240
🎯 $0.001477
🎯 $0.001779
⚠️ Always remember to use a tight stop-loss and maintain proper risk management.
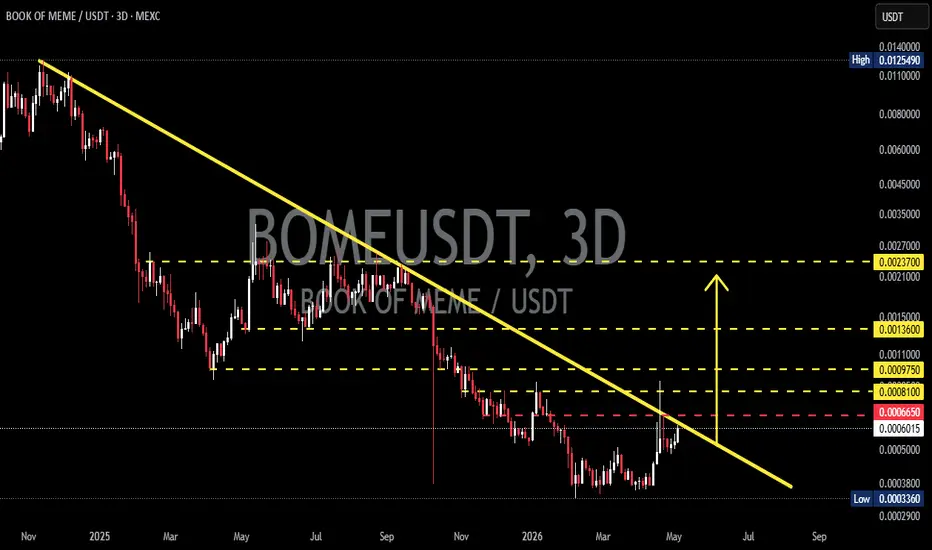
BOMEUSDT — Downtrend Pressure vs Potential Major Breakout!On the 3D timeframe, BOME/USDT is still within a strong downtrend structure, clearly defined by a long Descending Trendline (yellow line). Price continues to form lower highs & lower lows, but is now showing early signs of recovery from the bottom area.
There are also several key horizontal zones (yellow dashed lines) acting as important support & resistance levels.
---
📐 Structure & Pattern
🔻 Descending Trendline (Major Resistance)
This has been the main barrier since the beginning of the