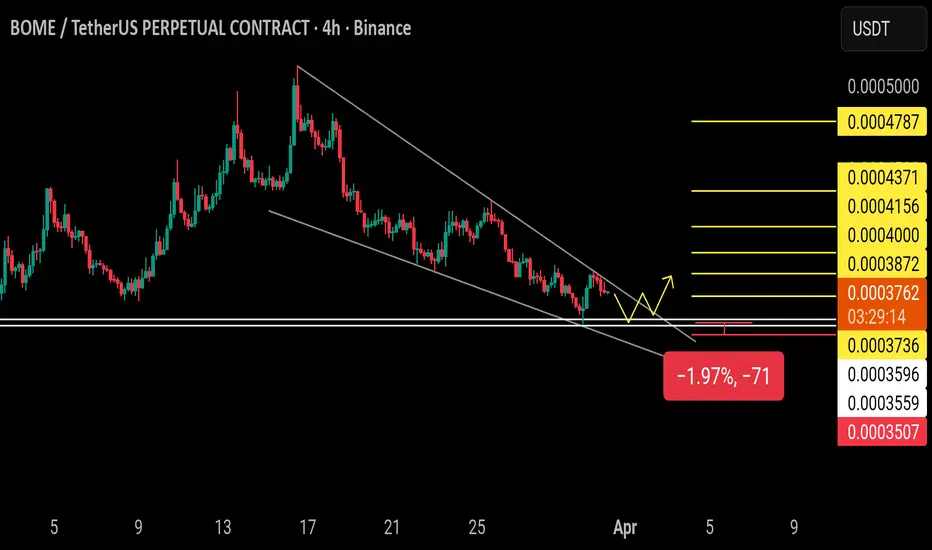
BOMEUSDT Forming Bullish MomentumBOMEUSDT is forming a clear bullish momentum pattern, a classic bullish wave signal that often indicates an upcoming breakout. The price has been consolidating within a narrowing range, suggesting that selling pressure is gradually weakening while buyers are beginning to regain control. With consistent trading volume confirming accumulation at lower levels, the current setup hints at a potential bullish breakout in the near future. The projected move could lead to an impressive gain of around 50% to 60% once the price breaks above the key resistance level.
This bullish momentum pattern is typically seen at the end of downtrends or corrective phases, representing a potential shift in market sentiment from bearish to bullish. Traders closely watching BOMEUSDT are noticing strengthening momentum as the price approaches a critical breakout zone. Strong trading volume adds confidence to this setup, showing that market participants are positioning early in anticipation of a sustained upward move.
Growing investor interest in BOMEUSDT reflects increasing confidence in the project's long-term fundamentals and its improving technical outlook. If the breakout is confirmed with sustained buying volume, it could mark the beginning of a fresh bullish leg. The ongoing consolidation phase suggests steady accumulation, creating favorable conditions for a strong continuation rally once the resistance level is cleared.
Traders may find this an attractive medium-term opportunity, especially as the bullish momentum pattern nears completion and buying pressure continues to build. A confirmed breakout could attract additional market participation and accelerate the move toward the projected upside target.
✅ Show your support by hitting the like button.
✅ Leaving a comment below! (What is You opinion about this Coin)
Your feedback and engagement keep me inspired to share more insightful market analysis with you!
In-depth trading ideas
BOME / BOMEUSDT Bullish Setup | Futures Trade IdeaMARKET ANALYSIS
BOME is currently reacting from a key technical area highlighted on the chart.
As long as the protected support zone remains intact, the bullish market structure remains valid and higher liquidity targets may continue to attract price action.
A breakdown below the invalidation level would weaken the current bullish scenario and require a reassessment of market conditions.
📍 Entry, Stop Loss and Take Profit levels are marked directly on the chart.
━━━━━━━━━━━━━━
⚠️ DISCLAIMER
This publication is provided solely for educational and market observation purposes.
Nothing contained in this analysis should be considered financial advice, investment advice, or a recommendation to buy or sell any financial instrument.
All trading and investment decisions remain solely the responsibility of the individual trader.
Always conduct your own research and apply proper risk management before entering any position.
━━━━━━━━━━━━━━
🎯 PARALOG
▪️Crypto Market Analysis
▪️BTC Futures Signals
▪️Bitcoin & Altcoin Market Analysis
Precision • Momentum • Timing
━━━━━━━━━━━━━━
Exchange: #MEXC Futures
#bitcoin #btc #crypto #futures #technicalanalysis
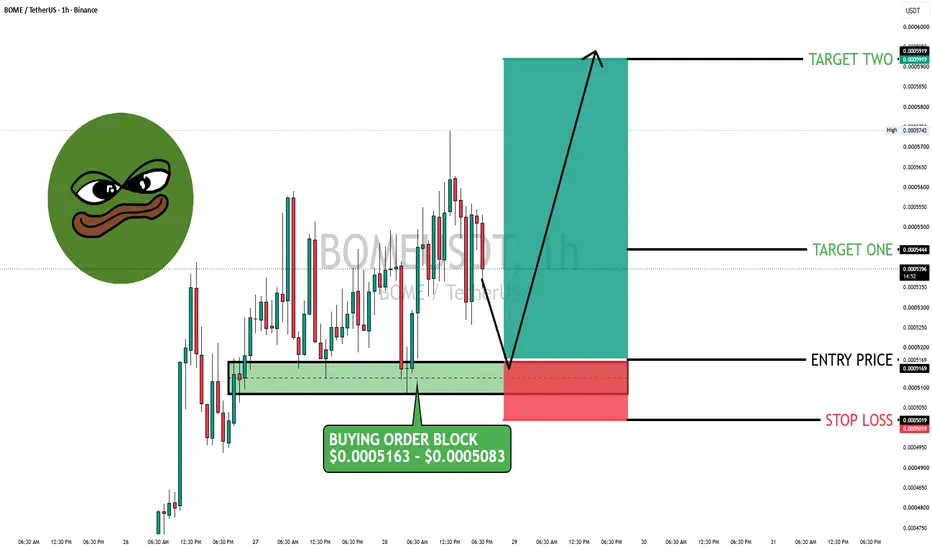
BOME's -2.23% pullback isn't random !BINANCE:BOMEUSDT 's -2.23% pullback isn't random — it's landing on the same $0.0005163–$0.0005083 zone that flipped this thing bullish last time.
News snapshot: BINANCE:BOMEUSDT (Book of Meme) has no formal roadmap or utility beyond speculation and transferability, per its own whitepaper — this move is purely technical, tracking broader memecoin and Solana sentiment rather than any project-specific news. No fresh catalyst in the last 24h; today's action is a straightforward pullback.
Bias: Neutral-to-bullish, pending confirmation. BOME is down 2.23% today to $0.0005388, retreating from a recent high near $0.000574 and drifting back toward its $0.0005163–$0.0005083 order block — a zone that previously acted as support before this run-up.
Levels:
📍 Entry: $0.0005169
🛑 SL: $0.0005019 (-2.90%)
🎯 TP1: $0.0005444 (+5.32%, ~1.8:1 R:R)
🎯 TP2: $0.0005919 (+14.52%, ~5:1 R:R)
Analysis: This is a retest setup — price hasn't tagged the order block yet. Entering before the zone is actually retested is chasing a level, not trading it. Wait for the wick into the box before committing.
Risk tip: Common mistake with low-cap memecoins: sizing a position like BOME the same as a blue-chip. It isn't — 69B token supply, no utility, and volatility that can blow through a stop in minutes. Keep risk to 1-2% of account and confirm the bounce before adding size.
Not financial advice, DYOR.
#BOME #Solana #Memecoin
BOMEUSDT – Descending TrendLine Becomes the Decision Point!On the 3-Day (3D) timeframe, BOMEUSDT remains in a medium-to-long-term downtrend structure, highlighted by a major Descending TrendLine 🔻 connecting a series of lower highs since early 2025.
Price is currently trading near a major support area while once again approaching the primary trendline resistance. This zone represents a critical decision area ⚠️ that could determine whether BOME enters a new accumulation and reversal phase 🔄 or continues its broader bearish trend 📉.
---
📐 Pattern Structure
🔻 Descending TrendLine
The primary pattern on this chart is a Descending TrendLine Resistance, which has capped price action for several months.
Pattern Characteristics:
✅ Consistent formation of lower highs
✅ Sellers continue to dominate the larger market structure
✅ Selling pressure appears to be weakening as price approaches the apex
✅ Breakout probability increases as price reaches the end of the trendline
💡 The longer a trendline remains respected by the market, the stronger the potential move once a breakout occurs.
---
🎯 Key Resistance Levels
The chart highlights several important resistance targets:
🔸 0.0006200
🔸 0.0008100
🔸 0.0009750
🔸 0.0013600
🔸 0.0023700
🚀 These levels may serve as sequential upside targets if a confirmed breakout takes place.
---
🟢 Bullish Scenario
A bullish outlook begins to gain validation if:
✔️ Price successfully holds above the current support zone
✔️ A breakout and candle close occur above the Descending TrendLine
✔️ Volume expands during the breakout
If the breakout is confirmed, potential upside targets include:
🎯 Target 1: 0.0006200
🎯 Target 2: 0.0008100
🎯 Target 3: 0.0009750
🎯 Target 4: 0.0013600
🎯 Target 5: 0.0023700
📈 From the current price area to the highest resistance target shown on the chart, the upside potential is significant, especially if the broader cryptocurrency market remains supportive.
🔥 A breakout from a long-term trendline often serves as the catalyst for a strong trend reversal and sustained bullish momentum.
---
🔴 Bearish Scenario
The bearish outlook remains dominant as long as price continues trading below the Descending TrendLine.
Bearish Confirmation:
❌ Failure to break above the trendline
❌ Strong rejection from resistance levels
❌ Breakdown below the 0.0003360 support area
If this support is lost, BOME could continue its downtrend and establish new lows before finding another accumulation zone 📉.
⚠️ Until a valid breakout is confirmed, traders should remain cautious of potential fake breakouts and further downside pressure.
---
📈 Conclusion
BOMEUSDT is currently approaching a very interesting technical stage 👀 as price moves toward the apex of a major Descending TrendLine that has restricted upward movement for months.
🎯 The current area can be viewed as a Major Decision Zone.
🟢 A confirmed breakout could trigger a structural shift from bearish to bullish.
🔴 On the other hand, a failed breakout could send price back toward support and extend the existing downtrend.
📌 Traders may want to wait for clear confirmation before taking aggressive positions, as significant market moves often emerge after extended consolidation periods like the one currently visible on this chart.
💬 "The longer the consolidation, the bigger the expansion."
#BOME #BOMEUSDT #BOOKOFMEME #Crypto 🚀 #Cryptocurrency #Altcoin #MemeCoin #TechnicalAnalysis 📊 #TradingView #CryptoTrading #PriceAction #ChartAnalysis #TrendlineBreakout #DescendingTrendline
BOOK OF MEME (BOME) Has Huge Growth Potential—1,145%The market always offers a second chance...
BOMEUSDT (BOOK OF MEME) is back within the sideways range while keeping a higher low compared to 6-February. After February higher lows are present in April and now June and this is pretty interesting.
The initial bullish breakout was corrected, a retrace, and this retrace creates a beautiful, powerful and potentially highly profitable chart. Any doubts?
Can BOME continue crashing and move lower? Yes, absolutely.
Now, let me reply with a counter-question. Why would BOMEUSDT continue lower when the current drop stopped short of challenging the main support? If the market was set to continue much lower, then we would at the least challenge the previous low or lower. Second, trading volume is non-existent on the drop, which reveals a lack of sellers.
Sellers had control of the market for years. Just the portion shown on this chart is one year long, all bearish. At one point, bearish momentum dries out, the market becomes neutral, sideways at the bottom and then changes course. This is what we are witnessing and what we are expecting.
Notice that while no lower lows are present we indeed have a higher high. Notice that sell volume is extremely low on the drop vs buy volume being extremely high on the rise. These signals reveal a hidden bullish bias. "Hidden" because sideways is neutral but what direction will the market take once the sideways period is over?
BOMEUSDT is set to grow.
Thank you for reading.
Namaste.
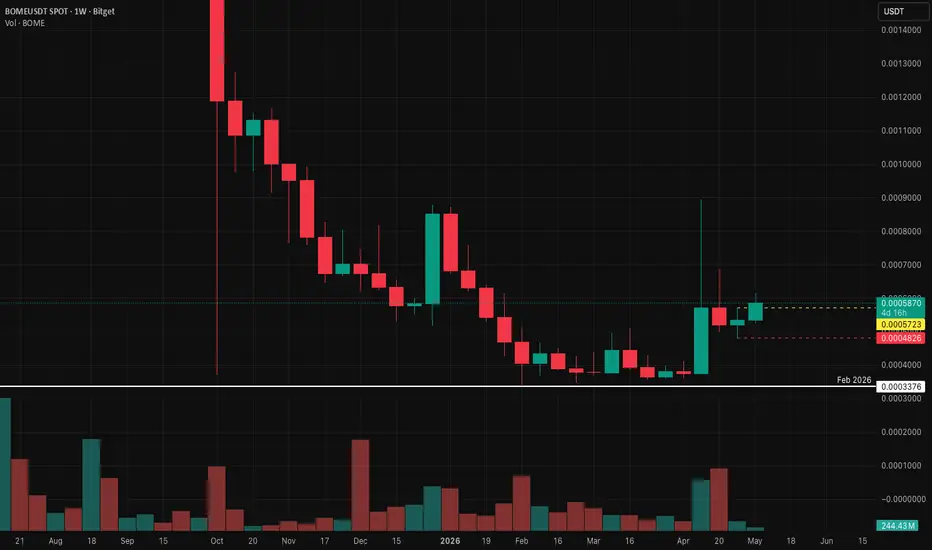
May 6, 2026 BOME. The time to go long has come.- Exchange: Bitget
- Instrument: BITGET:BOMEUSDT
- Timeframe: Weekly
- Trade type: Buy stop order
- Price: 0.0005723
- Take Profit: Open
- Stop Loss: 0.0004826 (-15.80 %)
Idea: Long on a breakout above last week's high — bullish momentum continuation.
Entry: Buy stop above last week’s high.
Stop-loss: Below the low of the same candle. A pullback below this level invalidates the trade.
Take Profit: Trailing stop following the lows of new weekly candles.
This is not an individual investment recommendation.
BOOK OF MEME (BOME): Update & Bullish ContinuationBOMEUSDT did its breakout mid-April. Just a quick mention: the same pattern of a low in February followed by some accumulation before this breakout is present here.
The breakout is coupled with really high volume and this the main signal that supports what happens next, a bullish continuation.
Just weeks ago, mentioning a bullish continuation was still doubtful, for many. Now, it is as clear as a cloudless day. Everybody agrees; we can all see; Crypto is going up; long-term growth.
Now, after the mid-April breakout the market turns sideways. This is extremely positive and shows that additional growth is the most likely scenario. On a bearish market, any type of advance, pullback/inverted correction gets quickly erased. In this case, we are seeing how the ground gained is being maintained.
What I see here is true for other projects, we can easily expect higher prices. I could go on with supporting data from multiple indicators and charts, but this is unnecessary. You and I we both know Crypto is going up.
I realized earlier that for some it might be still early, confirmation is nowhere to be found for them. I understand, you also need to understand that we track the market daily and that's why even small moves results in very strong confirmations. For the majority, when the confirmation comes, the market will already be overbought.
The bottom happened in February, in some cases October 2025, and some people are still wondering if we are going up. There is no need to wonder, just read my posts.
Namaste.
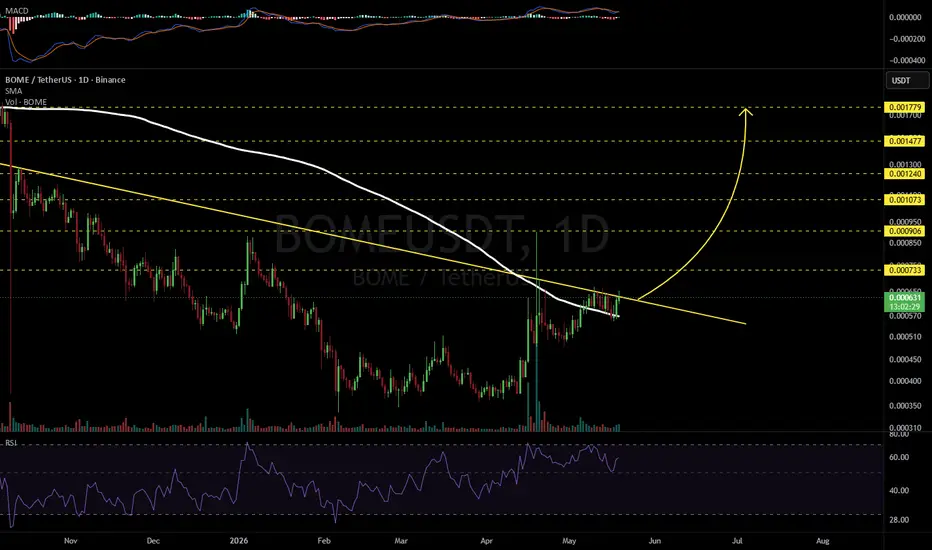
BOMEUSDT 1D#BOME is trading above the daily SMA200 and testing the descending resistance. Consider entering this coin only after a solid breakout above the descending resistance. If confirmed, the potential upside targets are:
🎯 $0.000733
🎯 $0.000906
🎯 $0.001073
🎯 $0.001240
🎯 $0.001477
🎯 $0.001779
⚠️ Always remember to use a tight stop-loss and maintain proper risk management.
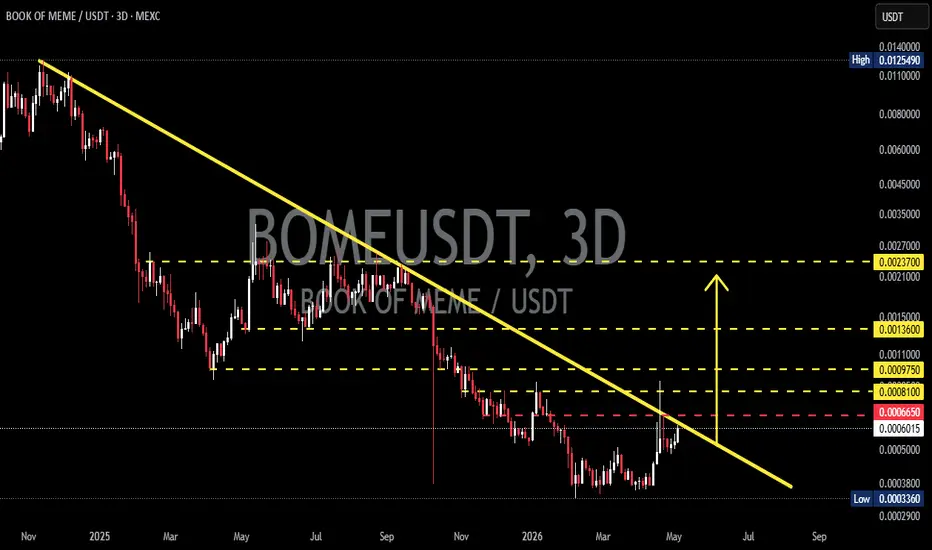
BOMEUSDT — Downtrend Pressure vs Potential Major Breakout!On the 3D timeframe, BOME/USDT is still within a strong downtrend structure, clearly defined by a long Descending Trendline (yellow line). Price continues to form lower highs & lower lows, but is now showing early signs of recovery from the bottom area.
There are also several key horizontal zones (yellow dashed lines) acting as important support & resistance levels.
---
📐 Structure & Pattern
🔻 Descending Trendline (Major Resistance)
This has been the main barrier since the beginning of the downtrend. Price has been rejected multiple times from this area.
📊 Consolidation Range / Base Formation
Price formed a base around the low area (~0.00033 – 0.00050), indicating possible accumulation.
🔄 Potential Reversal Structure
Price is currently rising and approaching the trendline → early signal of a possible breakout attempt.
---
🔑 Key Levels
🟥 Nearest Resistance: 0.0006650
🟨 Next Resistance Zones:
0.0008100
0.0009750
0.0013600
0.0023700 (major resistance)
🟦 Strong Support:
0.0005000 – 0.0003800
0.0003360 (major low)
---
🚀 Bullish Scenario
If price manages to:
✅ Break and close above the Descending Trendline
✅ Break above 0.0006650
Then potential moves:
🎯 Target 1: 0.0008100
🎯 Target 2: 0.0009750
🎯 Target 3: 0.0013600
🎯 Major Target: 0.0023700
📌 A breakout above the trendline is a strong signal of a potential trend reversal, which could trigger a significant rally.
---
⚠️ Bearish Scenario
If price:
❌ Fails to break the trendline
❌ Gets rejected around 0.0006650
Then possible outcomes:
🔻 Pullback toward:
0.0005000
0.0003800
🔻 Potential retest of 0.0003360 low
📌 As long as no breakout occurs, the structure remains a valid downtrend continuation.
---
🧩 Conclusion
BOMEUSDT is currently at a critical decision area:
Breakout → potential bullish reversal
Rejection → continuation of the downtrend
The trendline remains the key determinant for the next major move.
#BOMEUSDT #CryptoAnalysis #TechnicalAnalysis #DescendingTrendline #BreakoutSetup #Altcoin #TradingView #SupportResistance #BullishScenario #BearishScenario #CryptoTrading #PriceAction #TrendReversal
BOMEUSDT Forming Bullish MomentumBOMEUSDT is forming a clear bullish momentum pattern, a classic bullish wave signal that often indicates an upcoming breakout. The price has been consolidating within a narrowing range, suggesting that selling pressure is weakening while buyers are beginning to regain control. With consistent volume confirming accumulation at lower levels, the setup hints at a potential bullish breakout soon. The projected move could lead to an impressive gain of around 60% to 70% once the price breaks above the wedge resistance.
This bullish momentum pattern is typically seen at the end of downtrends or corrective phases, and it represents a potential shift in market sentiment from bearish to bullish. Traders closely watching BOMEUSDT are noting the strengthening momentum as it nears a breakout zone. The good trading volume adds confidence to this pattern, showing that market participants are positioning early in anticipation of a reversal.
Investors’ growing interest in BOMEUSDT reflects rising confidence in the project’s long-term fundamentals and current technical strength. If the breakout confirms with sustained volume, this could mark the start of a fresh bullish leg. Traders might find this a valuable setup for medium-term gains, especially as the wedge pattern completes and buying momentum accelerates.
✅ Show your support by hitting the like button and
✅ Leaving a comment below! (What is your opinion about this coin?)
Your feedback and engagement keep me inspired to share more insightful market analysis with you!
#BOME#BOME has successfully broken out of a falling wedge pattern 🚀 and is currently trading above the breakout level. The chart indicates a potential target around 0.00086 📈 if this bullish momentum continues. Recognizing classic chart patterns can offer valuable insights into future price movements and potential reversals ✨.
#BOME #altcoin #chartpatterns #breakout
BOOK OF MEME (BOME) can start moving right awayIn a way, it is already moving... BOMEUSDT is on its third green day but still at bottom prices. It is early for this pair and Cryptocurrency —meme coin— project.
I don't know why nor how but this one made it into my list, we trade it often. Lately things are good.
There aren't that many wins because the market isn't moving, but there aren't that many loses either. If you look at this chart, you can tell why. There are no new lows. With a lack of a bearish trend, there is nothing to lose other than time; and, time is never lost. Yes, we are waiting and we wait, but the waiting time is what will support a massive bullish wave.
We could be seeing slow and steady growth for months and it would be the same. Say two months growing slowly or two months at bottom prices. If the complete bullish phase lasts five months before a major correction, the first two months would still be a sort of consolidation.
Ok. The wait is over. Forget the past. Enjoy the present, focus on this moment now and prepare for the future, what comes next.
The build-up process is always like this. Three days green, slow, then comes a sudden jump. I see it now on the ETHUSDT and BTC charts.
BOMEUSDT recovered above the October 2025 low and this opens the bullish zone. Five months now fully over and no bearish continuation. The lack of bearish action is the strongest signal of all. The prolonged period of sideways at bottom prices reveals an accumulation phase.
The next move is a major rise. The only question that remains: How far up can it go?
I saw some projects growing 200-300% in the past few days. This can work as an example. Those moving first, haven't been shy, so we can expect strong growth on those that are yet to move.
Thank you for reading.
Namaste.
BOMEUSDT Forming Bullish MomentumBOMEUSDT is forming a clear bullish momentum pattern, a classic bullish reversal signal that often indicates an upcoming breakout. The price has been consolidating within a narrowing range, suggesting that selling pressure is weakening while buyers are beginning to regain control. With consistent volume confirming accumulation at lower levels, the setup hints at a potential bullish breakout soon. The projected move could lead to an impressive gain of around 60% to 70% once the price breaks above the wedge resistance.
This bullish momentum pattern is typically seen at the end of downtrends or corrective phases, and it represents a potential shift in market sentiment from bearish to bullish. Traders closely watching BOMEUSDT are noting the strengthening momentum as it nears a breakout zone. The good trading volume adds confidence to this pattern, showing that market participants are positioning early in anticipation of a reversal.
Investors’ growing interest in BOMEUSDT reflects rising confidence in the project’s long-term fundamentals and current technical strength. If the breakout confirms with sustained volume, this could mark the start of a fresh bullish leg. Traders might find this a valuable setup for medium-term gains, especially as the pattern completes and buying momentum accelerates.
✅ Show your support by hitting the like button and
✅ Leaving a comment below! (What is your opinion about this Coin?)
Your feedback and engagement keep me inspired to share more insightful market analysis with you!
BOMEUSDT - Strong BullBOMEUSDT at 0.0004106 with futures at 0.0004103, a near-zero basis that confirms no directional premium loading. Spot volume 897.7M against futures 13.21B — Fut Lean with S/F dollar ratio 5.43M spot versus 368.59K futures dollars. Futures are running 14x spot in contract volume but dollar exposure is thin, indicating this is a low-conviction futures-dominated tape. Strong Bull reading at 31.78% edge with only 1.93x leverage ratio and Clarity 48.21% — the signal is weak and uncertain.
Signal board 40 green to 14 red out of 112. C>T 8:6, EMA 2:2, Candle 14:0, Ichi TK 7:6, Engulf 5:0, Pat Tot 4:0. DD/SS 1:10 is a severe distribution warning — ten sell or distribution signals against one demand pattern is the most bearish sub-reading in this panel. Squeeze HIGH at 11 bars, BW:18.57% Coiling, Mom Bull but Coiling — the squeeze has been compressing for 11 bars without resolution and is now in coil phase. Sqz shows Spot Fire Real, meaning the spot squeeze has fired but futures have not confirmed. StdDev 4.687% Elevated. Cascade Normal. MeanZ -0.55σ Drift negative.
Spot Z -0.95 Quiet, Futures Z -1.15 Low, Combined -1.22 Low. SpotZ 0:5 falling from -0.95 to -0.69 to -0.27 — the sequence is Rising directionally but from deeply negative territory, not strength. Bull:Bear Z -0.25 to -0.84 Neutral. OBV Z -1.07 with Drift up tick — OBV is negative and only marginally recovering. No whale, no liquidations.
Leverage 14.71x rising, High. Percentile 27% Lower. AT Max 52.89x hit 40 bars ago, AT Min 0.62x at 761 bars. Price at 4.9% Bottom — near historical price floor but leverage is rising into it which is structurally dangerous. Retrace -9.4% Deep, Bounce 14.8% at 1.6x Recovery.
The honest read: price at bottom percentile sitting on demand looks attractive on the surface but the internals are against it. DD/SS 1:10 is distribution-dominant, OBV Z is negative, futures volume is 14x spot with Fut Lean regime, and leverage is rising at 14.71x High while price is at the floor. Spot squeeze fired without futures confirmation is a divergence, not a launch signal. This is a trap setup — demand zone may hold briefly but the volume structure does not support a sustained move. Avoid long exposure until OBV Z turns positive and DD/SS distribution pattern count clears.
Is That Crypto Pump Real? Data Says No. Here's Why.
Stop Losing Money to Fake Volume. Find Real Moves Now.
Trade the REAL Crypto Volume. Stop Getting Faked Out.
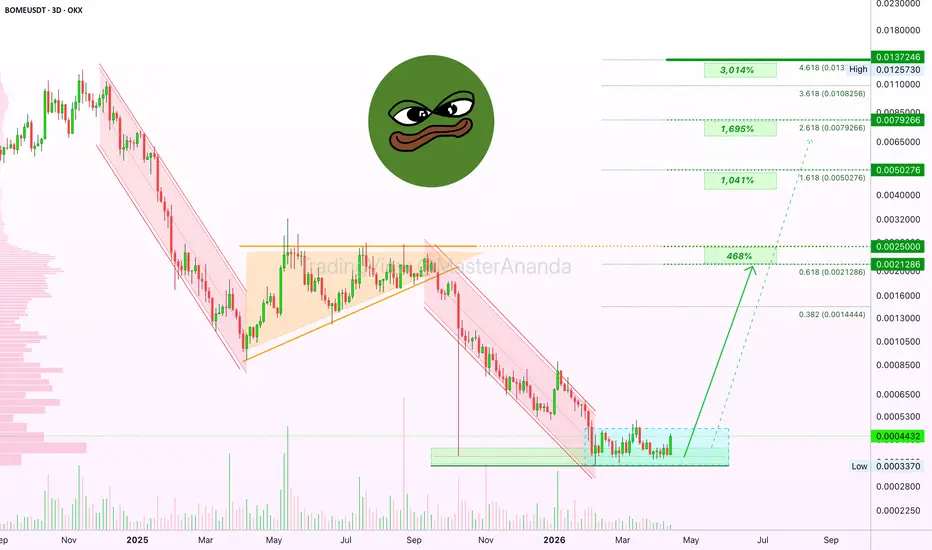
BOOK OF MEME (BOME) has 3,000% profits potential—Price actionBOOK OF MEME has huge growth potential. Notice the three steps pattern on the bear market, this is the same process we will see but in reverse.
BOMEUSDT can produce a strong advance first to find resistance close to the orange triangle pattern. At this level there can be some fluctuations. Sideways with a downward or upward bent, can be several months followed by additional growth.
There can be strong variations to the above scenario. For example: The consolidation period lasts only several weeks rather than several months. Another scenario pierces right through to the 1.618 Fib. extension level with 1,000% and only afterward comes the first correction.
Since this is a meme coin, if it starts to move we should expect a very strong rise followed by a big retrace; high volatility.
The bottom is in and this is the most important aspect of this chart. The October 2025 low—six months ago—has been confirmed and now BOMEUSDT trades within the accumulation zone. Here buying can be done with very low risk as the next move being bullish is high probability.
Notice the huge growth potential on this trading pair. This is true across so many altcoins and for obvious reasons. From the bottom we grow.
Thank you for reading.
Namaste.
BOOK OF MEME enters recovery wave —a major rise is very closeThe bulls are in. Bitcoin is moving straight up. The altcoins market is about to recover. We are witnessing the start of increasing bullish momentum.
The market has been performing poorly, BOMEUSDT is a great example. After hitting bottom in October 2025, a new slow but prolonged bearish wave developed. The same low has been tested again. But there is good news.
After the October 2025 low was tested and confirmed as support, BOMEUSDT started to move sideways. This moving sideways at bottom prices opens up a great opportunity, the "opportunity buy-zone."
This is a price range that becomes available only once or twice per cycle for a few weeks at the most. Once the market turns bullish, this type of chart setup is lost.
It will still be possible to buy and hold, buy and trade; many opportunities, but none will have such low risk and high potential for rewards as we see today.
Only the recovery wave here can produce more than 350% profits—the up-wave. And it is starting now.
BOOK OF MEME starts to recover, same for the other altcoins, it is not too late.
One warning though: Once the market starts to run, it will be sudden and fast; we will experience sustained growth.
Take action. A major rise is very close.
Namaste.
BOME at Major Support Inside Descending ChannelBOME remains inside a long term descending channel and is currently trading directly above a major horizontal support zone. Price has already reacted from this level and is attempting to build a short term higher low structure.
This area is important because it sits at the lower boundary of the channel, where previous downside moves have slowed. As long as this support continues to hold, price may attempt a corrective move toward the mid range of the channel, followed by a potential test of descending resistance.
A clean breakdown below this support would invalidate the recovery attempt and open the door for further downside continuation. This zone should define the next meaningful move.
BOMEUSDT 1,328% profits potential with 5X leverage —LONG tradeMany people like this project and I agree also, the concept looks good. But something even better, this chart setup, it is awesome.
By awesome I mean very, very low risk with a huge potential for reward. Timing is absolutely amazing. It doesn't get any better. You can enter today and be green tomorrow. Truly wonderful.
BOMEUSDT is trading within a higher low compared to the market flush. Also a double-bottom recently. There is high volume on the advance earlier this month and we are good for another round, a higher high comes next.
This is amazing. The Cryptocurrency market is about to go hyper-bullish. This is the best ever!
Excuse my excitement, but you will know what I mean in just a matter of days. In two weeks time, everybody will understand.
Full trade-numbers below:
____
LONG BOMEUSDT
Leverage: 5X
Potential: 1660%
Allocation: 5%
Entry zone: $0.000530 - $0.000590
Targets:
1) $0.000804
2) $0.000985
3) $0.001212
4) $0.001565
5) $0.001748
6) $0.002039
7) $0.002222
8) $0.002511
Stop: Close monthly below $0.000515
____
Thank you for reading. Your continued support is highly appreciated.
This is a high probability chart setup. This is an easy trade. Buy and hold. Once the market starts running, do nothing, just let it grow. When your target hits, take profits and move on.
Namaste.
Will it retest the downtrend line?#BOME
From a structural perspective, we are currently near the resistance zone (S/R), thus facing a risk of pullback.
However, we have broken through the downtrend line, indicating that the downtrend may have ended and the downtrend line will now act as a support line. If the price retests this trend line, it would present a very worthwhile opportunity to go long.
I hope this scenario will happen.
#BOME Potential Bullish Head and Shoulders?📊#BOME Potential Bullish Head and Shoulders?
🧠From a structural perspective, there's a chance a bullish head and shoulders pattern could form here.
➡️The price is currently retracing, and if we can test the S/R, this will be a very worthwhile area to watch for going long.
Let's see 👀
🤜If you like my analysis, please like 💖 and share 💬
BINANCE:BOMEUSDT.P
BOME Reclaim Attempt After Descending Channel BreakBOME spent an extended period trading inside a well-defined descending channel following a sharp sell-off. Price has now broken above the lower channel boundary and is attempting to reclaim structure, signaling a potential shift from pure continuation to a recovery phase.
Currently, price is holding above the recent local support zone around zero point zero zero zero six three. As long as this level is defended, upside continuation toward the mid and upper channel resistance becomes possible, with the next major resistance sitting near zero point zero zero zero eight one.
If price fails to hold this reclaimed area and slips back below the recent support, the move would be classified as a failed reclaim, and continuation toward lower demand zones remains likely.
This setup is driven by descending channel dynamics, support reclaim behavior, and post-break stabilization. Confirmation above reclaimed structure is required before stronger continuation.