BONK — Accumulation Ahead of a Potential BreakoutNot long ago, I started taking a closer look at the cryptocurrency market. My attention was drawn to low-priced coins, one of which is BONK. In my opinion, its price movements can be predicted with a certain degree of accuracy.
Volume and the Volume Delta indicator help me with this analysis. However, indicators alone cannot provide a complete picture of what is happening in the market. Market psychology also plays an important role — how market participants perceive key levels and how they buil
In-depth trading ideas
Bonk - the Lion is getting READYSince September 26, BONK has been consolidating directly beneath the multi-year descending trendline.
We’ve seen repeated attempts to challenge this resistance, with price continuing to compress underneath it. The longer this structure holds, the more interesting the eventual breakout becomes.
A clean breakout + successful retest of the multi-year trendline would be the confirmation I’m watching for.
If the lion finally breaks loose, the move could get aggressive. 🚀
Key idea:
Break the trend
Daily Gann Fan 1x1 to Reference this cycleDaily Gann Fan 1x1 to Reference this cycle
Calculation
high − low = full range:
0.000061000−0.000000268=0.000060732
Bars between them: 529
Price change per bar for the 1×1 line:
0.000060732 / 529 = 0.0000001148
Lock the price-to-bar ratio at 0.0000001
1×1 is the 45° line (1 price unit per bar)
__
Weekly 1x1
Weekly Gann Fan 1x8 to Reference this cycleWeekly Gann Fan 1x8 to Reference this cycle
Calculation
Weekly high − weekly low = full range:
0.000061000−0.000000268=0.000060732
Weekly Calculation
* Weekly low: 0.000000268
* Weekly high: 0.000061000
* Full range: 0.000060732
* Bars between them: 75 (weeks)
Price change per bar for the 1×1 line:
0.000060732 / 75 = 0.0000008097
Lock the price-to-bar ratio at 0.00000080
1×1 is the 45° line (1 price unit per bar)
(1×8 is the 7.5° line (1 price unit per 8 bars)
__
1x1
www.tradingview.com
Bonk Weekly Gann Fan 1x1 to Reference this cycleWeekly Gann Fan 1x1 to Reference this cycle
Calculation
Weekly high − weekly low = full range:
0.000061000−0.000000268=0.000060732
Weekly Calculation
* Weekly low: 0.000000268
* Weekly high: 0.000061000
* Full range: 0.000060732
* Bars between them: 75 (weeks)
Price change per bar for the 1×1 line:
0.000060732 / 75 = 0.0000008097
Lock the price-to-bar ratio at 0.00000080
1×1 is the 45° line (1 price unit per bar)
(1×2 is the 26.25° line (1 price unit per 2 bars)
1x8 www.tradingvi
BONKUSDT Forming Falling WedgeBONKUSDT is forming a clear falling wedge pattern, a classic bullish reversal signal that often indicates an upcoming breakout. The price has been consolidating within a narrowing range, suggesting that selling pressure is weakening while buyers are beginning to regain control. With consistent volume confirming accumulation at lower levels, the setup hints at a potential bullish breakout soon. The projected move could lead to an impressive gain of around 40% to 50% once the price breaks above th
BONK Descending Trendline Under Pressure, Breakout or Rejection?📊 Technical Analysis — CRYPTOCAP:BONK
⏱️ Time Frame: 3D
💱 Pair: BONK/USDT — Binance
📐 Pattern: Descending Trendline
🎯 Key Resistance: $0.00000420 → $0.00000500 → $0.00000560 → $0.00000740
🟢 Higher Resistance: $0.00001200 → $0.00001500
🔴 Major Support: $0.00000222–$0.00000240
---
📐 PATTERN: DESCENDING TRENDLINE
📉 BONK is currently trading below the Descending Trendline, which has formed through a series of Lower Highs (LH) since the major high around $0.00004075.
🔻 The yellow trendline sho
BONK Downtrend Under Pressure — Breakout or Rejection?💵 Coin: SIX:BONK
⏱️ Time Frame: 1D
📉 Pattern: Descending Trendline / Downtrend Structure
📍 Current Price Area: ± 0.00000330
🔻 Descending Trendline Structure
The BONK/USDT chart is still showing a clear downtrend structure, characterized by a series of lower highs connected by the Descending Trendline from the major high around 0.00000774.
As long as price remains below this trendline, bearish pressure remains dominant. However, price is now approaching the trendline again, making this area
BONKUSDT Forming Bullish MomentumBONKUSDT is forming a clear bullish momentum pattern, a classic bullish reversal signal that often indicates an upcoming breakout. The price has been consolidating within a narrowing range, suggesting that selling pressure is weakening while buyers are beginning to regain control. With consistent volume confirming accumulation at lower levels, the setup hints at a potential bullish breakout soon. The projected move could lead to an impressive gain of around 90% to 100% once the price breaks abov
BONK at macro floor: base recovery toward $0.00000374BONK has spent months bleeding from $0.0000070 down to the low $0.000002 range, and price is now pressed right against its structural floor. This is where accumulation setups live — a market that has stopped falling and started building a base.
The Macro Picture 🗺️
The broader trend has been a steady downtrend all summer, but the sell-off has lost momentum near the lows. Macro Resistance sits far overhead at $0.00000831, while price coils just above the level that has held every recent test.
T
BONKUSDT - Critical Support Zone, Breakdown or Reversal?📊 Technical Analysis
💵 Coin: SIX:BONK #BONK
⏰ Time Frame: 6H
📉 Pattern: Bearish Rectangle (Range Consolidation After a Strong Downtrend)
---
📌 Chart Overview
🔻 Strong Downtrend
BONK remains in a dominant bearish trend following an aggressive sell-off.
The market structure continues to form Lower Highs (LH) and Lower Lows (LL), indicating that sellers remain in control.
🟨 Bearish Rectangle Formation
Price is consolidating within a horizontal trading range after a sharp decline.
This s
BONKUSDT Forming Bullish MomentumBONKUSDT is forming a clear bullish momentum pattern, a classic market structure that is showing signs of weakness and may indicate an upcoming drop instead of a breakout. The price has been consolidating within a narrowing range, suggesting that bullish momentum is fading while sellers are gradually beginning to regain control. Despite periods of steady trading volume, the current setup hints that buyers may be losing strength, increasing the possibility of a bearish move if key support levels
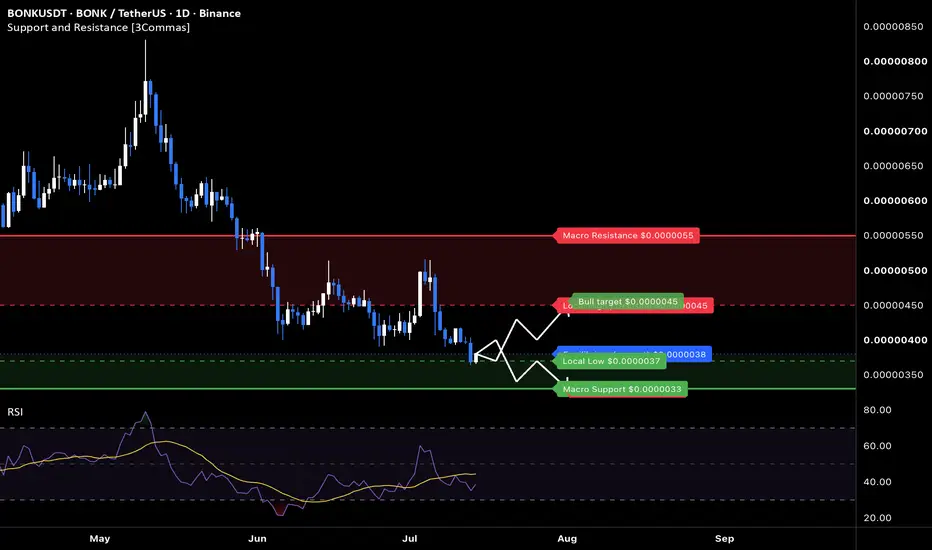
BONK: liquidity sweep before the next leg downThe Macro Picture 🗺️
BONK has been carving a descending structure since the May $0.0000082 peak, printing a clean sequence of lower highs and lower lows. Every rally has been sold — the early-July push to $0.0000052 was the latest lower high, and it was faded hard before price rolled back over. This is a market defined by persistent supply, where each bounce becomes fuel for the next flush. Price now presses fresh lows near $0.0000037 with RSI weak around 38, and the path of least resistance st
Crypto’s Smartest Heist | BONK Governance Just Got RuggedIn the wild west of Solana meme coins, some absolute degen just pulled off one of the cleanest governance heists of the cycle
He bought $4.4 million worth of BONK across Bybit and Binance, accumulated enough voting power to meet the DAO quorum, and then voted in favor of transferring 4.426 trillion BONK (worth about $21.2 million) from the treasury to his own wallet! There were no exploits or smart contract hacks just governance working exactly as designed.
By the time the proposal executed
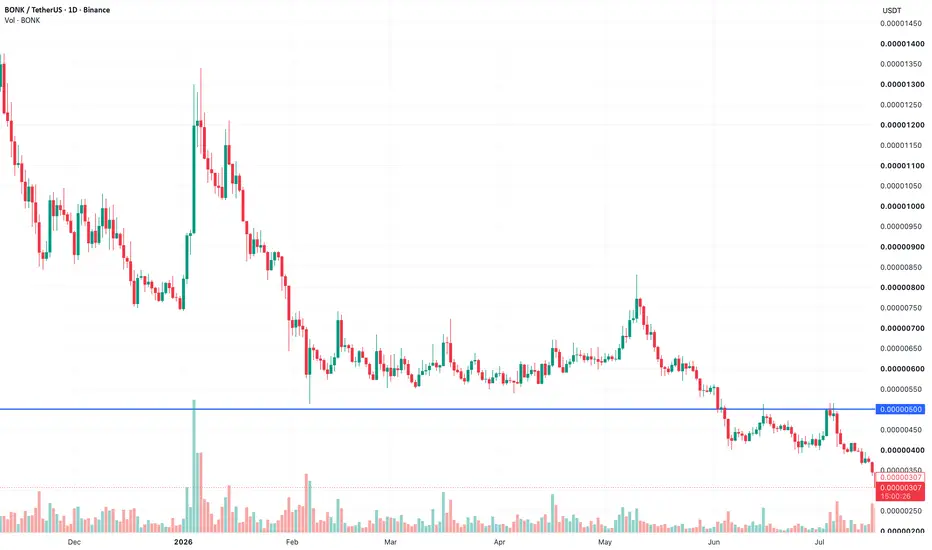
BONK Price Failed Auction ?BONK price action is currently trading at a technically significant inflection point, where the next move could have important implications for the broader market structure. Recent price action has produced multiple daily candle closes below a key daily support level, which is also in technical confluence with the value area low of the current trading range. This combination creates an important region that traders should monitor closely in the coming sessions.
While the breakdown initially app
BONKBONK/USDT 2D Analysis
BONK continues to consolidate in a significant support zone after a long-standing downtrend. As the price has been trying to form a base in the 0.0000045–0.0000055 range for months, this area appears to be acting as a strong demand zone.
The red area marked on the chart has turned into resistance after previously serving as support. Recent attempts to rise have faced selling pressure from this area, and the price has pulled back to the lower band.
When examining the Volu