In-depth trading ideas
BRUSDT — Daily Compression into 1H Base-n-Break Watch⚛️ BR is starting to build one of the cleaner structures on the watchlist.
The daily is not in full expansion yet, but the market state is improving. Price has reclaimed back above the short-term EMA structure and is now holding above the 10/20 while the 50 is starting to act as rising support underneath. That is constructive because BR is no longer sitting in tangled chop below the averages. It is trying to build acceptance above them.
The bigger picture is still a broad range, so I do not want to treat this like a clean trend continuation until price proves it. The main daily resistance zone is still above, with the prior supply/liquidity area sitting around 0.1618 and higher range highs above that. Until BR accepts through that zone, this is still a compression/breakout watch, not a confirmed expansion move.
HTF Context 🔭
BR has already shown it can move aggressively when participation steps in. The daily chart has multiple prior impulse legs, but each one faded back into range. That tells me the upside is there, but follow-through has been inconsistent.
What matters now is the current base.
Price is holding above the daily EMA stack, with the 10/20 starting to support the move and the 50/100/200 sitting underneath as larger structure. This is the kind of location I want to see before a higher timeframe continuation attempt.
Good idea. Decent location. Still needs confirmation.
LTF Structure 🧱
The 1H structure is the cleaner part of the setup.
BR is building a steady series of higher lows and higher highs while surfing the 10/20 EMA. The move is not vertical yet, which is good. It has been grinding higher, compressing near the upper part of the local range, and tightening right below resistance.
That is the classic setup phase:
Location → Compression → Confirmation
The current structure is constructive, but the setup is not live until price breaks and accepts above the local resistance zone. A wick through resistance is not enough. I want to see impulse, acceptance, and follow-through.
Cycle Position ♻️
BR looks like it is moving from a crossback/base phase into a potential Base-n-Break.
The prior impulse reclaimed structure. The pullback held. Now price is basing near the highs instead of rejecting back into the lows. That is usually where continuation traders start watching for expansion.
Cycle read:
Impulse / Reclaim → Crossback Hold → Base Near Highs → Breakout Watch
A clean break above the local 1H range could start the next expansion leg. Until then, it remains a watchlist setup.
Continuation Scenario 🟢
The bullish setup confirms if BR can break and accept above the local resistance area near the current range highs.
What I want to see:
Clean break above the 1H range
Acceptance above resistance, not just a wick
1H candles holding above the breakout zone
EMAs continuing to fan upward
Volume/participation expanding on the move
Price holding the 10/20 on any first pullback after breakout
If that happens, BR can start working toward the next liquidity zone around 0.1618. Above that, the higher range becomes the next area to watch.
The cleaner entry is not chasing the candle. The cleaner setup would be either the breakout with confirmation, or the first pullback that holds the breakout zone and 10/20 structure.
Failure Scenario 🔴
This setup fails if BR loses the current 1H base and starts accepting back below the short-term EMA structure.
The first warning would be a failed breakout or a rejection candle through resistance with no follow-through. The stronger failure would be price losing the 1H 10/20, breaking the higher-low structure, and accepting back below the local base.
If BR loses the current compression area and starts trading back below the 50 EMA on the 1H, the setup shifts from breakout watch to failed continuation / chop tax.
The daily failure scenario is simple:
If price loses the reclaimed daily EMA structure, this becomes another failed range push instead of a real expansion attempt.
Execution Mindset 🎯
BR is not a signal yet.
It is a clean watchlist chart because the structure is improving, the 1H trend is organized, and price is compressing near resistance instead of rejecting away from it.
But the trigger still matters.
No trigger, no trade.
I would rather wait for confirmation above the local range than force an entry inside resistance. If the breakout confirms, then the next pullback becomes the better trade location. If it rejects, the failure scenario matters more than the bullish thesis.
Clean structure beats hype.
Not financial advice. Not a signal. Just how I’m reading structure and participation.
#BR Possible Bullish Bounce The message conveys a strong bullish bias. By placing a long limit , the trader is signaling that they expect any dip into that price area to be bought aggressively rather than leading to further downside.
Crowd Psychology
Bulls are looking for discounted entries.
Market participants sharing this type of call are often expecting liquidity to be swept before a move higher.
The tone suggests optimism and a willingness to hold through short-term volatility.
BR scalp Hedge LONG and SHORTI have trigger orders set both LONG and SHORT... but I AM thinking it will most likely go SHORT in the course of a few hours time. So my SHORT scalp may Swing back down to support
But I will take a 6X LONG scalp back up to the Resistance level if it want to ride back up.
The superguppy trend is NEUTRAL currently.
Let's see what might happen here.
BRUSDT - Deep BullBRUSDT at 0.2038 with futures at 0.2030, an 8-pip basis showing spot leading futures modestly. Spot volume 16.93M against futures 188.24M, Fut Lean with dollar split 38.16M futures versus 3.43M spot — futures are running 11x spot in dollar terms. Deep Bull 64.87% at 4.69x, Clarity 54.46% — the strongest clarity reading across all pairs today, crossing the confidence threshold. Bounce 113% at 61.7x Para — parabolic bounce classification off a shallow 1.8% retrace.
Signal board 43 green to 18 red out of 112, the highest green count in today's session. C>T 10:4, EMA 10:0 all bull — the cleanest EMA read of the day. Candle 9:5, Ichi TK 8:4, Engulf 3:3, DD/SS 2:1, 3Sold 2:0, Pat Tot 3:2. Squeeze ELEVATED 7 bars, BW:76.5% Loosening, Mom Bull — compression is releasing and bandwidth is expanding in the bull direction. Sqz Div Fut Only Spec flagged — futures squeeze is diverging from spot, a speculative signal on the futures side. S.Mom Con up 301.4% Normal — momentum contracting upward, healthy consolidation. MeanZ -0.52σ Drift. Cascade Normal. Prem -0.4% Bkwd Z:-1.4, Yield -435% APY Bull — mild backwardation with bull basis signal.
Spot Z -0.26 Steady, Futures Z 0.02 Average, Combined -0.02 Steady. SpotZ 0:5 sequence -0.26 to -0.25 to -0.01 Falling — spot volume is quietly fading after the initial spike visible on chart. Bull:Bear Z 0.18 to -0.3 Neutral. OBV Z 1.22 Inflow rising — strong OBV reading, sequence 1.22 to 0.92 to 0.3 showing inflow is decelerating from the spike but holding positive. OBV Div Normal. No whale, no liquidations.
Leverage 11.13x rising, High. Percentile 17.9% Floor. AT Max 59.43x at 291 bars ago, AT Min 0.61x at 378 bars. Price at 71.6% Mid — not at a floor like the other pairs today, price is in the middle of its historical range after a near-vertical move from the bottom visible on chart. Retrace only -1.8%, barely pulled back after the explosive move.
The honest read: BR is the strongest setup in today's batch — EMA 10:0, Clarity above 50%, OBV Z 1.22 inflow, squeeze loosening with Bull Mom, and the highest signal green count at 43. The chart confirms it with a parabolic move off historical lows that has barely retraced. The concerns are Fut Lean regime with 11x dollar imbalance, leverage rising at 11.13x High, SpotZ fading, and the futures-only squeeze divergence suggesting speculative futures positioning is driving more of this move than spot. Price at 71.6% Mid means there is room to run but the easy money from the floor is already captured. Hold existing positions with trailing stop, new entries require OBV Z to hold above 1.0 on the next consolidation.
Is That Crypto Pump Real? Data Says No. Here's Why.
Stop Losing Money to Fake Volume. Find Real Moves Now.
Trade the REAL Crypto Volume. Stop Getting Faked Out.
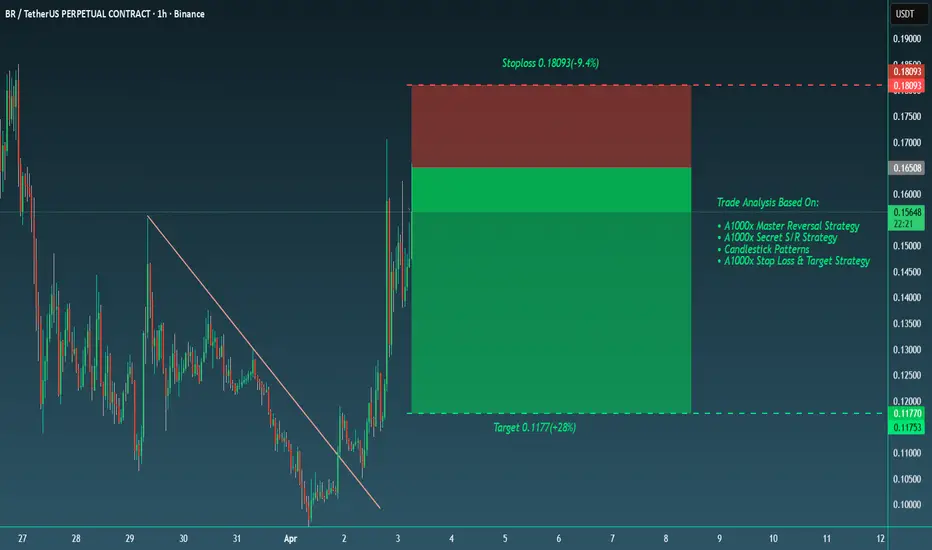
Big Short in BRusdtHello Traders!
This is a beautiful and heavy profitable short in BRusdt. This is a fast moving pair and it will not take to achieve the target.
Target 0.1177(+28%)
Stoploss 0.18093(-9.4%)
My aim is to achieve highest win rate in tradingview trading community :) and we will definitely do that.
Trade Analysis Based On:
• A1000x Master Reversal Strategy
• A1000x Secret S/R Strategy
• Candlestick Patterns
• A1000x Stop Loss & Target Strategy
We trade using carefully developed strategies and disciplined market analysis, always seeking the best possible accuracy while remembering that ultimate success comes only by the will of Allah.
In some trades, you may notice a relatively larger stop loss or a risk-to-reward ratio that may appear unusual at first glance. However, every trade is taken with proper planning and calculated analysis, not random entries.
Before entering any position, we perform detailed calculations and market evaluation. Based on this analysis, we carefully determine our stop loss and target levels.
I personally apply one of my specialized stop-loss and target strategies, designed to place the stop loss at a logical market level where price is less likely to reach before moving toward the intended target — InshaAllah.
Trading always involves risk, but with discipline, patience, and proper strategy, we aim for consistent and responsible decision-making.
Feel free to share your thoughts, leave a comment, or contact me.
Short this pump In BRusudtHello Traders!
After the war situation market is now working fine. In previous trade market was no moving with perfection but i now market looks good to enter. We are shorting after that pump in BR.
Stoploss 0.1612(-9%)
Target 0.1206(+18%)
My aim is to achieve highest win rate in tradingview trading community :) and we will definitely do that.
Trade Analysis Based On:
• A1000x Master Reversal Strategy
• A1000x Secret S/R Strategy
• Candlestick Patterns
• A1000x Stop Loss & Target Strategy
We trade using carefully developed strategies and disciplined market analysis, always seeking the best possible accuracy while remembering that ultimate success comes only by the will of Allah.
In some trades, you may notice a relatively larger stop loss or a risk-to-reward ratio that may appear unusual at first glance. However, every trade is taken with proper planning and calculated analysis, not random entries.
Before entering any position, we perform detailed calculations and market evaluation. Based on this analysis, we carefully determine our stop loss and target levels.
I personally apply one of my specialized stop-loss and target strategies, designed to place the stop loss at a logical market level where price is less likely to reach before moving toward the intended target — InshaAllah.
Trading always involves risk, but with discipline, patience, and proper strategy, we aim for consistent and responsible decision-making.
Feel free to share your thoughts, leave a comment, or contact me.
Blowoff Band width, Bounce Tagged BOBRUSDT spot volume at 37.8M versus futures at 177.5M — a 4.7x futures-to-spot ratio. Dollar value 5.59M spot against 26.27M futures. Not ghost market territory but futures are clearly driving this instrument. Spot dollar participation is thin relative to the futures-side positioning, meaning price movement here is leveraged bid, not organic accumulation.
41 of 112 signals green, 22 red. Bias reads Strong BULL at 34.02% conviction, 2.03x — shallow conviction for a bull tag. EMA split 5 to 5, dead even across timeframes. Candle is the standout at 13 green zero red. Engulf 10 green zero red. Ichi TK however reads 4 green 9 red — structural bias has not confirmed. C>T 6 green 8 red, bears hold the trend alignment. SS/DD 2 to 1 bull. No squeeze active. Momentum Bull down with bandwidth at 130.39% tagged Blowoff — energy has already released. Retrace -44.1% Deep, bounce 177.7% at 4x tagged BO. Bull Cascade 1 at 7 bars, 5-Bar Move -4.6%.
Spot Z at 0.76 Active but the SpotZ 1:5 read is the issue — 0.76 current, 4.09 peak, -3.33 deceleration with double down arrows. Futures Z at zero, steady. Combined Z 0.04, average. Spot:Fut normal. Spot momentum contracting at 261.4%. The volume spike that drove this move has already passed — deceleration is severe.
Leverage at 4.69x down, Normal percentile at 6.9% Floor. All-Time Max leverage was 59.43x 547 bars ago, All-Time Min 0.61x 721 bars ago. Price percentile 46.5% Lower. No divergence flags anywhere in the structure. Leverage at floor percentile means the speculative excess has been flushed — cleaner positioning than the AT Max reading suggests.
OBV Z at 0.85 Strong but with a downward arrow is the key read. The move is real in origin — OBV confirms accumulation happened — but the direction arrow says OBV momentum is rolling over. Bull:Bear Z reads 0.27 to -0.24, neutral. No whale activity, liquidations clear. OBV divergence normal. The combination of OBV Z declining and SpotZ decelerating -3.33 from a 4.09 peak tells you the volume engine that drove this bounce is spent.
The honest read: the candle and engulf signals are as clean as they come — 13 and 10 green respectively — but everything in the volume internals says the move already happened. SpotZ peaked at 4.09 and is now bleeding down to 0.76. OBV Z is turning. Bandwidth at 130.39% means the squeeze already fired and released energy. Ichi TK at 4 green 9 red and C>T at 6 green 8 red mean the structural trend has not flipped bull. The 177.7% bounce target at BO is historical context, not a live target. Leverage at 6.9th percentile floor is the only clean structural positive — forced sellers are out. At 0.1480 with price at 46.5% of range, this is a post-move consolidation setup, not a fresh entry. Wait for SpotZ to stabilize above 1.0 before treating the candle signals as actionable.
Is That Crypto Pump Real? Data Says No. Here's Why.
Stop Losing Money to Fake Volume. Find Real Moves Now.
Trade the REAL Crypto Volume. Stop Getting Faked Out.
BRUSDT Squeeze Fired — 130% Bounce Signal Recovery in ProgressBRUSDT is trading at 0.1145 spot with futures at 0.1143, a mild backwardation of -0.21% at Z -0.9 classified Bull. Spot volume is thin at 5.51M tokens against a notable 63.01M on the futures side, with spot dollar flow at 630.03K versus 7.21M in futures — futures are leading this move by a wide margin, which demands caution on sustainability even as the directional signal is bullish.
Signal count reads 42 green to 18 red across 112 — Strong BULL at 40.85% edge with 2.38x confidence. EMA alignment is 6 to 2 bull-favoring. C>T confirms at 50 to 9. Ichimoku TK holds 6 to 6, split but not bearish. SS/DD is 2 to 1 mildly bullish. Candle patterns are strong at 13 to 1. Engulf prints 6 to 0. Pattern totals at 6 to 0 — clean sweep. The squeeze has fired with BW at 112.36% Blowoff, momentum reading Bull Up. Clarity at 54%.
Volume Z-scores remain subdued: Spot Z at -0.38 Steady, Futures Z -0.21 Steady, Combined -0.25 Steady. The SpotZ 1:5 differential shows 0.03 Rising — marginal but directionally consistent. Spot momentum is expanding at 882.9% classified Blowoff — an extreme reading that signals violent expansion already in progress. Bull:Bear Z reads -0.08 to -0.29 Neutral — flow not yet confirming bull dominance at the volume level despite the price move.
Leverage sits at 11.42x declining from High territory, Percentile at 18.4% Floor — leverage was elevated coming into this move and is now unwinding, which supports the squeeze-driven expansion thesis. AT Max printed 59.43x 269 bars ago. AT Min is 0.61x at 356 bars. Price sits at 94.3% Upper — this is not a bottom play, price is deep into its historical range on the high side.
OBV Z reads 0.36 Inflow — present but not strong, a mild confirmation rather than a leading signal. Liquidations are clear. No whale activity detected. Squeeze divergence is flagged as Spot Fire Real — the spot squeeze confirmed independently, adding legitimacy to the breakout. Yield at -230% APY Bull at -0.9 sigma, consistent with the mild backwardation structure.
The honest read: BRUSDT fired a real squeeze with a clean pattern sweep and Spot Fire confirmation, but the setup carries notable risk. Futures dollar volume is 11x spot dollar flow — this move is futures-led, not spot-driven, which historically precedes fakeouts. BW at 112% Blowoff and price at 94.3% Upper means expansion energy is already well spent. The 130% bounce target is on the board but chasing here without a spot volume surge to match is speculative. Wait for spot flow to close the gap with futures before adding conviction.
Is That Crypto Pump Real? Data Says No. Here's Why.
Stop Losing Money to Fake Volume. Find Real Moves Now.
Trade the REAL Crypto Volume. Stop Getting Faked Out.
BR - Bearish Triangle FormationPrice is forming a bearish triangle, with lower highs pressing against a flat support zone. This structure suggests ongoing distribution rather than accumulation.
I expect one more minor push to the upside ( liquidity grab / last bounce), followed by a breakdown to the downside.
Downside targets:
$0.035
$0.020
At this stage, the coin does not look ready for bullish manipulation yet . Yes, a few wallets control more than 90% of the total supply, which means it can be pushed aggressively higher in the future. However, before that happens, I expect a bearish move down, followed by consolidation , and only after that — potential manipulative pump.
BRUSDT/USDT – 1-Hour Technical Analysis (Heikin Ashi)BRUSDT is currently forming a potential bearish divergence while trading in a tight consolidation range near resistance. The RSI is elevated at 76.96, indicating overbought conditions and signaling a potential reversal setup.
A short position is suggested with a Sell Stop order at 0.07472.
Stop Loss: 0.08847 (above resistance zone)
Take Profit 1 (TP1): 0.06180
Take Profit 2 (TP2): 0.04860
The red box indicates price compression after a strong upward spike, signaling potential exhaustion. Confirmation for the short setup is expected upon a breakdown of key support at 0.07720, which would mature the bearish divergence.
Momentum indicators are flattening, and the RSI has started showing signs of divergence despite price holding highs. If price breaks below the 0.07720 level, selling pressure may increase, validating the short trade idea.
Traders should monitor closely and wait for confirmation before execution.