ABB India: Could double...⚡ 🏭 📈 🔋 🚀
1. The Macro Setup: The Hunt Volatility Funnel
Look at the weekly chart.
NSE:ABB has spent over two years carving out a massive, highly symmetrical Hunt Volatility Funnel
@TheCryptoSniper
The Compression: After hitting macro resistance near 9,027 in mid-2024, the price underwent a deep, necessary cooling-off period.
The Squeeze: Throughout 2025 and early 2026, the price action compressed significantly, trapping liquidity within narrowing boundaries.
The Breakout Trigger: We are right at the edge of the knife. ABB is currently pressing hard against the upper bounds of the funnel at 7,021.
Volatility is coiled like a spring, and a clean weekly close outside this structure will signal a massive momentum expansion phase.
2. The Fundamental Core: Why ABB Deserves a Hyper-Premium
This isn't a speculative momentum play; it is a structural transformation story.
ABB India sits at the absolute epicentre of two of the most capital-intensive secular trends of this decade: the global AI data centre boom and India's massive power grid modernisation.
The AI Proxy Play (The Power Hunger)
The market is finally realising that AI is fundamentally an energy infrastructure story.
AI data centre's require 3x to 5x more power density than legacy facilities.
You cannot deploy advanced computing clusters without specialised, hyper-reliable electrification infrastructure.
ABB owns this bottleneck.
From advanced medium-voltage switchgear and smart distribution panels to digital energy management systems, ABB is the premier pick-and-shovel play.
They don't build the AI models—they build the physical nervous system that keeps them powered.
India's Power Grid Capital Expenditure Supercycle
Simultaneously, India is undergoing an unprecedented overhaul of its transmission and distribution infrastructure.
The integration of massive renewable energy capacity requires a digitized, robust, and highly automated grid to manage intermittent loads.
ABB’s electrification and automation divisions are capturing massive, high-margin order books as both public utilities and private industrial giants aggressively scale their capital expenditures.
3. Execution Coordinates & Multi-Tier Targets
The technical geometry on this chart provides clean, objective mathematical extensions to compound capital aggressively into outside space:
The Invalidation Line: The script has a line in the sand. A structural breakdown below the pattern fail zone at 6,652 invalidates the immediate expansion thesis.
Linear Target 1: 7,689
Linear Target 2: 8,619
Linear Target 3: 11,412
Logarithmic Target 3 (The Case for 2x): 13,687
When macro compression of this magnitude resolves to the upside, the extensions frequently overshoot standard linear targets.
Moving from the current compression block toward the Log target represents an absolute duplication of value—fully backed by structural corporate earnings power.
Let the crowd chase the late-stage hype.
We map the infrastructure bottlenecks early.
Onto the next block.
#ABBIndia #Infrastructure #CapExSupercycle #DataCenters #AIProxy #PriceAction #VolatilitySqueeze #ChartPatterns #NiftyInfra #TechnicalAnalysis #India
ABB India Limited
No trades
No trades
In-depth trading ideas
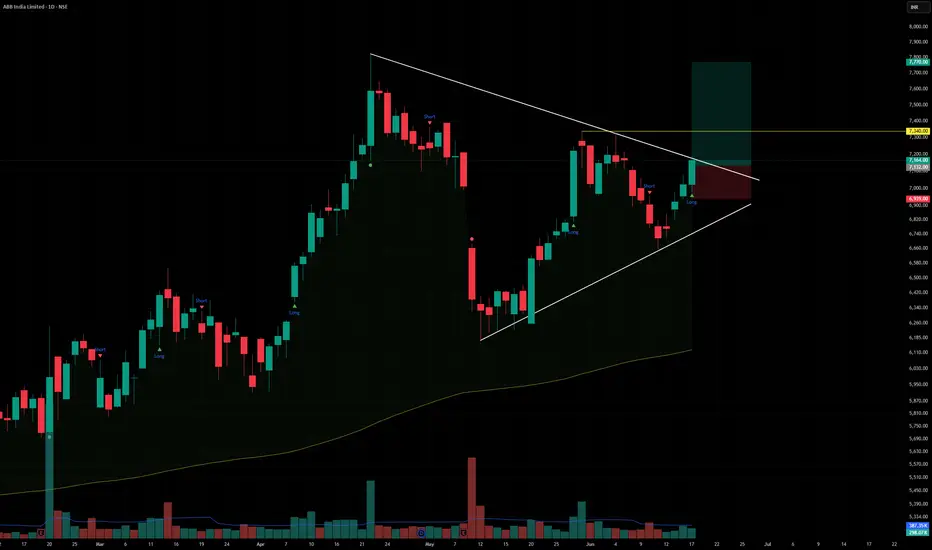
ABBABB India Ltd. (CMP ₹7,164.00, NSE: ABB)
Prepared by Sucrit Patil | The SmartWay Research Desk | 18 June 2026
A Bengaluru‑based engineering and automation company, incorporated in 1949. ABB India operates across electrification, robotics, industrial automation, and motion solutions, serving power, manufacturing, transport, and infrastructure sectors.
Promoter Holding (Mar 2026): ABB Asea Brown Boveri Ltd. — 75.00% stake (no pledges)
FY22–FY26 Snapshot
Revenue Growth: FY26 revenue ₹12,842 Cr vs ₹11,215 Cr in FY25 (+14.5% YoY). → Good
Net Profit: FY26 PAT ₹1,215 Cr vs ₹1,048 Cr in FY25 (+15.9% YoY). → Good
Operating Margin: FY26 EBITDA ₹2,312 Cr, margin 18.0% vs 17.2% last year (+80 bps). → Good
Equity Capital: Stable, face value ₹2. → Good
Dividend Policy: Dividend ₹25.00/share declared for FY26. → Good
Asset Building: Investments in robotics, EV charging, and smart grid solutions. → Good
Sales: Strong demand from industrial automation and electrification projects. → Good
Expense: Raw material cost pressures (steel, copper) remain. → Neutral/Good
EPS: FY26 EPS ₹72.15 vs ₹62.20 last year (+16%). → Good
Institutional Interest & Ownership Trends (Mar 2026)
Promoter Holding: 75.00% (no pledges)
FII Holding: 8.12%
DII Holding: 10.34%
Retail & Others: 6.54%
Strategic Moves & Innovations
Expansion in EV charging infrastructure and smart grids.
Focus on industrial robotics and automation solutions.
Partnerships with state utilities for electrification projects.
Diversification into renewable energy integration and digital solutions.
Cash Flow & Balance Sheet Strength
Market cap ~₹1,52,800 Cr.
Debt‑to‑equity ratio ~0.18 (low leverage).
Book value per share ₹412.00; P/B ~17.4.
EPS (TTM) ₹72.15; P/E ~99.3.
Risk Factors
High P/E ratio ~99.3, indicating premium valuations.
Dependence on industrial capex cycles.
Exposure to commodity price volatility (steel, copper).
Competition from Siemens India, Schneider Electric, and GE India.
Investor Takeaway
ABB India has delivered robust FY26 performance, supported by electrification, automation, and robotics demand. With strong promoter backing, dividend payouts, and leadership in industrial technology, ABB remains a premium play on India’s industrial automation and electrification growth story. At CMP ₹7,164.00, valuations are expensive (P/E ~99.3, P/B ~17.4), reflecting high growth expectations but also significant risk.
ABB – Technical & Educational Snapshot📊 ABB – Technical & Educational Snapshot
Ticker: NSE: ABB
Sector: ⚙️ Industrial Automation / Engineering
CMP: 6,605.00 ▲ (+4.36% | 20 May 2026)
Learning Rating: ⭐⭐⭐⭐☆ (Recovery Momentum Near Resistance Zone)
Chart Pattern Observed: 📊 Pullback → Stabilisation → Recovery Attempt
Candlestick Pattern Observed: Bullish Engulfing
📊 Technical Snapshot
ABB is showing a recovery attempt after witnessing corrective pressure from higher supply zones, with recent price action indicating renewed buying interest near important support levels. The latest bullish engulfing candle reflects strong short-term recovery momentum as buyers attempt to reclaim lost ground near resistance clusters. RSI is currently placed near 46.8, indicating that momentum is recovering from neutral territory rather than entering overheated conditions, leaving room for continuation if supported by follow-through buying activity. MACD remains weak but is gradually stabilising, suggesting that bearish pressure may be slowing after the recent decline. Bollinger Bands are beginning to contract after elevated volatility, reflecting possible consolidation before the next directional move. Price is now approaching an important resistance zone near prior reaction highs, and sustained acceptance above these levels may strengthen the recovery structure further.
📊 Volume Analysis
🔹 Current Volume: ~546K
🔹 Average Volume (20-period): ~554K ⚠️
📉 Volume remains near average despite the recovery candle.
💡 Interpretation: Recovery moves supported by average participation may indicate cautious buying activity rather than aggressive institutional accumulation. Stronger participation near resistance zones would improve confirmation strength.
🔑 Key Levels – Daily Timeframe
Support Areas: 6368 | 6131 | 6003
Resistance Areas: 6732 | 6860 | 7097
These are zones where price has paused or reacted earlier.
📉 Pullback Zones (Chart-Based Observation)
Healthy Pullback Zone 1: 6496 – 6441
Healthy Pullback Zone 2: 6368 – 6212
Deep Pullback Support Zone: 6003 Area
💡 Pullbacks holding above recovery zones may support continuation momentum, while deeper retracement below support can weaken the recovery structure temporarily.
What’s Catching Our Eye: Strong bullish engulfing candle after corrective pressure.
What to Watch For: Sustained acceptance above the 6732 resistance zone.
Failure Zone: Sustained weakness below 6368 weakens recovery structure.
Risks to Watch: Weak participation and rejection near overhead supply zones.
What to Expect Next: Recovery continuation with range-based movement possible.
Bullish Case: Strength above resistance may support fresh upside expansion.
Bearish Case: Failure near resistance may trigger renewed consolidation pressure.
Momentum Case: Momentum recovering but requires stronger participation confirmation.
STWP Equity Snapshot – ABB
Reference Setup:
Reference: 6,624
Invalidation Level: 6,212
Upside Reference 1: 7,035
Upside Reference 2: 7,446
STWP View:
• Sentiment: Recovery Positive | Trend: Uptrend Weakening
• RSI: 46.8 (Neutral Recovery Zone)
• Volume: Average Participation
• Structure: Bullish Recovery Attempt
Final Outlook
Momentum: Moderate
Trend: Developing Recovery
Risk: Moderate to High
Volume: Average
Learning Note: Recovery structures become stronger when bullish reversals are supported by improving participation near resistance zones.
Disclaimer:
This analysis is generated strictly for educational and analytical purposes only.
This does NOT constitute investment advice, trading advice, or a recommendation to buy or sell any security or derivative instrument.
Options trading involves substantial risk and may not be suitable for all participants.
Readers are advised to exercise independent judgment and consult a SEBI-registered financial advisor before taking any trading or investment decisions.
STWP assumes no responsibility for any financial loss arising from the use of this analysis.
💬 Recovery continuation or temporary bounce — what does the structure suggest to you?
🔼 Boost | ✍️ Comment | 🔁 Share with a learner
👉 Follow STWP for clean chart-reading insights
🚀 Stay Calm. Stay Clean. Trade With Patience.
ABB SWINGABB is again on the verge of new upside. One can look for a long trade in ABB from here on. ABB was keeping it momentum strong even when the market was falling. So please do keep track of this chart and yes please do this trade in cash as it can be a longer swing trade.
Entry- 6550-6500
SL- 6000
Target- 7000, 7500.
Disclaimer- This is just for educational purposes.
JAI SHREE RAM.
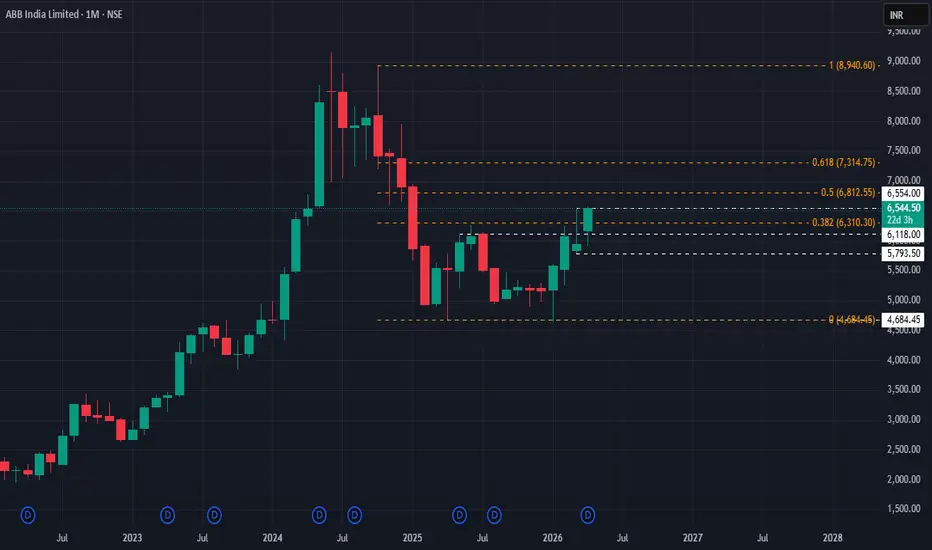
ABB Pre-emptive Reversal – Rounding Bottom Breakout📊 Pre-emptive Reversal – Rounding Bottom Breakout
CMP: 6549
Trigger: Sustained above 6570 (weekly close preferred)
Targets: 6812 / 7314 / 7900 / 8900
SL: 5843 (strict)
🧠 Setup Logic:
Fall: 8940 → 4648 → now rounding bottom formation
Early accumulation phase
Sustaining near 38.2% Fibonacci level
6570 = key trigger + supply zone
👉 Conclusion: Pre-emptive trade (not confirmed breakout)
🎯 Trade Plan:
Entry: Above 6570 (no intraday fake breakout)
Confirmation:
✔ Weekly close above 6570
✔ Better if 2 weekly closes sustain
⚠️ Clarification:
Independent analysis. No part of Religare involved.
📝 Important:
Not responsible for profit/loss. No fees involved.
📉 Disclaimer:
Not SEBI-registered. Do your own research.
NSE – NIFTY 750 | ABB India | 12 Mar 2026ABB India shows a long-term secular advance followed by a prolonged consolidation between 2008 and 2020. This multi-year range formed a structural accumulation beneath the ₹1600 region.
The eventual breakout around 2021 triggered a strong impulsive expansion phase. After the extended advance into 2024, price is currently consolidating in a higher structural range.
At present, this behaviour appears to be digestion of prior gains rather than structural damage.
This analysis is part of a long-term structural study of ~750 stocks representing a large portion of the Indian equity market.
Structure → Level → Trigger → Probability
#NIFTY750
#ABBIndia
#MarketStructure
#ElliottWave
#StructuralAnalysis
#IndianStockMarket
#PriceAction
#EwavesJournal
ABB – STWP Equity Snapshot📊 ABB – STWP Equity Snapshot
Ticker: NSE: ABB
Sector: Industrial Automation / Electrification
CMP: 6,224.50 ▲ (+4.05% | 10 Mar 2026)
Learning Rating: ⭐⭐⭐⭐☆ (Momentum Expansion Near Range High)
Chart Pattern Observed: Strong Bullish Expansion Within Developing Structure
Candlestick Context: Wide Bullish Candle with Increasing Participation
ABB has been maintaining a constructive price structure with a sequence of higher lows forming over the past few weeks, indicating gradual accumulation and strengthening buyer participation. The recent price action shows a strong bullish expansion candle pushing the stock back toward the upper end of its recent trading band. This move suggests that market participants are attempting to challenge the prior resistance cluster near recent highs.
RSI is positioned near 64.3, indicating strengthening bullish momentum without entering extreme overbought territory. This reflects a healthy trend environment rather than exhaustion. MACD remains positively aligned, supporting the continuation bias in the short term. Structurally, price is now approaching an important resistance region between 6,305 and 6,523, which previously acted as a supply band. Sustained acceptance above this cluster would be required to confirm structural continuation beyond the current range.
From a CPR perspective, the structure remains supportive of bullish continuation, with price trading above the pivot structure and projected CPR levels gradually shifting upward. However, as price approaches the upper resistance zone, the probability of temporary consolidation or controlled pullback increases before the next directional move develops.
Volume Analysis
Current volume is running above the recent average with relative participation around 1.64 times normal levels. The bullish expansion candle is supported by credible participation, suggesting that the move is driven by genuine buying activity rather than low-liquidity drift. Continuation strength will depend on whether participation remains elevated as price approaches the resistance band.
Key Levels – Daily Timeframe
Primary support areas are positioned near 6,087, followed by 5,950 and 5,869. On the upside, resistance zones are located around 6,305, 6,386 and 6,523. These zones represent prior reaction areas where price has historically paused or reversed and therefore serve as structural decision points.
Structure Read – What Matters Now
The key observation is the strong bullish impulse pushing price back toward the upper range supply zone. The immediate focus remains on whether price can achieve acceptance above the 6,305–6,386 resistance cluster. Sustained trade below 5,800 would weaken the current bullish structure and increase the probability of a broader consolidation phase. The main risk lies in resistance rejection after the recent momentum expansion. The most likely near-term outcome is either breakout continuation toward higher levels or a consolidation phase below resistance.
Price Reference Framework – Educational View
From an intraday observation perspective, the key reference zone lies around 6,250, with risk invalidation below 6,021. Upside reference zones are positioned near 6,478 and 6,706. These levels are intended purely for studying short-term price behaviour and participation dynamics.
From a swing perspective over the next two to five sessions, the observation zone remains around 6,250, with structural invalidation below 5,800. Upside reference zones extend toward 7,148 and 7,822, becoming relevant only if price sustains above reclaimed resistance areas.
STWP View
Momentum is moderate while the broader trend continues to develop within a range-to-upward structure. Risk remains elevated due to proximity to resistance and recent expansion in price. Volume is high and supportive of the move. Sentiment remains neutral to bullish with RSI strengthening and the session registering a 4.05 percent advance.
Final Outlook
Momentum: Moderate
Trend: Range
Risk: High
Volume: High
📘 Learning Note
Strong candles near resistance signal participation, but confirmation comes only when price sustains above supply. Structure decides continuation, not a single momentum move.
STWP Option Chain Analysis – ABB
Here is a quick options-based observation for ABB based on current options activity.
From the current positioning in the options chain, an important support area appears near 6150, while resistance is visible around 6300. Liquidity concentration is currently highest near 6200, which often becomes a zone where price spends time during the session as traders adjust their positions.
Call-side positioning is gradually building around the 6300 strike, suggesting that this level may act as a short-term ceiling unless stronger momentum enters the market. On the put side, liquidity is visible near 6150, indicating that this level may attract defensive positioning and act as a short-term support zone.
Based on the current option structure, the visible positioning band appears to be between 6150 and 6300, creating an approximate range width of around 150 points. Using this structure as a reference, the estimated intraday movement expectation is roughly around ±60 points from the ATM level.
This places the approximate upper activity zone near 6260, while the lower activity zone appears near 6140. Current gamma positioning suggests that volatility may expand if price moves decisively outside this band, while balanced positioning inside the range may keep the market rotational.
Options pressure currently shows call pressure near 43 percent and put pressure near 57 percent, indicating relatively stronger put-side positioning and supportive market structure.
Current positioning does not indicate a strong dealer trap structure.
If price manages to move above 6400, it may indicate strengthening bullish momentum. On the other hand, if price moves below 6050, downside pressure may begin to increase.
Overall, the present options structure suggests that price may continue rotating between 6150 and 6300 in the near term, with 6200 acting as a liquidity magnet while market participants continue adjusting their positions.
⚠️ Disclaimer
This analysis is generated strictly for educational and analytical purposes only. All option structures, metrics, scores, interpretations, PCR, Max Pain levels, and volatility commentary are model-based observations derived from uploaded data. This does not constitute investment advice, trading advice, or a recommendation to buy or sell any security or derivative instrument. Options trading involves substantial risk and may not be suitable for all participants. Readers are advised to exercise independent judgment and consult a SEBI-registered financial advisor before taking any trading or investment decisions. STWP assumes no responsibility for any financial loss arising from the use of this analysis.
– STWP
Abb strategy for next week In this stock bearish engulfing pattern formed around 6200 levels on Friday session at higher levels so I am expecting some profit booking may happen in this script. I am advised to traders accumulated short positions in this stock around at which are mention below.
Sell price : open price (for risky traders )
: 6100 levels (for safe traders)
Stop loss : 6265
1st Target : 5900
2nd Target : 5700
Disclaimer : I am not a SEBI Reasearch Analyst please take an advise before take position based on my recommendation
Thanking you for your support if you liked my content suggest to your friends to follow my channel
ABB India Bearish Setup: Targeting the 4637 liquidityThe current consolidation feels like a pause rather than a pivot.
I’m anticipating an impulsive move to break the 4637 level.
This would complete the corrective phase by taking out the previous low.
Watch for a high-volume spike as those stops get hit.
ABB – STWP Equity Snapshot📊 ABB – STWP Equity Snapshot
Ticker: NSE: ABB
Sector: ⚙️ Capital Goods / Electrical Equipment
CMP: 5,474.00 ▲ (+8.54% | 29 Jan 2026)
Learning Rating: ⭐⭐⭐⭐☆ (Bullish Momentum with Elevated Risk)
Chart Pattern Observed: Impulsive Expansion from Prior Demand Base
Candlestick Context: Strong bullish continuation candle with volume expansion
📊 Technical Snapshot
ABB has transitioned sharply from a corrective phase into a momentum-driven recovery after defending the 4,600–4,650 demand zone. The latest price action reflects a strong bullish continuation candle, supported by EMA 200 crossover, RSI breakout, MACD crossover, and Bollinger Band expansion, confirming that the move is participation-led rather than a mechanical bounce. Volume expansion well above average further validates institutional involvement during this impulse leg.
From a CPR perspective, price has decisively reclaimed and moved above the daily CPR band, with the CPR itself shifting upward and widening. This behaviour typically signals a trend continuation environment, where pullbacks toward the CPR zone are more likely to attract responsive buying rather than breakdown. As long as price sustains above the CPR pivot, the broader bias remains constructive; failure to hold the CPR zone would indicate momentum cooling rather than trend reversal.
Structurally, the stock has exited a prolonged value area and entered a post-expansion phase, where consolidation or controlled pullbacks are both expected and healthy. Given the vertical nature of the move and wide CPR, risk remains elevated in the short term, making acceptance and hold above reclaimed levels more important than further upside projection. The technical environment now favours observation of absorption, CPR respect, and volume behaviour to judge continuation quality.
📊 Volume Analysis
🔹 Current Volume: ~2.49M
🔹 Relative Volume: Significantly above recent average
💡 Interpretation:
The expansion candle is backed by exceptional volume, confirming strong participation and institutional interest. Such volume-backed moves often signal genuine intent; however, continuation typically requires digestion via range or pullback rather than vertical follow-through.
🔑 Key Levels – Daily Timeframe
Support Areas: 5120 | 4770 | 4560
Resistance Areas: 5685 | 5890 | 6250
These are zones where price has paused or reacted earlier.
🔍 Structure Read – What Matters Now
What’s Catching Our Eye: Vertical recovery from demand with volume confirmation
What to Watch For: Acceptance above prior swing high zone with price holding gains
Failure Zone: Loss of the 5,120–5,000 support band
Risks to Watch: Momentum exhaustion after sharp expansion
What to Expect Next: Either consolidation above reclaimed levels or volatility-led retracement
📌 Price Reference Framework – Educational View
🔹 Intraday Reference (Short-Term Observation)
Observation Zone: Around 5,470
Risk Invalidation Area: Below 5,120
Upside Reference Zones: 5,685 → 5,890
Used only to study short-term price behaviour and participation.
🔹 Swing Reference (Positional | 2–5 Sessions)
Observation Zone: Around 5,470
Risk Invalidation Area: Below 4,770
Upside Reference Zones: 6,250 → Higher structure-dependent extensions
Relevant only if price sustains above reclaimed value zones.
🧠 STWP View
Momentum: Strong | Trend: Up | Risk: High (due to vertical expansion) | Volume: Very High
📘 Learning Note
Strong moves are outcomes of preparation, not triggers for action. Focus on how price behaves after expansion — continuation comes from acceptance, not excitement.
⚠️ Disclaimer
This post is for educational and informational purposes only. It is not investment advice or a recommendation. Please consult a SEBI-registered financial advisor before making any trading or investment decisions. STWP is not responsible for actions taken based on this analysis.
💬 Did this help you read the chart better?
🔼 Boost | ✍️ Comment | 🔁 Share with a learner
👉 Follow STWP for clean, structure-based chart reading
🚀 Stay Calm. Stay Clean. Trade With Patience.
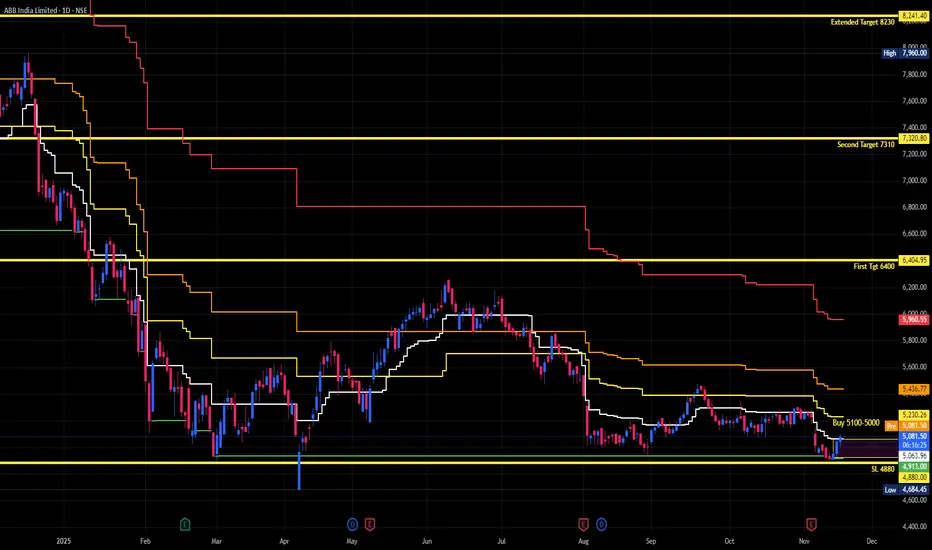
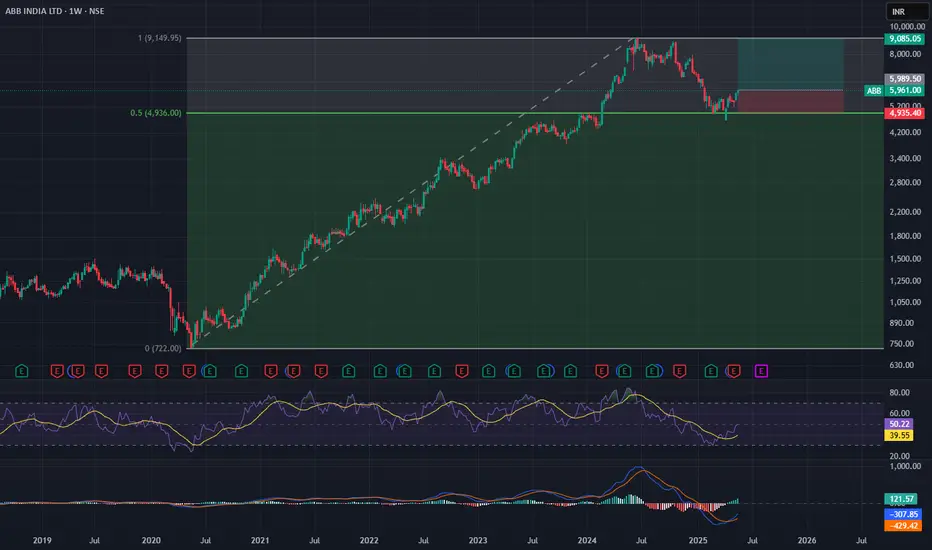
ABB | Risk-Takers Buy @LTP or Safer Entry above @5145 ABB | Risk-Takers Buy @LTP or Safer Entry above @5145 | SL below 4850 | 1st Target 6120
Disclaimer (Please Read Carefully):
This is not investment advice. The stocks shared here are purely for educational and informational purposes. Please do your own research or consult with a financial advisor before making any investment decisions.
******************************************************************************************************************
Stock market में सिर्फ risk ही risk होता है। Market में survive करने का एक ही तरीका है, stop loss को पूरी discipline के साथ accept करना। अपनी capital को protect करने का इससे बेहतर कोई तरीका नहीं है।
मैं जो भी stock यहाँ शेयर करता हूँ, वो या तो मेरी existing holding में होता है, या फिर मैं उसी level पर fresh buying या add on करता हूँ जिसे मैं mention करता हूँ।
मैं हमेशा buy करते समय अपने system में stop loss ज़रूर लगा देता हूँ, और मेरे लिए stop loss, target से भी ज़्यादा important होता है।
Target achieve होने के बाद मैं पहले profit book करता हूँ और फिर retest या fresh breakout का इंतज़ार करता हूँ।
मैं सिर्फ breakouts पर buy करता हूँ, कभी भी support पर नहीं। और मैं resistance पर sell भी नहीं करता।
******************************************************************************************************************
The stock market involves risk, risk, and only risk. To survive in the market, accepting stop-loss with discipline and without hesitation. There is no other way to protect you capital.
Any stock I share is either already part of my existing holding or I take a fresh entry at the same level I mention. I always place the stop-loss in my system at the time of buying, and I give the highest importance to stop-loss more than the target. Once the target is achieved, I usually book profit once and then wait for either a retest or a fresh breakout.
I buy only on breakouts, never on supports. I also do not sell at resistance levels.
That is simply my trading style.
Technical Analysis: ABB India Ltd. (NSE: ABB) This analysis interprets the monthly chart of ABB India, focusing on its long-term trend structure, key support and resistance levels, and momentum indicators, within the context of the current macroeconomic environment.
The current market structure presents a compelling parallel to the 2002-2007 bull market cycle.
2002-2007 Cycle: This period was characterized by a significant uptrend, followed by a multi-year corrective phase where the price ultimately found durable support at the 100-period Simple Moving Average (SMA).
Current Cycle: The rally from the 2020 lows mirrors the earlier expansion. The price is now in a consolidation phase near all-time highs, showing signs of short-term exhaustion.
Thesis: The observation that historical patterns may "rhyme" is valid in technical analysis. The current consolidation, coupled with weakening momentum, suggests a potential for a deeper pullback. A test of the 100 SMA, similar to the post-2007 correction, is a plausible scenario to monitor.
Price Action and Momentum Analysis
Relative Strength Index (RSI)
A distinct bearish divergence is visible. While the price has forged higher highs, the RSI has failed to achieve corresponding peaks. This suggests that the underlying buying momentum is waning and raises the probability of a price correction or extended consolidation.
Moving Average Convergence Divergence (MACD)
The MACD has shown a bearish crossover, with the MACD line moving below the signal line. The histogram has also turned negative, confirming a shift from bullish to bearish short-term momentum.
Synthesis and Conclusive Interpretation
Considering the technical signals in conjunction with the challenging macroeconomic backdrop of elevated inflation and recessionary fears, a cautious stance is warranted.
Primary Outlook: The bearish divergence on the RSI and the negative MACD crossover are leading indicators suggesting that the uptrend is losing strength. The price is currently range-bound, indicating a balance between buyers and sellers.
Bearish Scenario: A definitive break below the consolidation range could initiate a corrective move towards the first support at 4065. The most significant test would be the 2687 level, where the 100 SMA provides a historical and technical anchor. A failure to hold this level would significantly increase the odds of a prolonged bear market phase, targeting the third support at 1559.
Bullish Scenario: For the bullish trend to resume, the price must break out of the current consolidation and decisively clear the 8467 resistance level with strong volume and renewed momentum.
In summary, while the long-term trend remains structurally intact, the short-to-medium-term indicators point towards a high probability of a corrective phase. The potential for the current market to "rhyme" with the post-2007 pullback is a valid thesis, with the 2687 support level being the critical pivot point to monitor.
The critical price zones for defining the market's next directional move are clearly demarcated.
Level Type Price Level Significance
Resistance 8467 The primary overhead barrier and all-time high. A sustained break above this level would signal a continuation of the primary uptrend.
1st Support 4065 The first significant area of potential demand and a previous consolidation zone.
2nd Support 2687 A crucial support level that shows confluence with the 100 SMA. This is the most critical zone to watch for a potential trend reversal or continuation.
3rd Support 1559 The final major structural support from the prior breakout area.
ABB India Ltd – Bearish Setup (1H Chart)ABB India Ltd – Bearish Setup (1H Chart)
Price is consolidating in a descending triangle after a sharp drop.
A breakdown below the support zone could trigger another leg down towards ₹4927, mirroring the previous move of ~4.3%.
📉 Pattern: Continuation triangle
📊 Bias: Bearish below 5150
🎯 Target: 4925
⛔ Stop-loss: Above 5220
What’s your view — breakdown or bounce incoming?
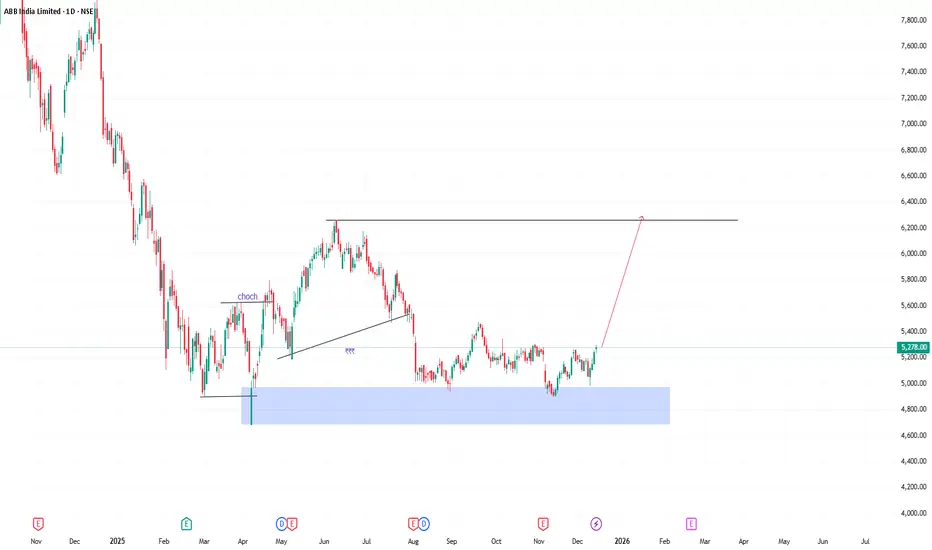
ABB INDIA (SWING LONG SETUP) (EDUCATIONAL ONLY)ABB India is consolidating near the ₹5,020 – ₹5,130 demand zone after a corrective phase.
The stock is showing support confirmation with potential for a trend reversal.
Risk is well-defined with a strict stop-loss, while multiple resistances provide clear target levels.
✅ Trade Plan:
Entry Zone: ₹5,020 – ₹5,130 (Ref: ~₹5,120)
Stop-Loss: Below ₹4,650 (swing support breakdown)
🎯 Upside Targets (from ~₹5,120):
T1: ₹5,470 → +6.8% (near-term resistance)
T2: ₹6,061 → +18.4% (supply zone & horizontal resistance)
T3: ₹6,788 → +32.5% (swing high)
T4: ₹7,781 – ₹7,960 → +52% – 55% (long-term resistance / breakout level)
📊 Technical Insights:
•Stock is holding the demand zone after a correction.
•Volume stability indicates possible accumulation.
•Risk-to-Reward Ratio (RRR > 3) makes this swing setup attractive.
•Breakout above T2 can trigger strong momentum towards positional targets.
⚠️ Disclaimer:
This is an educational idea only, not a buy/sell signal. Please do your own research or consult a financial advisor before taking any trade.
ABB INDIA LTD Swing Trade📊 Price Action & Trend Analysis
Analyzing market trends using price action, key support/resistance levels, and candlestick patterns to identify high-probability trade setups.
Always follow the trend and manage risk wisely!
Price Action Analysis Interprets Market Movements Using Patterns And Trends On Price Charts.
👉👉👉Follow us for Live Market Views/Trades/Analysis/News Updates.
#ABB India | 1500-Point Move on the RadarAfter a strong breakout from the recent consolidation zone, ABB is showing renewed momentum with clear signs of accumulation and strength in trend.
We're now anticipating a fresh 1500-point move based on technical structure and price action dynamics.
Current Price: 5635
Mid-Point: 5452.50
Upside Targets: 6123.04, 6502.50, 6896.25 and7290.00
Downside Targets: 4783.28, 4402.50, 4008.75 and 3615.00
Support: 5164.05
Resistance: 5743.58
Disclaimer:
This analysis is for educational purposes only. Do your own due diligence before acting on any trade plan.