ABCAPITAL – A Demand & Supply Case Study📚 ABCAPITAL – A Demand & Supply Case Study
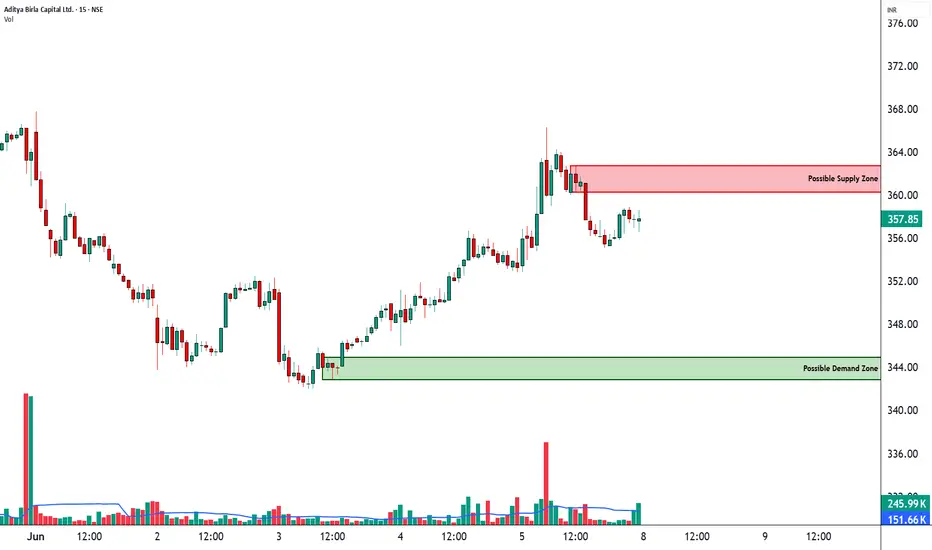
Aditya Birla Capital provides a useful example of how Demand and Supply zones influence price behaviour. The stock recently moved from a fresh Demand Zone into a fresh Supply Zone, offering traders an opportunity to study the interaction between buyers and sellers through market structure.
🟢 Demand Zone
• Area: 342.85 – 344.95
• Type: DBR (Drop-Base-Rally)
• Status: Fresh
🔴 Supply Zone
• Area: 360.35 – 362.80
• Type: RBD (Rally-Base-Drop)
• Status: F
In-depth trading ideas
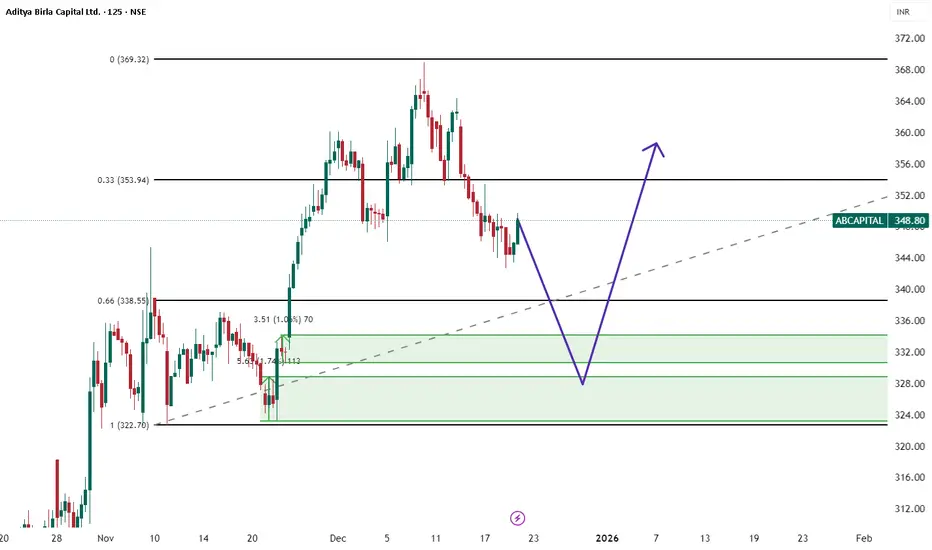
Aditya Birla Capital – Reversal & Breakout Setup Near ₹340 ZoneThe price has shown a steady recovery after a downtrend and is currently trading around the ₹335–₹340 zone. The recent price action indicates consolidation near resistance, suggesting a potential breakout if momentum sustains.
The key demand/support zone lies near ₹312 – ₹329, which can act as a base on pullbacks.
Trade Plan
Entry Zone:
₹330 – ₹340 (on consolidation or breakout above ₹340)
Stop Loss:
₹312.20 (below key demand zone / invalidation level)
Primary Targets:
₹380.75 (near-term re
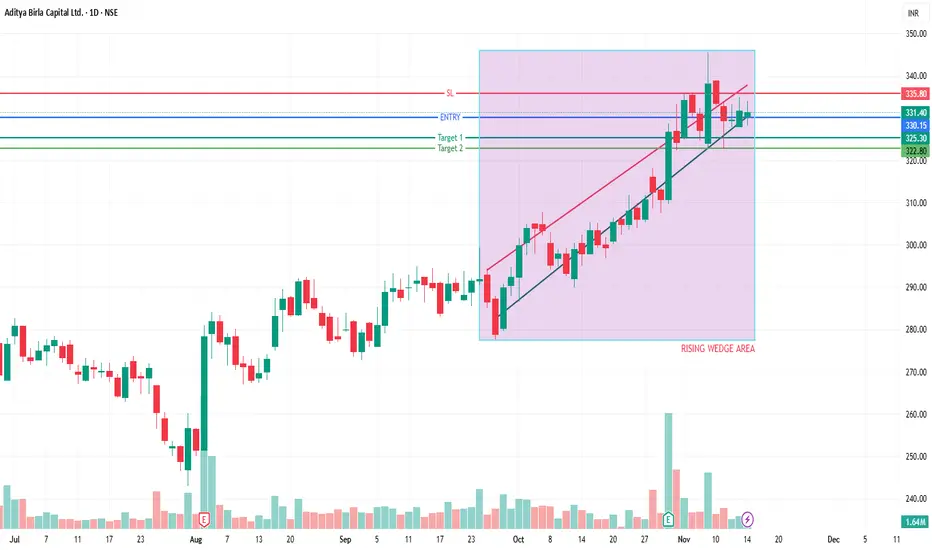
ABCAPITAL - Rising Wedge PATTERN Breakout [ SELL SIDE ]
1. RSI, Supports & Resistances:
RSI: 63.18 (This means the stock is not overbought or oversold—it's in a mildly strong zone).
Current Price: ₹331.40
Support Levels:
Support 3: ₹322.60
Support 2: ₹322.60
Support 1: ₹307.50
(These are price levels where the stock may find buyers and recover if it falls.)
Resistance Levels:
Resistance 1: ₹335.00
Resistance 2: ₹336.00
Resistance 3: ₹345.40
(These are price levels where the stock may face selling pressure and pull back if it rises.)
Volu
Aditya Birla Cap, Is it going for 525+
Aditya Birla capital has formed C&H pattern on monthly chart. Also on weekly and daily chart has broken trendline and resistance after long consolidation.
After 305, looks bullish and possibility of 525-540 in medium term is quite strong.
Please comment your views
Disclaimer: this is not a buy/sell recommendation.
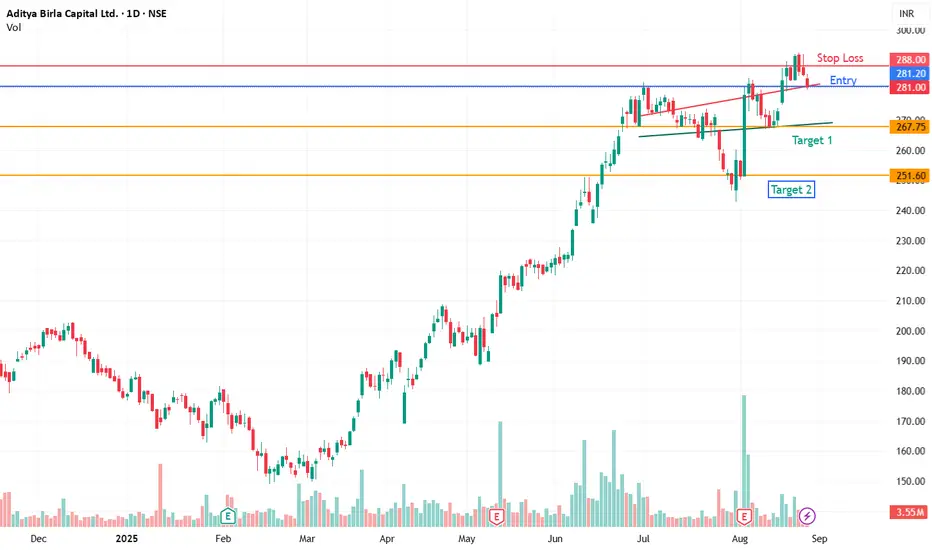
ABCAPITAL - Rising Wedge Pattern breakout (bear)Current Price: ₹281.00
RSI (Relative Strength Index): 55.43 → Neutral to slightly bullish (above 50 but below 70).
✅ Support and Resistance
Supports:
S1: ₹268.00
S2: ₹271.35
S3: ₹271.60
Price is holding above key supports, which provides a cushion for buyers.
Resistances:
R1: ₹282.65
R2: ₹284.00
R3: ₹289.60
Stock is near immediate resistance (₹282–284 zone). Breakout above ₹289.60 could open higher levels.
✅ Fibonacci Levels
23.6%: ₹113.36
38.2%: ₹147.57
50.0%: ₹175.22
61.8%: ₹202
ABCAPITAL - DARK HORSE IN NBFCThis is a Pure Techno-Funda pick, Have been tracking the company for few years but now there is a shift in the gear, the recent move was on account of very good results in the NBFC and AMC space.
coming to fundamentals, would like to mention few points:
1. company had increased its capital base in the past, but it is important to remember that company had increased its earnings almost 4 times since listing.
2.company is on track to double its loan base by 2026.
3.company has been regularly inv
AB Capital - Closed above all time high and consolidationAB Capital
After closing above-time high of Rs. 255 in June 2025, the stock has entered a consolidation phase over the past month.
Key observations:
Support Zone: The 246-255 range is expected to provide strong support.
Trading Plan: Look for buying opportunities near the support zone (246-250) with a target of 280 and above.
A sustained move above 260 could lead to further upside.
This analysis is based on technical indicators and chart patterns. Always use proper risk management techniques an
AB Capital – Clean Breakout of Multi-Year Resistance | BPB SetupTimeframe: Weekly | Strategy: Breakout–Pullback (BPB)
Technical Highlights:
========================
✅ BO (Breakout) of a major resistance zone around ₹250–₹255, which was acting as a multi-year supply zone.
📈 Strong bullish momentum seen with expanding volumes and wide-range candles.
🔄 BPB Strategy in Play: Price has broken out and now likely to retest the breakout zone.
🧠 Retest near ₹249–₹255 zone expected to provide fresh momentum.
📊 RSI confirms strength, currently above 70 – confirming a
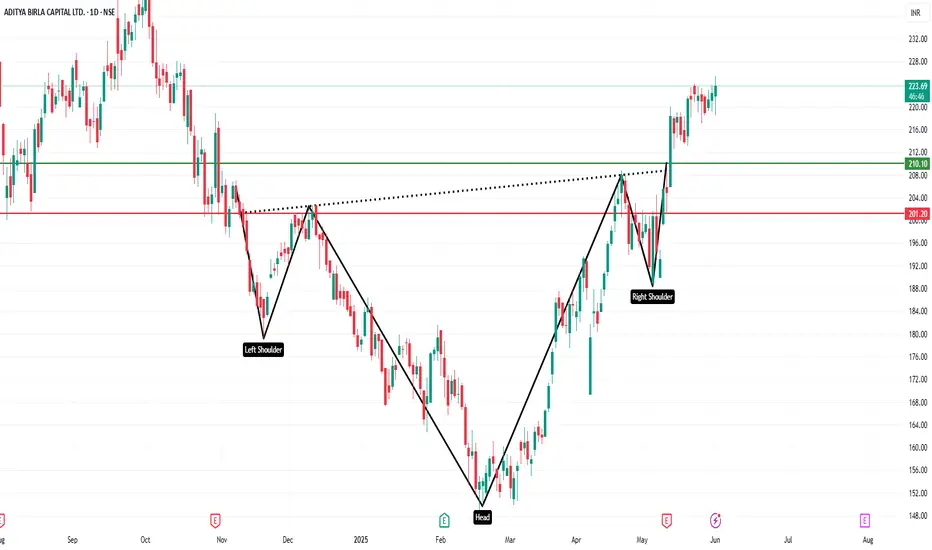
ADITYA BIRLA CAPITAL LTD – Trend Reversal Breakout Trade🧠 Technical Highlights:
Downtrend Channel Breakout: Clear breakout from a falling channel pattern
Resistance Break: Strong breakout above supply zone of ₹204–₹210
Volume: Massive volume spike validates bullish strength
RSI: Above 70, indicating strong momentum but not overbought yet
🟢 Buy Setup
Buy Above: ₹219 (today's close confirms breakout)
Stoploss: ₹204 (below the previous resistance/new support)
Target 1: ₹235
Target 2: ₹248
Target 3: ₹260+ (swing/high-risk high-reward)
🔻 Sell/Sho
Analysis and Summary of the ADITYA BIRLA CAPITAL LTD. (NSE: ABCA🔍 Technical Overview:
Current Price: ₹200.25
Recent Price Action: Price is attempting a bounce after forming a higher low near ₹187.83.
📈 Key Technical Levels:
Fibonacci Levels:
0.0 (Support): ₹187.83
0.5 (Mid-Resistance): ₹204.67
0.618 (Golden Ratio): ₹208.64
1.0 (Previous High): ₹221.51
1.618 (Target Extension): ₹242.33
📐 Pattern Forming:
A descending triangle or falling wedge pattern seems to be forming, indicated by the downward sloping trendline from the recent highs. This setup can