In-depth trading ideas
Adani Group: The 3-Year HVF Funnel Breakout is LIVEThe wait is over.
After 36 months of intense compression and volatility digestion, the Adani Group Combined Index (ENT + POWER + GREEN + PORTS + ENSOL + ATGL) has officially cleared its Hunt Volatility Funnel (#HVF) trigger at 7,360.20.
@TheCryptoSniper
While the broad market is struggling with margin pressures, the Adani Group has pivoted from "Standalone Assets" to a "Technology-Led Infra Platform."
The market is now pricing in the ₹6 Lakh Crore investment blueprint unveiled at WEF 2026, targeting everything from Green Data Centers to specialized Defence plants.
Technical Blueprint:The Squeeze: We have seen a classic volatility funnel where the price action tightened between the Midline (6,259) and the Trigger (7,360).
The Alpha Shift: Adani Power is the "Engine" of this breakout, recently surpassing Adani Ports to become the group’s most valuable entity (~₹4 Lakh Crore).
This leadership from the Energy/Utilities sector provides the structural support needed for a multi-year expansion.
Key Levels:Trigger (Entry): 7,360.20 (Breached)
Stop Loss (Invalidation): 5,343.35 (Deep base support)
Log Target 1 (T1): 8,424.65 (Near-term momentum)
Log Target 2 (T2): 12,496.60 (Re-rating target)
Log Target 3 (T3): 27,802.45 (The ultimate "Blue Sky" structural peak)
Bottom Line: This is no longer a "Mean Reversion" play.
This is an "Expansion Regime."
As long as the index holds above the Midline at 6,259, the path of least resistance is aggressively higher.
#AdaniGroup #HVF #VolatilityFunnel #AdaniPower #Infrastructure #TradingView #Nifty #TechnicalAnalysis #Breakout #ValueUnlock #GrowthInvesting #StockMarketIndia
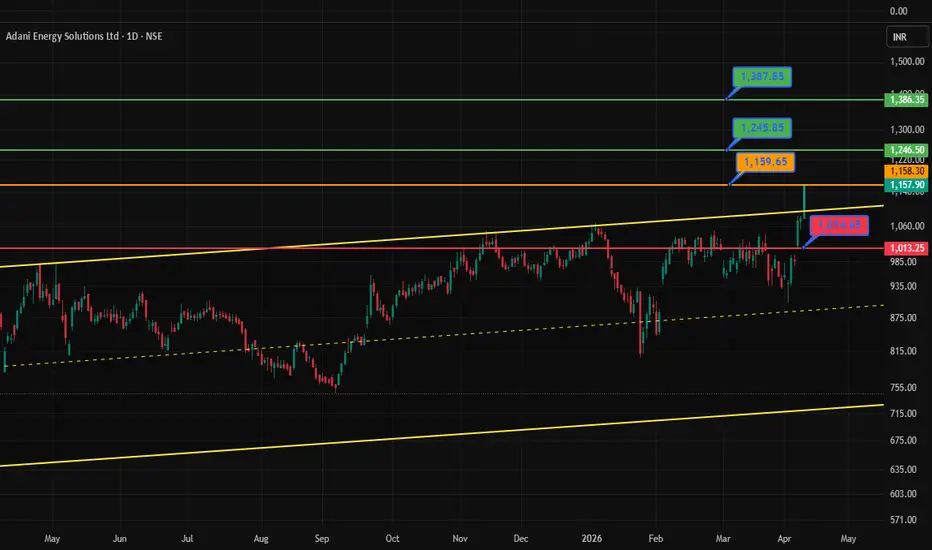
#ADANIENSOL Good Retracement Levels to Enter.
#Adaniensol is at good retracement levels. Trades can use this pullback to make fresh entries, add further towards 1400 levels. Stop can be placed below 1350.
Overall broader market structure is turning positive. Adani Group Stocks have seen good run up in last few weeks. This is the strongest stock looks on chart from technical prospective.
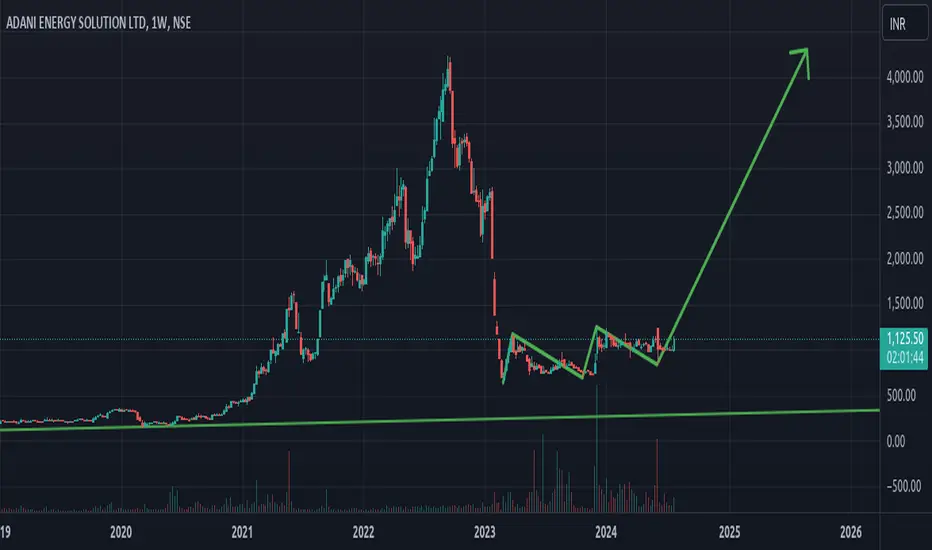
BULLISH VIEW IN ADANIENSOL-- EDUCATIONAL PURPOSEStock crashed from 4236 to 631 (-85%) from Sept 2022- to Feb 2023. After that stock entered into consolidation zone and now saucer pattern breakout is seen after 2 years.
Long position can be initiated on re test level near 1260
TARGET : 2835 (221%) -(PREVIOUS RESISTANCE)
STOPLOSS : WEEKLY CLOSING BELOW 900 (-30%)
RISK REWARD RATIO : 1:7.5
TIME HORIZON 7-8YEARS (till 2034)
Only for long term investment
Not for short term trading
ADANIENSOLStock name : Adani Energy Solutions Ltd.
Bullish setup.
Time frame : Daily.
This chart explain everything (entry , resistance , support ).
This chart setup is for just 2 or 4 weeks.
This chart is shared for for educational and informational purpooses only and should not be considered as financial or investment advice.
Stock market investments are subject to market risk. Please do your own research or consult your financial advisor before making any trading or investment.
I'm not responsible for any profits or losses. I'm not SEBI registered..
Adani Energy Solutions Ltd - Swing Trade IdeaChart Structure
CMP: ~₹1019
EMA 100: ~₹965 (trend support)
Primary Resistance: ₹1075
Stop Support: ₹980
Major Support: ₹924
Long-term target: ₹1348
Price is currently above the 100 EMA, which confirms medium-term bullish structure.
1️⃣ Trend
Stock reclaimed EMA-100 after a sharp correction.
Higher lows forming after the February panic drop.
Indicates accumulation zone between 980–1020.
2️⃣ Resistance Zone
₹1070–1075
This is the recent swing high supply zone.
Breakout above this level can trigger momentum buying.
3️⃣ Support Zone
₹980 → Short term stop support
₹965 → EMA dynamic support
₹924 → Strong demand zone
If ₹1075 breaks with volume
Targets can expand toward:
₹1150
₹1200
₹1348 (long-term structure target)
If price breaks ₹980
Downside possible toward:
₹950
₹924 support
That would invalidate the bullish swing.
Disclaimer: aliceblueonline.com/legal-documentation/disclaimer/
ADANI ENERGY SOLUTIONSADANI ENSOL-coz of recent news related to summon from USA has caused panic selling in whole Adani pack.
Adaniensol has reached its imp support, though it has slightly breached the trendline downside but it is imp to watch for Tuesday closing before initiating buying/avging in this
ADANIENSOLHello,
At a resistance area inverter Hammer candal stick appear so possiblity is very high that price fall from there to downside
This idea is for Educational purpose and paper trading only. Please consult your financial advisor before investing or making any position. Facts or Data given above may be slightly incorrect. We are not SEBI registered
Flag and Pole - Adani Energy BUYYYYY?????I see the Flag and Pole structure on Adani Energy. Most probably upside for short term can be possible if we find a good breakout.
CMP: 792.30
Expected to move up to: 1120
Until unless Adani doesn't have bad news it can move up.
I am not SEBI register agent. This is not BUY or SELL call recommendation for anyone. This is only my analysis.
ADANI ENSOL - Lost it's soul?The chart speaks for itself, as always.
Here’s a quick summary:
- The price has broken the recent support zone with significant volume.
- Both psychological levels at ₹1,000 and ₹750 have been breached.
- Price is below all the swing WEMAs
- The price now seems to be heading toward the ₹500 level.
- You can now access our structured charts for all Nifty 500 Companies, Check the signature section below for more info.
- The recent fiasco in the U.S. has seriously hurt Adani Green. Watch this video to understand why Adani stocks are in trouble:
www.instagram.com
What do you think will happen here?
Disclaimer
This analysis is for educational purposes only and should not be considered as financial advice or a recommendation to buy, sell, or hold any securities. Trading and investing involve risks, and you should consult a qualified financial advisor before making decisions.
The author is not registered with SEBI and is not responsible for any losses based on this analysis. Use this information at your own discretion.
ADANI ENERGY SOLUTION LTD S/R Support and Resistance Levels: In technical analysis, support and resistance levels are significant price levels where buying or selling interest tends to be strong. They are identified based on previous price levels where the price has shown a tendency to reverse or find support.
Support levels are represented by the green line and green shade, indicating areas where buying interest may emerge to prevent further price decline.
Resistance levels are represented by the red line and red shade, indicating areas where selling pressure may arise to prevent further price increases. Traders often consider these levels as potential buying or selling opportunities.
Breakouts: Breakouts occur when the price convincingly moves above a resistance level (red shade) or below a support level (green shade). A bullish breakout above resistance suggests the potential for further price increases, while a bearish breakout below support suggests the potential for further price declines. Traders pay attention to these breakout signals as they may indicate the start of a new trend or significant price movement.
20 EMA: The yellow line denotes 20 EMA, to interpret the 20 EMA, you need to compare it with the prevailing stock price. If the stock price is below the 20 EMA, it signals a possible downtrend. But if the stock price is above the 20 EMA, it signals a possible uptrend.
Disclosure: I am not SEBI registered. The information provided here is for learning purposes only and should not be interpreted as financial advice. It is important to consult with a qualified financial advisor before making any investment decisions. Tweets neither advice nor endorsement.
ADANIENSOL1. Anything can happen.
2. You don't need to know what is going to happen next in order to make money.
3. There is a random distribution between wins and losses for any given set of variables that define an edge. No other thoughts
4. An edge is nothing more than an indication of a higher probability of one thing happening over another.
5. Every moment in the market is unique.
Analysis / Over Analysis / Eagle ViewWhat to do ?
Long term, short term, Swing ?
What to pick ? How to pick ? Best Indicator ?
Wait!
Do simple Earn Simple.
1. One SIMPLE Any Strategy
2. Capital & Risk Management
3. Eagle View
Yes! That's it.
Is this the secret ?
No!
Secret is in front of you. You need to build that vision, need to earn that vision. It's can't be handed over.
Thank you for reading me.
Comment and communicate to grow together.
#ADANIENSOL 1176 Tgt 2500 #ADANIENT #ADANIPORTS #ATGL #AWL #ONGC#ADANIENSOL
NSE:ADANIENSOL
CMP 1176
TGT 2500
SL 900
TF < 9M
Great risk return trade off!
Factors: BULLISH WEDGE BREAKOUT Trend Following Rising Volume with rising Prices. Flag pattern breakout. Pennant Pattern Breakout with Bullish Candle. Retest Successful. Higher Highs & Higher Lows. Broken above RESISTANCE levels Trading at SUPPORT levels Earnings are strong. Bullish Wedge Breakout Risk Return Ratio is healthy. And Rising from Double Bottom Pattern to Flag Pattern forming. If you like my work KINDLY LIKE SHARE & FOLLOW this page for free Stock Recommendations. With 💚 from Rachit Sethia