Alembic Limited – Weekly Chart Technical AnalysisMarket Structure
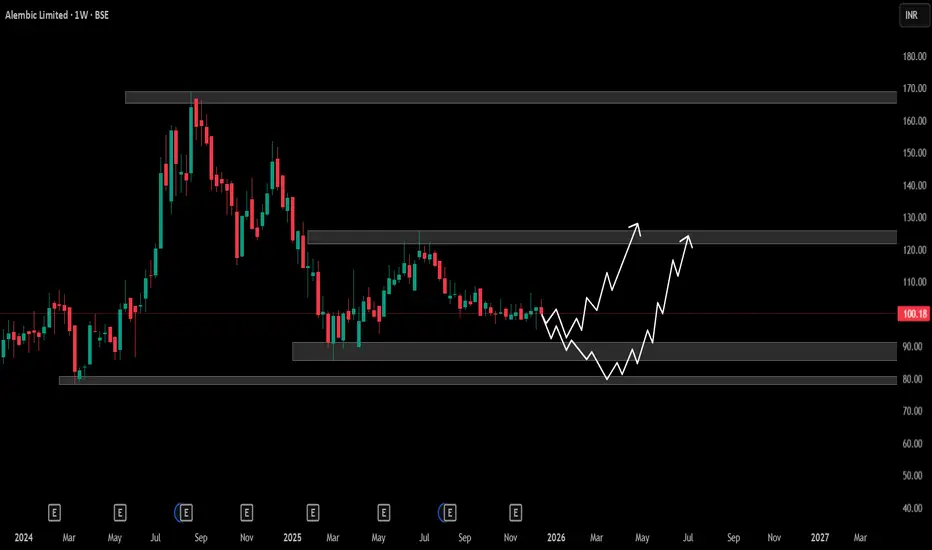
On the weekly timeframe, the stock has been in a broad consolidation phase after a sharp decline from the ₹160–165 supply zone.
Price is currently trading near ₹100, which lies in the middle of a long-term range, indicating indecision and low momentum.
Multiple rejections from higher levels suggest that sellers remain active near resistance zones.
Key Demand & Supply Zones
Major Support Zone: ₹80–85
This is a long-term demand area where strong buying previously emerged.
Intermediate Support: ₹90–92
Short-term support; loss of this level may accelerate downside.
Immediate Resistance: ₹120–125
Strong supply zone; price needs acceptance above this level for trend reversal.
Major Resistance: ₹165–170
Previous distribution zone and long-term supply area.
Price Action Outlook
As long as price holds above ₹80–85, the structure remains range-bound with accumulation potential.
A pullback towards ₹90–85, followed by strong bullish price action, can act as a base for medium-term recovery.
A decisive weekly close above ₹125 would signal a trend change and open upside towards higher resistance zones.
Until then, rallies are likely to face selling pressure near ₹120–125.
Bias
Neutral to mildly bearish below ₹120
Range-bound between ₹85 and ₹125
Bullish confirmation only on sustained breakout above ₹125
Disclaimer
This analysis is based purely on technical analysis and historical price behavior. It is provided for educational purposes only and should not be considered as investment or trading advice.
Alembic Limited
No trades
No trades
In-depth trading ideas
ALEMBICLTD LONGVery good bullish setup
Good breakout with volumes and a retracement with lesser volumes to the breakout zone.
Can be a good long term pick.
Support zone : 110 - 130
View is negated below 110.
For short term observe these levels and track its price action in weekly chart.
My view is for educational or study purpose only.
It is not a buy/sell recommendation.
Contact your financial advisor before taking any investment or trade decision.
52 WEEK HIGH BREAKOUT NSE:ALEMBICLTD
All information on this page is for educational purposes only,
we are not SEBI Registered, Please consult a SEBI registered financial advisor for your financial matters before investing And taking any decision. We are not responsible for any profit/loss you made.
alembicAlembic limited is engaged in the following Businesses:
1) Pharmaceuticals
Manufacturing and marketing of fermentation and chemistry based Active Pharmaceuticals Ingredients (API). The Company is also engaged in Research and Development activity at Vadodara.
2) Real Estate:
Construction of residential & commercial real estate projects and project management and marketing consultancy. The Company has also given certain commercial properties on lease basis to various tenants.
3) Power Assets:
Alembic limited in engaged in Power generation through
a)Co - Generation
Co-generation Plants of total 11 MW
b)Wind Power
4 Windmills of total 5 MW
AlembicLTD for short termPharma sector in focus. I have entered in at 84. Excuse the excessive drawings I have made, those were just me using maths to find a target. Adding on, overall this trade seems like high probability. Can enter near current price. Target of 90 seems good. Weekly is also seeing good activity as it’s trying to complete double bottom pattern.
No buy/sell recommendation. NSE:ALEMBICLTD
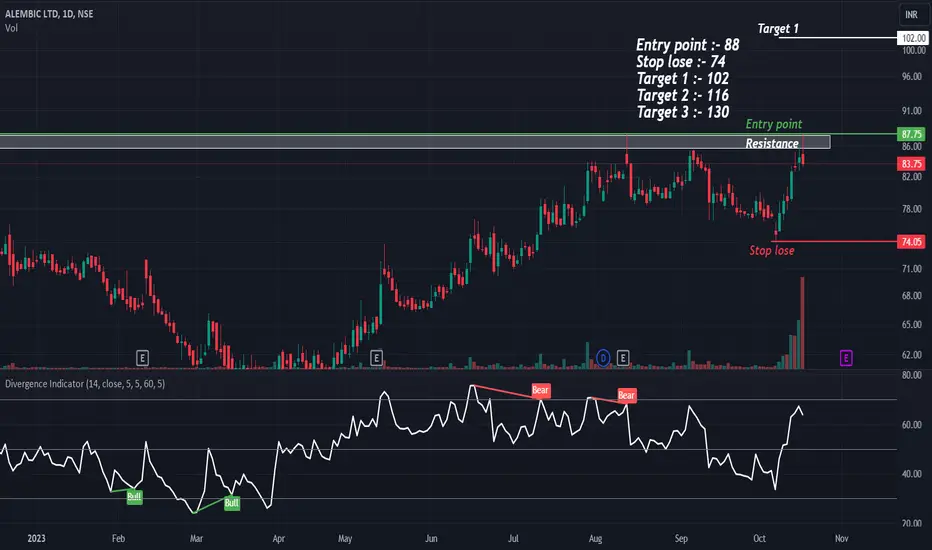
Resistance Breakout - ALEMBICPlease look into the chart for a detailed understanding.
Consider these for short-term & swing trades with 2% profit.
For BTST trades consider booking
target for 1% - 2%
For long-term trades look out for resistance drawn above closing.
Please consider these ideas for educational purpose
Please note that, if there are some big targets, those are drawn thinking for long term.
ALEMBIC LTD Weekly Double BottomAlembic Ltd has formed a double Bottom on weekly chart, Enter with little qty @ CMP and add on dips for the retest. Safe Buyers can wait for retest of the neckline and enter after confirmation.
Please give a boost if you like the analysis and follow for more. Any suggestions or advice is humbly welcomed.
Disclaimer:I am not a SEBI Registered Analyst, and the views expressed here are solely my own and for educational purposes only. Make sure you consult your Financial advisor before investing, as I won't be responsible for any losses incurred.
Alembic looks for an arrival in the Bull marketAlembic Ltd. is engaged in the business of pharmaceuticals and real estate. Its core operation is manufacturing and marketing of APIs (active pharmaceutical ingredients) and construction and leasing of corporate & commercial properties. The company is also engaged in research and development in his pharma business. Alembic CMP is 69.20.
Negative aspects of the company are declining annual net profit & FIIs are decreasing stake. Positive aspect of the company is improving cash from operations annual, no debt, zero promoter pledge.
Entry in the stock can be taken after closing above 70. The short-term targets are 76 and 80. The long-term target is 87. Keep a stop loss at 63.
ALEMBIC PHARMA--BUYit is near to long term support of trend line . once crosses 70 level will show buying interest and has a target of 85-86 level. Accumulate on every dip and add in your porfolio as it has EPS of 5.83 and yield of 2.69 P.E is also 11.50 . Low cost pharma company with good track record.
ALEMBIC - HARMONIC BULLISH PATTERN - PERFECT ENTRY !Bullish Harmonic Pattern Established, possible targets mentioned in the chart
Disclaimer - This is not a buy or sell advice. I am sharing what I see on the chat & what I am trading, based on my own knowledge & understanding. Please consult your financial advisor before taking any bets in the stock market. I will not be responsible for any profit/loss you incur on your trades based on my published ideas.