APOLLO TYRE – Cup & Handle Breakout (Sustaining Above Retest)APOLLO TYRE – Cup & Handle Breakout (Sustaining Above Retest)
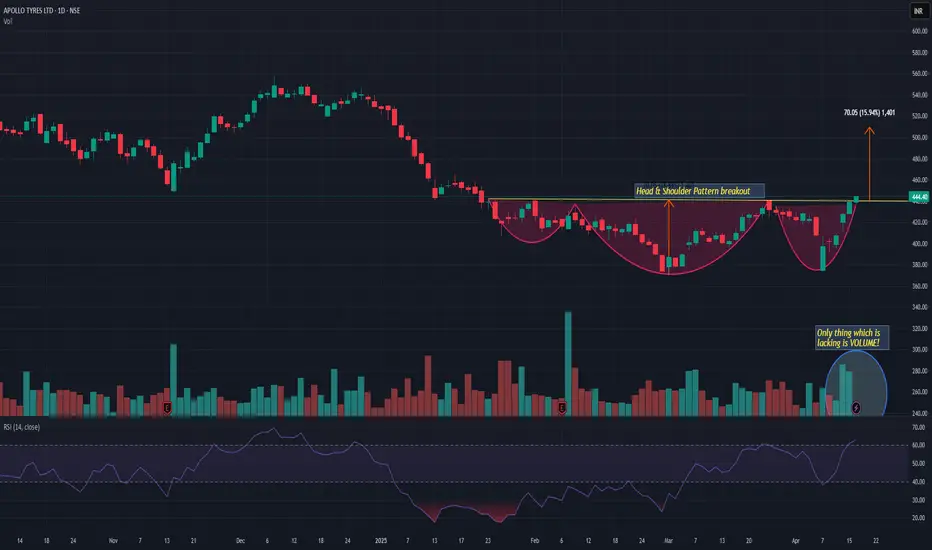
Apollo Tyre has broken out of a clear Cup & Handle pattern above ₹504 and is now sustaining comfortably after retest, confirming strength in the structure.
📌 Swing / Positional Plan
• CMP: ₹535
• Stop Loss: ₹490
• Target: ₹575
📍 Structure & Logic
• Clean Cup & Handle formation
• Strong breakout above ₹504
• Retest successfully defended → bullish confirmation
• Momentum building for next leg upward
⚠️ Trading Approach
Be conservative & patient. Avoid over-positioning. Ride the trend with discipline.
⚠️ Clarification:
This is an independent analysis based purely on technical and market study. No part of Religare is involved in this view or recommendation.
📝 Important:
I am not responsible for any loss or profit incurred. I am not taking any fees for these views – just sharing my analysis for educational and informational purposes.
📉 Disclaimer: Not SEBI-registered. Please do your own research or consult a financial advisor before taking any investment decision.
Apollo Tyres Limited.
No trades
No trades
In-depth trading ideas
APOLLOTYRE showing fresh BUY momentum on intraday chartsAPOLLOTYRE showing fresh BUY momentum on intraday charts with BTR PRO Indicator 📈
Price action is supporting bullish continuation with improving momentum and disciplined risk-reward structure. Traders can watch for sustained move above key intraday resistance levels for further upside confirmation.
✅ Trend Strength Improving
✅ Momentum Confirmation by BTR PRO
✅ Risk-Managed Intraday Setup
✅ Focus on Price Action & Volume Behavior
Always maintain proper stop loss and avoid overleveraging. Market conditions can change quickly.
#APOLLOTYRE #IntradayTrading #PriceAction #BTRPRO #NSE #StockMarketIndia #TradingView #RiskManagement
IPL Sposnors Apollo Tyres - SELL VIEWLets see how it rolls out,
Expecting 50 % drop in this stock as it enters the IPL Sponsors ship.
CMP - 486,
Expected price - 250
Investment horizon - 2-3 years.
A lot of thesis to write but lets play this normal chart.
** This post is for education and entertainment purpose only, Please concern your advisor before investing in market related instruments.**
Apollo Tyres can give a joyous ride Apollo Tyres Ltd. engages in the production and trading of automotive tyres, tubes and flaps. It operates through the following geographical segments: Asia, Pacific, Middle East, Africa (APMEA); Europe, and Others.
Apollo Tyres Ltd. Closing price is 465.75. Dividend Yield @CMP 1.08% The positive aspects of the company are Companies with Low Debt, RSI indicating price strength, MFs increased their shareholding last quarter. The Negative aspects of the company are high Valuation (P.E. = 35.5), High promoter stock pledges and Promoter decreasing their shareholding.
Entry can be taken after closing above 467 Historical Resistance in the stock will be 476, 490 and 508. PEAK Historic Resistance in the stock will be 529 and 542. Stop loss in the stock should be maintained at Closing below 422 or 398 depending upon your risk taking ability.
Disclaimer: The above information is provided for educational purpose, analysis and paper trading only. Please don't treat this as a buy or sell recommendation for the stock or index. The Techno-Funda analysis is based on data that is more than 3 months old. Supports and Resistances are determined by historic past peaks and Valley in the chart. Many other indicators and patterns like EMA, RSI, MACD, Volumes, Fibonacci, parallel channel etc. use historic data which is 3 months or older cyclical points. There is no guarantee they will work in future as markets are highly volatile and swings in prices are also due to macro and micro factors based on actions taken by the company as well as region and global events. Equity investment is subject to risks. I or my clients or family members might have positions in the stocks that we mention in our educational posts. We will not be responsible for any Profit or loss that may occur due to any financial decision taken based on any data provided in this message. Do consult your investment advisor before taking any financial decisions. Stop losses should be an important part of any investment in equity.
APOLLO TYRES ---Ready to Fire UP ? Elliot wave weekly counts 2APOLLO TYRES ---Ready to Fire UP ? Elliot wave weekly counts 2 wave begins
APOLLO TYRES ---Ready to Fire UP ?
weekly counts suggest if sustain abv 439 on weekly basis
than impulse wave may start shortly
EW theory consists multiple possibilities /different structure
this is our educational analysis
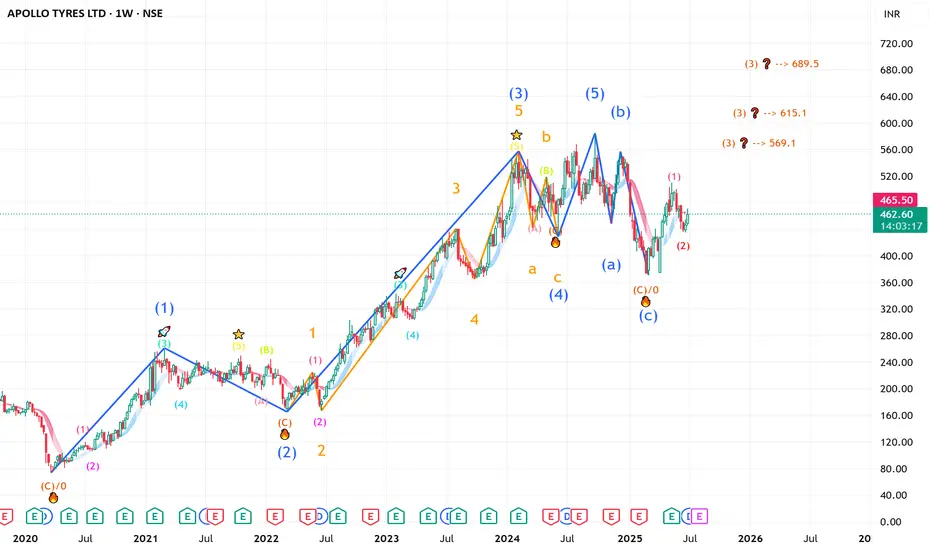
Apollo Tyers Weekly Chart – Elliott Wave Outlook Technical Overview
Apollo Tyers has shown a strong structural uptrend over the past few years. Using Elliott Wave Theory, the stock appears to be completing a classic 5-wave impulse pattern on the weekly chart.
Elliott Wave Count Breakdown
Wave (1) to (3): A clear and powerful uptrend, supported by increasing volume and price acceleration.
Wave (4): Currently in progress – the stock is undergoing a complex corrective structure, often seen in Wave 4 phases.
Wave (5): Yet to unfold. Based on Fibonacci projections, the minimum target for Wave 5 is ₹650.
Key Observations
✅ The price took strong support at the 200 EMA on the weekly chart — a crucial indicator used by institutional traders to gauge long-term trend strength.
🔄 The ongoing correction seems to be complex (likely WXY or triangle-based) rather than a simple ABC.
📐 Fibonacci levels suggest the next leg higher (Wave 5) could target the ₹650 zone, with further potential beyond if momentum sustains.
Strategy Insights
If the corrective Wave (4) is indeed near completion: NSE:APOLLOTYRE
Investors may look for confirmation via a breakout above recent consolidation highs.
Traders can wait for trend confirmation with volume and price action before entry.
Stop-loss could be managed below the 200 EMA or below the recent swing low of the corrective move.
APOLLOTYRE - Apollo Tyres Ltd (2 hours chart, NSE) - Long PositiAPOLLOTYRE - Apollo Tyres Ltd. (2 hours chart, NSE) - Long Position; short-term research idea.
Risk assessment: Medium {volume structure integrity risk}
Risk/Reward ratio ~ 2.68
Current Market Price (CMP) ~ 470
Entry limit ~ 464.50 on April 30, 2025
1. Target limit ~ 481 (+3.55%; +16.5 points)
2. Target limit ~ 498 (+7.21%; +33.5 points)
Stop order limit ~ 452 (-2.69%; -12.5 points)
Disclaimer: Investments in securities markets are subject to market risks. All information presented in this group is strictly for reference and personal study purposes only and is not a recommendation and/or a solicitation to act upon under any interpretation of the letter.
LEGEND:
{curly brackets} = observation notes
= important updates
(parentheses) = information details
~ tilde/approximation = variable value
-hyphen = fixed value
Apollo Tyres at Key Reversal Zone – Big Move Loading!🚨 APOLLO TYRES – Technical Analysis & Trade Plan
🔍 Swing / Positional Opportunity
🔎 Step-by-Step Analysis
1. Monthly Timeframe View
🔸 Previous Monthly High: ₹584.90
🔸 Apollo Tyres Corrected 36.7% from ATH
🔸 Current Market Structure: Price has now entered a strong Monthly POI (Point of Interest) zone.
🔸 Today’s Low: ₹375 – This aligns exactly with our key POI, suggesting possible institutional accumulation.
🔸 Previous Key Swing High: ₹423.50 – This has been broken, indicating a shift in structure from bearish to bullish.
💡 This tells us that supply has weakened and buyers have started dominating. The fact that price has moved out of the demand zone and above the previous structure confirms the strength of this level.
2. Lower Timeframe Confirmation
✅ Today’s gap-down has been fully filled, which often confirms price strength and supports a reversal move.
✅ Price reacting sharply at POI shows that smart money is active at this level.
📈 Entry, Stoploss & Targets
📍 Entry Zone: ₹389 – ₹374
📉 Stop-Loss: ₹355 (just below structure and POI)
📊 Target 1: ₹440
🎯 Target 2: ₹520
📌 Risk-Reward: Well defined with a small risk, giving a potential for large upside.
"Risk is limited, but reward potential is big. A textbook Smart Money entry."
⚠️ Market Conditions
📉 Global markets are weak, so it's important to follow risk management strictly.
👉 Always enter with a stop-loss in place. No blind entries.
✅ Summary & Key Takeaway
Apollo Tyres is showing signs of a strong reversal from a high-timeframe demand zone. With confirmations on both higher and lower timeframes, this could be the right time to start accumulating with a long-term view.
A well-timed, low-risk entry could result in substantial gains.
📢 Don’t Miss Out!
✅ Follow for more smart money-based setups.
👍 Drop a like if this helped and comment with your thoughts!
💬 Let’s chat in the comments section. See you there! 🚀📊
Apollo TyresMarket Cap
₹ 25,953 Cr.
Current Price
₹ 409
High / Low
₹ 585 / 404
Stock P/E
19.2
Book Value
₹ 225
Dividend Yield
1.47 %
ROCE
16.4 %
ROE
13.2 %
Face Value
₹ 1.00
EPS
₹ 20.3
Promoter holding
37.4 %
Industry PE
25.0
Debt
₹ 4,801 Cr.
Dividend yield
1.47 %
Intrinsic Value
₹ 230
Reserves
₹ 14,245 Cr.
Debt to equity
0.34
Sales
₹ 25,958 Cr.
NP Ann
₹ 1,722 Cr.
EBIDT last year
₹ 4,587 Cr.
OPM
14.5 %
Qtr Sales Var
5.04 %
Total Assets
₹ 27,505 Cr.
Trade receivables
₹ 2,887
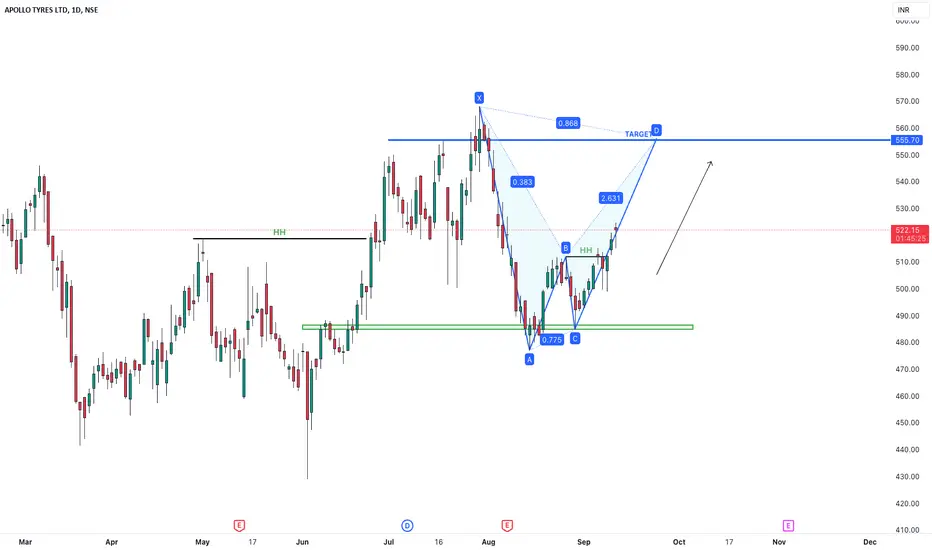
APPOLO TYRES-GOLDEN CROSSOVER N DAILYAppolo tyres showing stronger Price volume momentum,20DEMA Golden cross over other higher DEMAs n Daily chart suggests a move towards 550+,If gives a break out above 550 positionally expect it to test 575-600 based on the Triple bottomformation n weekly chart(For educational purpose only)
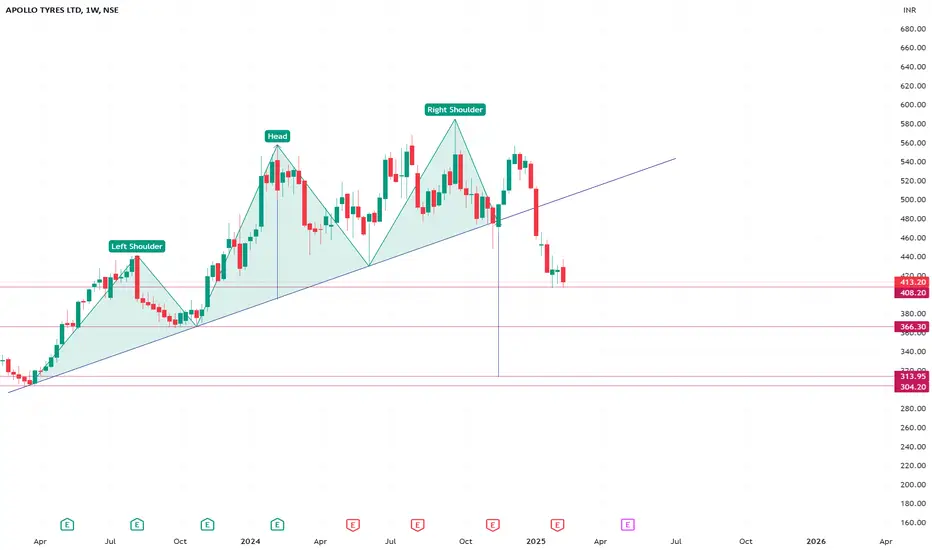
Apollo Tyres, Bearish Reversal with Divergences & Evening StarStock : Apollo Tyres
CMP : 499
Timeframe : Monthly
Pattern : Bearish Reversal with Divergences & Evening Star
Trade Type : Short
Price Action & Technical Analysis
- Bearish Divergence
- MACD Down
- Price is below 5 Moving Average
Target 1 - Rs. 436
Target 2 - Rs. 366
Stoploss - Rs. 520
Disclaimer : "The information provided in this content is for educational purposes only. Please do your own research and consult with a professional financial advisor before making any investment or trading decisions. The author is not responsible for any financial losses incurred as a result of applying the information contained in this material."
APOLLO TYRES LTD S/RSupport and Resistance Levels:
Support Levels: These are price points (green line/share) where a downward trend may be halted due to a concentration of buying interest. Imagine them as a safety net where buyers step in, preventing further decline.
Resistance Levels: Conversely, resistance levels (red line/shade) are where upward trends might stall due to increased selling interest. They act like a ceiling where sellers come in to push prices down.
Breakouts:
Bullish Breakout: When the price moves above resistance, it often indicates strong buying interest and the potential for a continued uptrend. Traders may view this as a signal to buy or hold.
Bearish Breakout: When the price falls below support, it can signal strong selling interest and the potential for a continued downtrend. Traders might see this as a cue to sell or avoid buying.
20 EMA (Exponential Moving Average):
Above 20 EMA: If the stock price is above the 20 EMA, it suggests a potential uptrend or bullish momentum.
Below 20 EMA: If the stock price is below the 20 EMA, it indicates a potential downtrend or bearish momentum.
Trendline: A trendline is a straight line drawn on a chart to represent the general direction of a data point set.
Uptrend Line: Drawn by connecting the lows in an upward trend. Indicates that the price is moving higher over time. Acts as a support level, where prices tend to bounce upward.
Downtrend Line: Drawn by connecting the highs in a downward trend. Indicates that the price is moving lower over time. It acts as a resistance level, where prices tend to drop.
RSI: RSI readings greater than the 70 level are overbought territory, and RSI readings lower than the 30 level are considered oversold territory.
Combining RSI with Support and Resistance:
Support Level: This is a price level where a stock tends to find buying interest, preventing it from falling further. If RSI is showing an oversold condition (below 30) and the price is near or at a strong support level, it could be a good buy signal.
Resistance Level: This is a price level where a stock tends to find selling interest, preventing it from rising further. If RSI is showing an overbought condition (above 70) and the price is near or at a strong resistance level, it could be a signal to sell or short the asset.
Disclaimer:
I am not a SEBI registered. The information provided here is for learning purposes only and should not be interpreted as financial advice. Consider the broader market context and consult with a qualified financial advisor before making investment decisions.