BAJAJ-AUTO | Monthly ChartPrice is sitting at a confluence zone right now:
Rising trendline (support since 2023)
Horizontal support / breakout retest zone: 10,000-10,010
CMP: ~10,045
Plan:
✅ Holds 9,900 on a monthly closing basis → good reversal setup from trendline + horizontal support
❌ Breaks 9,900 → setup fails, next major support is 9,442
Two supports stacked at one spot is where reversals tend to start. Let the price confirm; don't predict.
Educational purpose only. Not a recommendation.
Bajaj Auto Limited
No trades
No trades
In-depth trading ideas
Why Bajaj Auto Short Setup ?🔹 Historical Supply zone: ₹11,874 – ₹12,459 on the monthly chart. Price has rejected from this zone, confirming its significance as a strong resistance area
🔹 Daily Supply Zone 1: Around ₹11,880
This zone has already been tested, so the supply has weakened to some extent.
🔹 Daily Fresh Supply Zone 2: Around ₹12,124
A fresh supply zone on the daily chart. If price moves back into this area and shows bearish rejection/price action, it can present a potential short opportunity.
Trade Type - shor
BAJAJ AUTO - Potential Distribution Phase | Short Setup & TargetHello traders, let me share a detailed price action breakdown and a short trade setup for BAJAJ AUTO (Daily Chart).
After printing a high around the 11,856–11,863 level in early August, the stock has struggled to close above this mark for over 9 consecutive trading sessions. The current price action displays classic characteristics of a distribution phase, suggesting buying momentum is exhausting near the top.
Key Technical Observations:
Resistance & Consolidation: Price is currently capped
BAJAJ_AUTO (D) CHARTTechnical Note: Let the market come to your zones and show its hand. Trade safely and manage your risk! Always wait for your own confirmations before entering the market.
Risk Disclaimer: This analysis is for educational purposes only and does not constitute financial advice. Always practice proper risk and position sizing. The market is supreme; no one can make a 100% accurate prediction. Stop Loss Must if you want to be a profitable Trader.
MARKET VIEW:-
Current Bias: BEARISH
Preferred Strat
BAJAJ_AUTO Technical Note: Let the market come to your zones and show its hand. Trade safe and manage your risk! Always wait for your own confirmations before entering the market.
Risk Disclaimer: This analysis is for educational purposes only and does not constitute financial advice. Always practice proper risk and position sizing. Stop Loss Must if you want to be a profitable Trader.
Bajaj autoTrend
✅ Long-term trend remains bullish.
Price is trading above both the 91-week SMA (₹9,028) and 141-week SMA (₹8,884).
The current decline looks like a pullback within an uptrend, not a trend reversal.
Your levels
Entry: ₹9,288
Stop Loss: ₹8,624
Target: ₹12,000
These levels make sense because:
₹9,250–9,350 is a strong support/retest zone.
₹8,620 lies below the recent swing low and below the long-term moving averages. If price closes below this level on a weekly basis, the bullish structure
Bajaj Auto Testing ResistanceDaily Timeframe Analysis of Bajaj Auto
The stock is currently facing a strong resistance zone near 10,800 – 10,900 levels. Price action indicates that sellers are active around this area, making it a crucial zone for the next directional move.
For bearish momentum confirmation, a breakdown below the 10,300 support level could trigger further downside pressure, with the stock potentially correcting towards the 10,040 zone in the coming sessions.
View remains bearish until the resistance zone i
Tight Range, Big Potential: Bajaj Auto Breakout Setup ExplainedOn the weekly chart of Bajaj Auto Limited, price action has been quietly building up pressure over the past several months — and it’s now approaching a key inflection point.
What stands out here is a clear volatility contraction pattern.
Price has been moving within a tightening structure of lower highs and higher lows, forming HUNT volatility funnel. @TheCryptoSniper
These phases don’t last forever — they usually resolve with a strong directional move.
We’re now seeing price push into the
BAJAJ-AUTO – Technical & Educational Snapshot________________________________________
📊 BAJAJ-AUTO – Technical & Educational Snapshot
Ticker: NSE: BAJAJ-AUTO
Sector: 🚗 Automobile
CMP: 9,994 ▲ (+4.72% | 02 May 2026)
Learning Rating: ⭐⭐⭐⭐☆ (Momentum Expansion within Uptrend)
Chart Pattern Observed: 📊 Uptrend Continuation with Consolidation Break Attempt
Candlestick Pattern Observed: Strong Bullish Candle | Three Inside Up
________________________________________
📊 Technical Snapshot
BAJAJ-AUTO is continuing its broader uptrend, with recent p
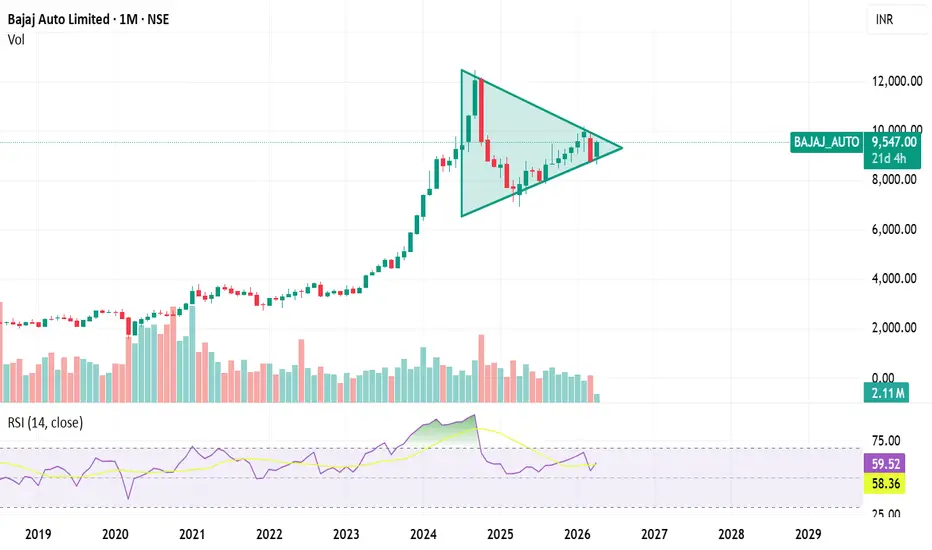
# "Symmetrical Triangke Formation -Price Compression Observed"
The pattern is formed after a prior directional move , which may indicate continuation charecterstics.
Volume appears to be gradually declining,which is typically observed during consolidation phase.
Price is approaching to the apex of the triangle, suggesting a potential expansion in volatility in the coming sessions.
Crash??? Bajaj-Auto ? Short term Selling ??⚠️ Risk Disclaimer:
This analysis is for educational purposes only. It is not financial advice. Please do your own research before taking any trade. Markets are inherently risky, and proper risk management is essential.
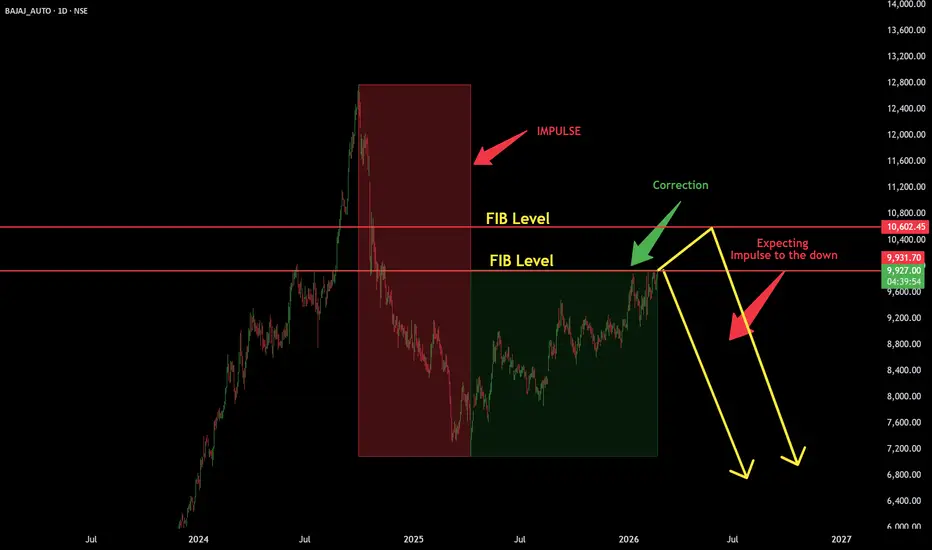
Bajaj Auto previously showed strong selling pressure as visible on the chart. After that sharp move, price has been consolidating and moving sideways.
Now, time-wise the structure looks mature, and we may be approaching a zone where price could attempt another downside impulse.
Bajaj Auto Ltd. – Weekly Technical View: Bearish SetupBajaj Auto appears to have completed a five-wave impulsive decline, establishing a broader corrective phase within the larger trend structure. The subsequent rebound unfolded as a corrective retracement, with price advancing into the Fibonacci golden ratio zone (61.8%), a region typically associated with counter-trend exhaustion.
The current structure suggests that the recovery may have concluded, with price showing signs of vulnerability near resistance. This raises the probability of a renewe
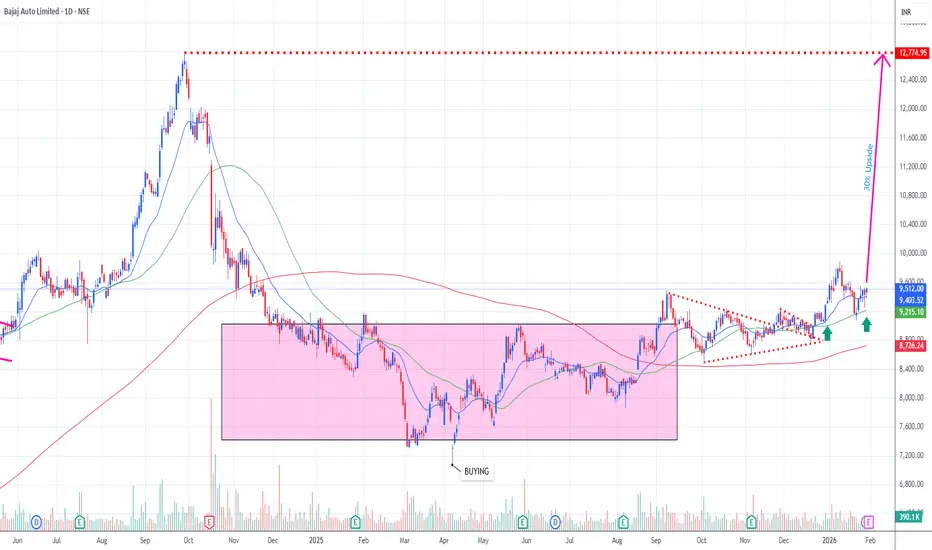
30% Upside PotentialTechnical View – Bullish Breakout Setup
The stock has been in a strong base formation for nearly the last one year. It is now breaking out of this base and has started forming a clear series of higher highs (HH) and higher lows (HL), indicating a trend reversal.
While other stocks in the auto sector were making all-time highs, this stock remained in consolidation, suggesting accumulation at lower levels. With the recent breakout, the stock now shows potential to move higher toward its previou
Educational Insight | Bajaj Auto (Technical Observation)
Bajaj Auto — where structure aligns with momentum
- Price has resolved above a long weekly cup range, followed by a decisive RSI regime shift above 60 after nearly a year.
- Daily structure supports the move with higher highs and sustained strength above key levels.
- Trend transitioning from range → expansion.
BAJAJ AUTO – Daily Chart AnalysisBajaj Auto is forming a squeeze between ascending trendline support and a strong supply zone, indicating a high-probability breakout setup. Trade only on confirmation and not anticipation.
Breakout = Momentum trade
Pullback = Low-risk swing trade
📌Structure: Higher-lows forming since March 2025 + price consolidating under a strong supply zone.
📍 Key Levels:
Resistance / Supply Zone: ₹9,250 – ₹9,350
Trendline Support: Rising from ₹7,900
EMA 34: Price currently hovering around it, acting as dyn
BAJAJ AUTO !! AWATING BREAKOUTThe stock is into narrow range (on Weekly TF). It's Making Higher Highs & Higher lows. The ascending triangle indicates slow down of downward momentum. After breakout it may give around 30 percent Upside. The volume accumulation support the bullish bias. Wait for a pullback after breakout !!!