BAJFINANCE 210min — Four Lower Highs, Then a Change of Tone📊 THE SETUP
NSE is closed for the weekend, so this is a review of Friday's last session — no live prices here.
Bajaj Finance spent the last three weeks making one thing very clear: every rally got sold a little earlier than the one before it. The sequence of highs reads 1,107 → 1,081.50 → 1,067 → 1,061.40 . Four lower highs, no argument.
📉 THE MOVE
Selling has not been quiet. The candle that printed the low at 1,034.80 carried 3.57M shares against a 40-bar average near 2.26M — roughl
In-depth trading ideas
BAJAJ FINANCEBajaj Finance — Updated Trade Assessment
Overall: 🟢 STRONG BUY SETUP | 8.8/10
The revised entry improves the trade materially. Moving Entry-2 to ₹1,020 brings the average entry down from ₹1,042 to ₹1,037, reducing risk while keeping the same target structure.
1. Trade Structure
Entry 1: ₹1,053
Entry 2: ₹1,020
Average Entry: ₹1,037
SL: ₹1,001
Risk: ₹36/share → 3.47%
Target: ₹1,329
Reward: ₹292/share → 28.2%
Gross RR: 8.11:1
Net RR: 7.07:1
Position Target: ₹1,304
Final Target: ₹1,329
2. Why the
BAJFINANCETechnical Note: Let the market come to your zones and show its hand. Trade safely and manage your risk! Always wait for your own confirmations before entering the market.
Risk Disclaimer: This analysis is for educational purposes only and does not constitute financial advice. Always practice proper risk and position sizing. The market is supreme; no one can make a 100% accurate prediction. Stop Loss Must if you want to be a profitable Trader.
MARKET VIEW:-
Current Bias: BEARISH
Preferred Strat
Bajaj Finance Breaks Record High: Bulls Eye ₹1,580Fundamental Overview
Bajaj Finance continues to maintain its leadership in the NBFC sector through consistent loan book expansion, strong digital adoption, diversified lending portfolio, and disciplined risk management. Its latest quarterly performance exceeded market expectations, prompting multiple brokerages to raise their target prices.
Key Financial Ratios
P/E Ratio: ~34x
Price-to-Book: ~5.6x
ROE: ~18%
ROA: ~3.8%
Debt-to-Equity: ~3.15x (normal for lending businesses)
Current Ratio: ~2.7
Div
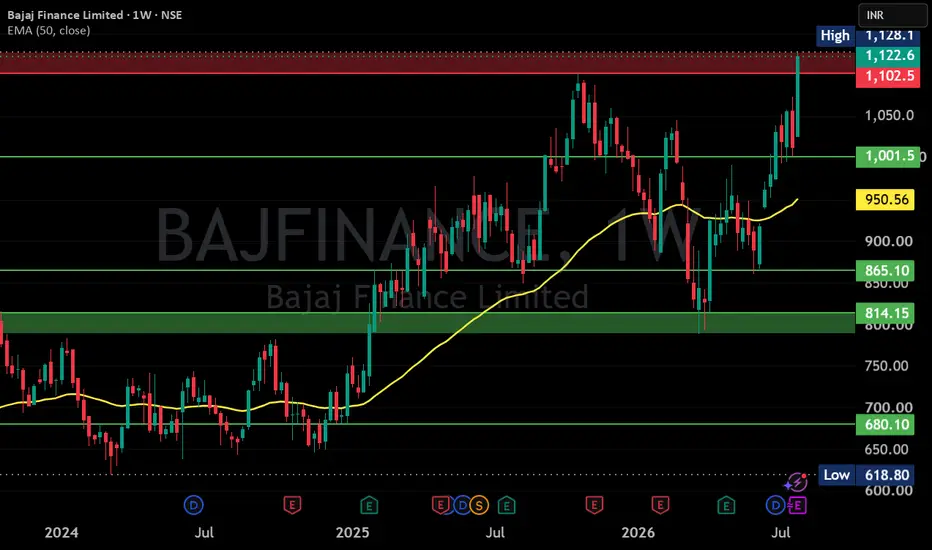
BAJAJ FINANCE LTD S/R
Support and Resistance Levels:
Support Levels: These are price points (green line/shade) where a downward trend may be halted due to a concentration of buying interest. Imagine them as a safety net where buyers step in, preventing further decline.
Resistance Levels: Conversely, resistance levels (red line/shade) are where upward trends might stall due to increased selling interest. They act like a ceiling where sellers come in to push prices down.
Breakouts:
Bullish Breakout: When the price mo
BAJFINANCE: 1H Impulsive Expansion & Moving Average 📊 Bajaj Finance Limited (BAJFINANCE) - 1-Hour (1H) Chart Analysis
This post is shared for EDUCATIONAL PURPOSES ONLY to analyze short-term trend continuations, moving average ribbon fanning, and structural breakouts. It is not financial or investment advice.
🎯 Educational Swing Setup:
• Entry Zone: 1,025.00 – 1,056.30 (Sizing into position blocks near current levels, or maximizing risk-to-reward by accumulating on minor 1H pullbacks toward the 9-EMA or 15-EMA support bands).
• Target 1: 1,120.0
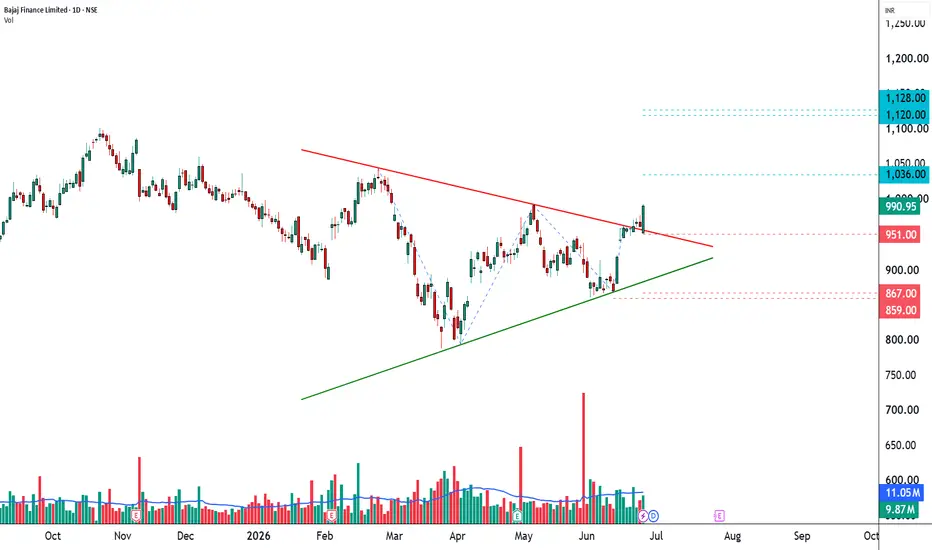
BAJFINANCE Emerging From 4-Month Compression────────────────────────
📊 STWP BREAKOUT ANALYSIS
Stock: Bajaj Finance Limited (BAJFINANCE)
Trend: Bullish
Pattern: Symmetrical Triangle Breakout
Range High/Low: 1046 - 792.45
Range Duration: 4 Month
Breakout Probability: Strong (89%)
Volume Participation: High | Volume Expansion: 0.89x
Breakout Level: 993
Retest Level/Levels: 960.00
Invalidation Level/Levels: 951 | 867.00 | 859.00
Reference Level/Levels: 1,036.00 | 1,120.00 | 1,128.00
Next Level: Watch Reference Levels
───────────────────────
BAJFINANCE: From Weakness to Strength – Breakout in Play🧾 Fundamental Analysis
Bajaj Finance Limited continues to stand out as one of India’s highest-quality NBFCs with a strong compounding track record.
🔹 Business Strength
Market leader in consumer lending & retail finance
Diversified portfolio across:
Personal loans
Consumer durable financing
SME & commercial lending
Strong digital ecosystem driving customer acquisition
🔹 Growth Momentum
Consistent AUM and revenue growth over the years
Loan book expansion supported by rising credit demand
Customer
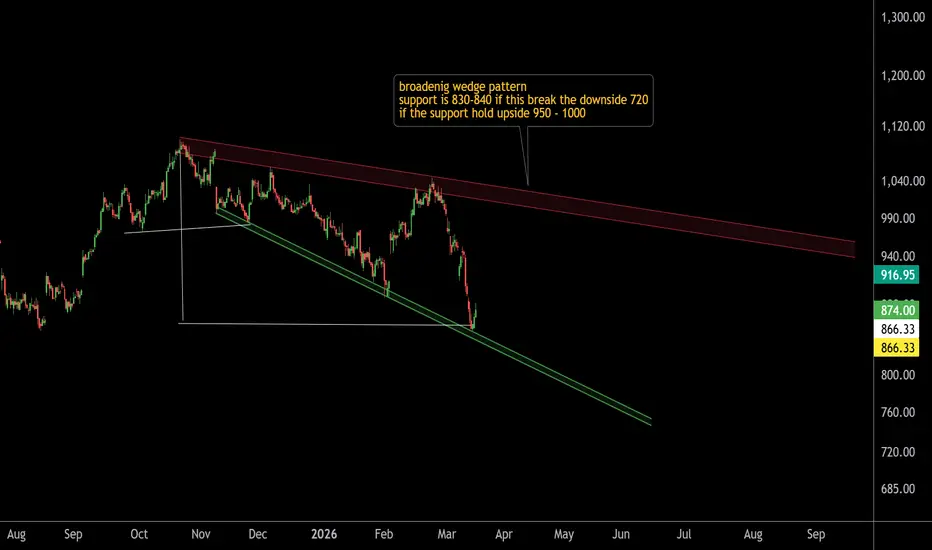
BAJFINANCE Near Important Pattern Support ZoneThis is the 4-hour timeframe chart of Bajaj Finance.
The stock is currently trading near a key pattern support zone around 830–840.
If this support zone holds and the price sustains above it, the stock may move toward the pattern resistance zone of 950–1000.
However, if this support level breaks, the downside pattern target could extend toward the 720 level.
THANK YOU
analysis of Bajaj Finance (BAJFINANCE)This chart shows a 15-minute technical analysis of Bajaj Finance (BAJFINANCE) on TradingView. The setup suggests a potential trend reversal or a breakout from a long-term bearish structure.
Here is a breakdown of the key elements visible:
1. The Descending Channel (Price Action)
The price has been trading within a Descending Channel (the shaded red and blue area). This represents a series of lower highs and lower lows, which is a classic bearish trend.
The Upper Boundary: Acts as resistance.
NSE – NIFTY 750 | BAJAJ FINANCE | 08 Mar 2026Bajaj Finance Ltd has exhibited one of the strongest secular structural advances in the Indian equity market.
After forming a long base during the late 1990s and early 2000s, the stock transitioned into a sustained multi-year expansion that accelerated significantly during the 2010–2021 period.
Recent price behaviour suggests momentum cooling following an extended multi-year advance, with consolidation developing near elevated levels.
Structure assessed from earliest reliable data.
Disclaim
BAJFINANCE – STWP Equity Snapshot📊 BAJFINANCE – STWP Equity Snapshot
Ticker: NSE: BAJFINANCE
Sector: 🏦 NBFC / Financial Services
CMP: 1,024.75 ▲ (+2.57% | 14 Feb 2026)
Learning Rating: ⭐⭐⭐⭐☆ (Momentum Recovery Within Broader Range)
Chart Pattern Observed: 📈 Pullback from Prior Swing High into Recovery Attempt
Candlestick Context: Strong Bullish Candle with Elevated Participation
📊 Technical Snapshot
BAJFINANCE is currently transitioning from a corrective decline into a short-term recovery phase after reacting from the broade
Deep Crab Harmonic Pattern — Bajaj Finance Volume: Strong institutional activity
Current Price Context: Trading near completion zone
📐 Pattern Geometry & Ratios
AB = 0.929 of XA → Deep retracement, acceptable for Crab variants
BC = 0.658 of AB → Within valid range
CD = 2.183 of BC → Strong extension, confirms Deep Crab structure
XA extension to D = 1.618 → Textbook Deep Crab completion
📊 Technical Context
Point D (PRZ) around 891.35 — potential reversal zone
Price action shows exhaustion near PRZ
RSI readings indicate oversold conditio
Bollinger Band + RSI Divergence📉 Bollinger Band + RSI Divergence Reversal Framework
This chart demonstrates how Bollinger Bands and RSI can be combined to identify early reversal zones during extended pullbacks, instead of chasing breakdowns or reacting late.
Rather than using Bollinger Bands or RSI as standalone signals, this framework focuses on:
Price expansion into volatility extremes
Momentum exhaustion via RSI divergence
Mean-reversion behavior back toward value
This approach is designed to anticipate trend pau
BAjaj Finance : Wait for the right time to enter. CMP 950.25 : there was a runaway gap from 898.85 to 915. jsut now we are very near to that region. the candle on 16th Jan looks green, bot we can see that the actual selling was around 50% height of that candle. that is equal to the last 3 candle before it. if it comes in the gap region wait for price action to emerge on a 15 min candle, before jumping in to buy. and that too only 50% of what you wanted to buy. the beat buy will be between 866-875. and the harmonic pattern gives me 878.5. patie
BAJFINANCE | Reaction from demand zone after breaker retestBAJFINANCE has shown a sharp sell-off followed by price stabilisation near a higher-timeframe demand zone.
Key observations on the chart:
Price swept liquidity below recent lows and reacted strongly from the demand area
A clear breaker zone formed after the impulsive move down
Price is currently holding above the demand and attempting acceptance
The rejection wick from lower levels suggests buyers are defending this zone
As long as price holds above the marked demand, the structure support
Bajaj Finance Breaks Out of Multi-Year Channel!Bajaj Finance (BAJFINANCE) has finally broken out of a long-term consolidation channel on the upper side, signaling a potential bullish breakout. This breakout comes after more than three years of price action within a well-defined range.
🔎 Key Observations:
✅ Breakout Above Resistance: Price has decisively moved above the upper boundary of the channel.
✅ Strong Momentum: The breakout is supported by increasing volume, indicating strong buying interest.
✅ MACD Strength: The MACD indicator