$BOSCHLTD: Inverse H&S Breakout🏎️ 📈 🚘 💎 🚀
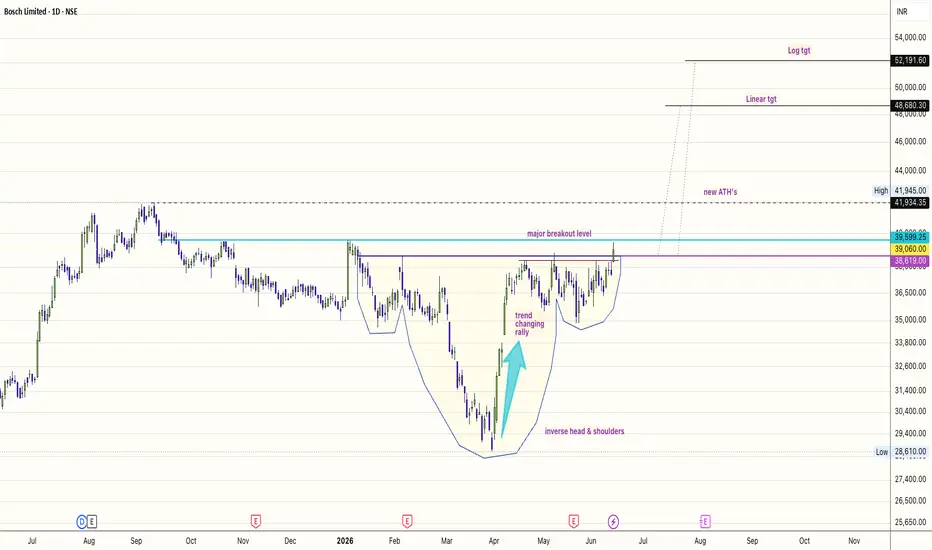
The Macro Setup: Structural Accumulation CompleteLook at the daily chart.
What we are witnessing is a textbook, massive Inverse Head & Shoulders pattern that has been grinding out its accumulation phase since mid-last year.
The Footprint: We saw a definitive trend-changing rally off the 28,600 structural low, followed by a tight, symmetric right shoulder consolidation.
The Breakout: Bosch has cleanly cleared the major breakout level at 39,599, piercing right through local resistance blocks with accelerating momentum.
With price breaking out into new All-Time Highs (ATHs), the overhead supply is completely wiped clean.
This sets up a highly asymmetric expansion phase for the second half of this calendar year.Why Bosch Commands (and Deserves) a Premium Many market participants mistakenly value auto-component players on a linear curve.
Bosch defies this by consistently commanding a steep scarcity premium.
As the industry transitions into advanced powertrain technology, electronics, and stricter safety standards, Bosch isn't just a supplier—they own the core architecture.
Their deep engineering moat justifies every bit of their premium multiple.
1. The MNC Moat vs. Domestic Suppliers
The core of Bosch’s dominance lies in the unique Multinational Parent vs. Domestic Supplier dynamic:Global R&D Leverage: Local domestic suppliers have to build proprietary tech from scratch or pay massive licensing fees.
Bosch India simply plugs straight into the global parent company's multi-billion dollar engineering ecosystem.
The Tech Transition: Whether it’s advanced electronic control units (ECUs), driver-assistance software, or complex fuel-injection systems, the global parent has already battle-tested the technology in Western markets.
Bosch India can localise and deploy these premium products at a speed and margin structure that purely domestic peers cannot match.
Tier-1 Sticky Relationships: Global automotive OEMs demand uniformity across regions. Because Bosch is embedded at the global design level for these manufacturers, they naturally capture the highest-margin component share when those models are manufactured or updated domestically.
2. The H2 Catalyst: Content per Vehicle Tailwinds
The second half of this calendar year will be driven by a massive structural trend:
Premium-isation.
The shift in consumer demand toward premium SUVs and high-spec vehicles plays directly into Bosch’s hands.
As OEMs shift their production mix toward higher-end trims, the dollar-content per vehicle supplied by Bosch scales exponentially.
They aren't just selling more units; they are selling vastly more expensive, tech-heavy systems into every vehicle rolling off the assembly lines.
The Targets & Execution
The breakout confirmation opens up clear outside expansion space:
Immediate Play: Retests of the 39,000–39,600 neckline zone are for aggressive buying.
Linear Target: $48,680
Logarithmic Target: $52,191
TSX:THE accumulation block is broken. Capital is rotating into pure quality.
Disclaimer: This is for educational and idea-sharing purposes only.
#BOSCH #AutomotiveTech #SwingTrading #PriceAction #Breakout #TradingView #ChartPatterns #NiftyAuto #ValueInvesting #TechnicalAnalysis
Manage your risk coordinates dynamically.
Bosch Limited
No trades
No trades
In-depth trading ideas
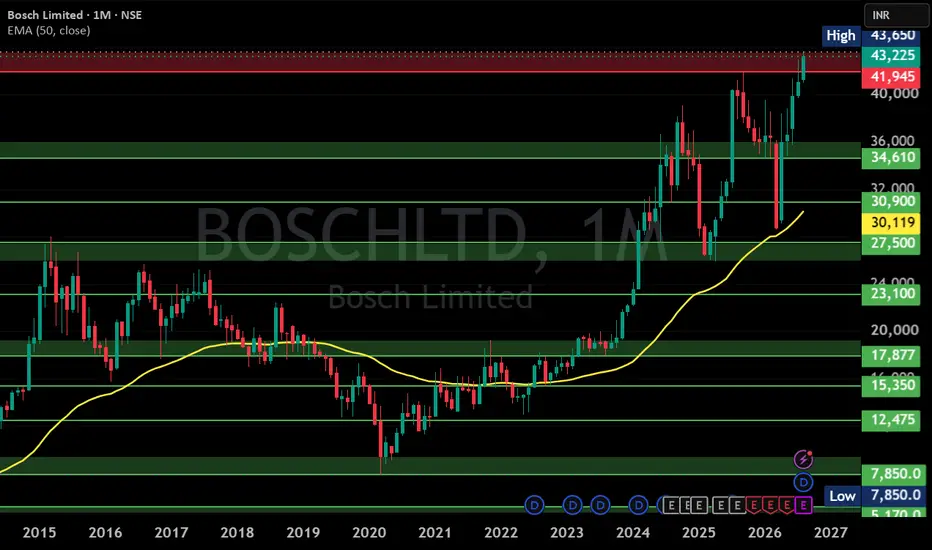
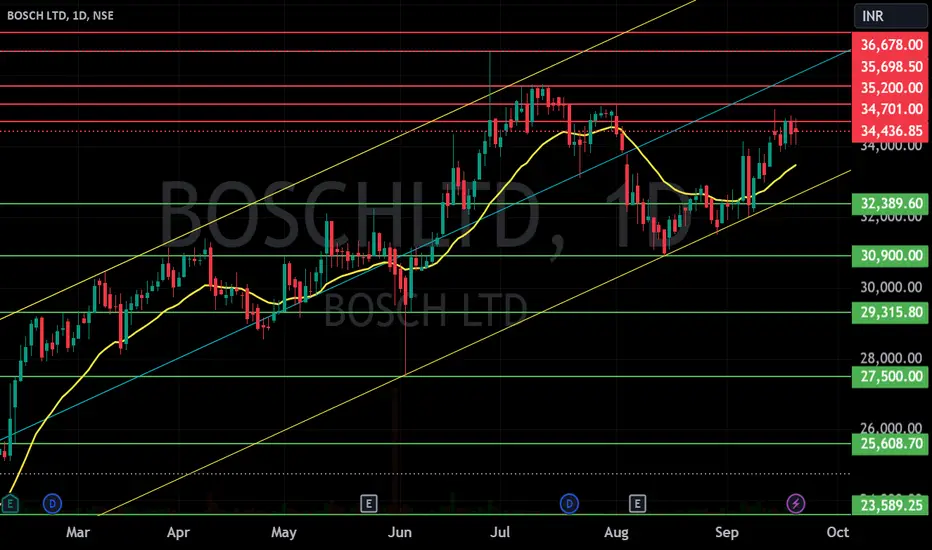
BOSCH LTD S/R
Support and Resistance Levels:
Support Levels: These are price points (green line/shade) where a downward trend may be halted due to a concentration of buying interest. Imagine them as a safety net where buyers step in, preventing further decline.
Resistance Levels: Conversely, resistance levels (red line/shade) are where upward trends might stall due to increased selling interest. They act like a ceiling where sellers come in to push prices down.
Breakouts:
Bullish Breakout: When the price moves above resistance, it often indicates strong buying interest and the potential for a continued uptrend. Traders may view this as a signal to buy or hold.
Bearish Breakout: When the price falls below support, it can signal strong selling interest and the potential for a continued downtrend. Traders might see this as a cue to sell or avoid buying.
Trendline: A trendline is a straight line drawn on a chart to represent the general direction of a data point set.
Uptrend Line: Drawn by connecting the lows in an upward trend. Indicates that the price is moving higher over time. Acts as a support level, where prices tend to bounce upward.
Downtrend Line: Drawn by connecting the highs in a downward trend. Indicates that the price is moving lower over time. It acts as a resistance level, where prices tend to drop.
Disclaimer:
I am not SEBI registered. The information provided here is for learning purposes only and should not be interpreted as financial advice. Consider the broader market context and consult with a qualified financial advisor before making investment decisions.
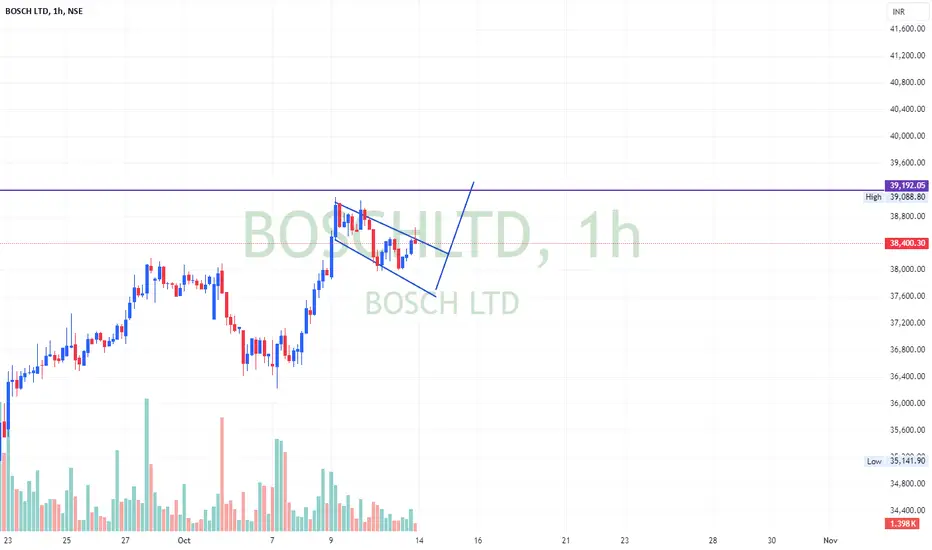
Will Bosch Ltd (BOSCHLTD) Reverse from this Level?Analyzing the current trend for Bosch Limited. The price is approaching a significant reversal zone. Check out my technical outlook on the daily chart. #BOSCH #Investing #StockMarketIndia #TradingIdeas #NIFTY
Technical analysis of Bosch Limited (NSE: BOSCHLTD). Identifying a key supply/reversal area on the daily timeframe. Is a pullback coming? Watch these levels closely for potential price action confirmation. #StockMarket #TechnicalAnalysis #BOSCHLTD #TradingView #StockAnalysis
Bosch LimitedPrice has given a simple trendline breakout, indicating a potential continuation of the upward move. If the breakout sustains above the trendline with good volume, the stock may gain around 6% from the breakout zone. Traders can watch for follow-through confirmation and manage risk with a tight stop-loss below the breakout level.
Bosch - Buy in Dip Summary:
Timeframe: Daily (1D)
Current Price: ₹38,585
Wave Structure:
The chart shows a completed Wave (3) and Wave (4) correction forming a contracting triangle (a–b–c–d–e).
The analysis anticipates an upcoming Wave (5) breakout move.
Targets:
Upside Breakout Potential: Around ₹45,721 (≈ +11.18% from current level).
Triangle Range: Roughly between ₹36,000 – ₹42,000 (≈ 10.33% range).
Pattern Insight:
The stock appears to be consolidating after a strong impulsive rally, with the next breakout likely to continue the bullish trend once the triangle resolves upward.
In short: The chart suggests Bosch Ltd is nearing the end of a consolidation phase and could rally ~11% if Wave (5) unfolds as expected.
Ye Chart Kuch Kehta Hai - BOSCH LimitedBOSCH Ltd demonstrates a strong bullish setup on the weekly chart, making it a compelling investment for the next few months. The breakout from a cup and handle pattern, supported by volume and momentum indicators, suggests the stock could outperform in the medium term. Consider a 3–6 month investment horizon, with ₹35,000 as a key support and ₹38,500–₹40,000 as the next target zone.
Key Technical Reasons
Cup and Handle Breakout
The chart displays a classic "cup and handle" pattern, a bullish continuation signal. The price has broken out above the handle resistance, suggesting the start of a new upward trend.
Strong Volume Confirmation
The breakout is accompanied by a notable increase in trading volume, which validates the strength of the move and indicates strong buying interest.
Trendline Break
The stock has decisively broken above a long-term descending trendline, signaling a shift from consolidation to a new bullish phase.
Momentum Indicators
RSI (Relative Strength Index): The RSI is above 70, indicating strong bullish momentum. While this can sometimes suggest overbought conditions, in the context of a breakout, it often signals the start of a sustained rally.
MACD: The MACD line is well above the signal line, further confirming bullish momentum.
Stochastic Oscillator: The stochastic is also in the overbought zone, which, during strong trends, can persist for extended periods.
Moving Averages
The price is trading above the 21-week EMA, reinforcing the bullish bias and indicating that the medium-term trend has turned positive.
Clear Resistance and Target Levels
The breakout level near ₹35,065 now acts as a strong support.
The next major resistance and potential target is around ₹38,486, as marked on the chart.
Suggested Investment Time Frame
Medium-Term (3–6 Months):
Given the strength of the breakout and supporting indicators, BOSCH Ltd is well-positioned for further gains over the next 3 to 6 months. The technical pattern suggests a medium-term rally towards the ₹38,500–₹40,000 zone, provided broader market conditions remain supportive.
DO NOT MISS THIS RALLY - JUST DO NOT - BOSCH LTDEverything is pretty much explained in the picture itself.
I am Abhishek Srivastava | SEBI-Certified Research and Equity Derivative Analyst from Delhi with 4+ years of experience.
I focus on simplifying equity markets through technical analysis. On Trading View, I share easy-to-understand insights to help traders and investors make better decisions.
Kindly check my older shared stock results on my profile to make a firm decision to invest in this.
For any query kindly dm.
Thank you and invest wisely.
BOSCHLTD BULLISH BUYAnalysis:
The chart displays a rising wedge pattern, indicating potential bullish momentum. The price is approaching the upper boundary of the wedge, suggesting a possible breakout. Key resistance is at 8,619.70 INR, with a target towards 8,972.10 INR if the breakout occurs. Support is at 8,115.65 INR.
Trade Idea:
Bullish Scenario: Breakout above 8,619.70 INR could lead to a rally.
Bearish Scenario: Failure to break out may see a drop to 8,115.65 INR.
BOSCH LTD S/R Support and Resistance Levels:
Support Levels: These are price points (green line/shade) where a downward trend may be halted due to a concentration of buying interest. Imagine them as a safety net where buyers step in, preventing further decline.
Resistance Levels: Conversely, resistance levels (red line/shade) are where upward trends might stall due to increased selling interest. They act like a ceiling where sellers come in to push prices down.
Breakouts:
Bullish Breakout: When the price moves above resistance, it often indicates strong buying interest and the potential for a continued uptrend. Traders may view this as a signal to buy or hold.
Bearish Breakout: When the price falls below support, it can signal strong selling interest and the potential for a continued downtrend. Traders might see this as a cue to sell or avoid buying.
20 EMA (Exponential Moving Average):
Above 20 EMA: If the stock price is above the 20 EMA, it suggests a potential uptrend or bullish momentum.
Below 20 EMA: If the stock price is below the 20 EMA, it indicates a potential downtrend or bearish momentum.
Trendline: A trendline is a straight line drawn on a chart to represent the general direction of a data point set.
Uptrend Line: Drawn by connecting the lows in an upward trend. Indicates that the price is moving higher over time. Acts as a support level, where prices tend to bounce upward.
Downtrend Line: Drawn by connecting the highs in a downward trend. Indicates that the price is moving lower over time. It acts as a resistance level, where prices tend to drop.
RSI: RSI readings greater than the 70 level are overbought territory, and RSI readings lower than the 30 level are considered oversold territory.
Combining RSI with Support and Resistance:
Support Level: This is a price level where a stock tends to find buying interest, preventing it from falling further. If RSI is showing an oversold condition (below 30) and the price is near or at a strong support level, it could be a good buy signal.
Resistance Level: This is a price level where a stock tends to find selling interest, preventing it from rising further. If RSI is showing an overbought condition (above 70) and the price is near or at a strong resistance level, it could be a signal to sell or short the asset.
Disclaimer:
I am not a SEBI registered. The information provided here is for learning purposes only and should not be interpreted as financial advice. Consider the broader market context and consult with a qualified financial advisor before making investment decisions.
Strategic Approach to Short-Term Trading in Bosch Ltd"Bosch Ltd is showing strong bullish signals across multiple timeframes. The daily, weekly, and monthly Relative Strength Index (RSI) are all above 65, indicating strong upward momentum. The Supertrend indicator is positive, suggesting a favorable trend for buyers. The stock has also experienced a breakout from its previous high. Furthermore, the closing price is consistently above the 21, 55, 100, and 200-day Exponential Moving Averages (EMAs), reinforcing the bullish sentiment. Lastly, the Relative Strength (RS) is above 0, further supporting the positive outlook. These factors combined present a compelling case for short-term trading opportunities in Bosch Ltd."
BOSCHLTDNSE:BOSCHLTD
One Can Enter Now !
Or Wait for Retest of the Trendline (BO) !
Or wait For better R:R ratio !
Note :
1.One Can Go long with a Strict SL below the Trendline or Swing Low.
2. R:R ratio should be 1 :2 minimum
3. Plan as per your RISK appetite and Money Management.
Disclaimer : You are responsible for your Profits and loss, Shared for Educational purpose