Canara Bank (Daily):Canara Bank (Daily):
A multi-month compression pattern is developing with declining volume, suggesting supply is gradually drying up.
🟢 Bullish Trigger: Strong daily close above the trendline with above-average volume could fuel a move towards ₹160–163.
🔴 Invalidation: A breakdown below ₹121 on heavy volume would negate the bullish setup.
Watch for price + volume confirmation and do not anticipate the move.
Note: Trade probabilities, not predictions.
In-depth trading ideas
Canara Bank Trend Lines in Multiple Time Frames. 6/210 Charts.In this video we take a look at Canara Bank. In it we look at a higher time frame, starting from monthly, going down all the way to the daily time frame.
The key take away is its comparison with the Bank Nifty and the consistency of the Trend Lines drawn with the previous charts.
#Canara #Bank #CanaraBank #Tutorial #Equity #Research #India #Stock #Market #Trend #Line #TrendLine #Nifty #50 #Support #Resistance #210Charts #FNO #Futures and #Options #Technical #Analysis #CNH #CupandHandle
A pin bar at support levelA pin bar (short for "Pinocchio bar") is a single-candle chart pattern indicating a sharp market reversal and rejection of a specific price level. Defined by a small real body near one end and a long, pronounced wick (or tail) that is usually at least two-thirds of the total candle length, it signals a potential shift in market direction
CANBK: Healthy Retest Before the Next Leg Up?Canara Bank is currently hovering around 157,
showing some consolidation near its recent 52-week highs.
While the long-term structure remains bullish, the price action suggests a short-term "liquidity grab" is likely before the next major breakout.
The Setup:
CMP: 157
Retest Zone: I am looking for a pullback to the 138–136 level.
The Move: A successful retest of the 138 bottom will shake out weak hands and provide the fuel needed for a fresh rally.
Targets:
Once the support at 138 is confirmed, expect a swift recovery to:
Target 1: 160 (Previous Resistance)
Target 2: 165+ (New Lifetime Highs)
Bottom Line: Don't chase at 157. Patiently waiting for the 138 retest offers a much better Risk-to-Reward ratio for the move toward 160+.
Disclaimer: For educational purposes only. Trade at your own risk.
Canara Bank ..an Ideal Buy Dip candidateOne of the strongest performers of the banking industry is the Canara bank which has made a new high of 160.79 in the last month. But now the stock has seen a negative divergence from its 14 day RSI which means there could be a short term correction within the broader uptrend. Looking at the broader banking index performance there seems to be good support for the stock at 130-120 region, where we have plenty of buying interest seen in the near past.
The stock prices are currently above the 100 day moving average which makes it noteworthy that the correction may not last for long time. While this stock happens to be a strong performer in the PSU segments there is plenty of scope for the prices to stay buoyant and make new highs.
For the time being any dips to the region of 130 to 120 can be a strong buying interest but in case there is more pain left in the banking industry, which doesn't look like, with interest rates not likely to go down beyond the point or rather consolidation of the interest rates can happen , there is a fair amount of possibility that the stocks can make new high.
Canara Bank – Breakout With Retest, Momentum BuildingBullish | Timeframe: 1Y | Type: Positional Swing
Chart Setup:
Canara Bank has broken out of a 15-month consolidation zone above the ₹112–₹114 resistance, which acted as a neckline. Price rallied sharply from the ₹85 base, and the breakout was supported by strong volumes and momentum.
The most recent candle shows a shallow retest, with an intraday dip to ₹109 followed by a strong close above the breakout zone — classic confirmation of support holding.
Measured Move Target: ₹150–₹160
Invalidation / Stop Loss: Close below ₹108
Rationale:
Strong price-volume structure
Retest of breakout zone successful
PSU banking theme in favour
Momentum intact above all major moving averages
Disclaimer:
This idea is purely for educational purposes and reflects a technical setup based on chart patterns and price action. It is not a recommendation to buy or sell securities. PSU banks can be volatile and sensitive to macro/policy triggers. Traders should manage risk independently, use stop-loss, and size positions based on personal risk tolerance. Always do your own due diligence before taking any trade.
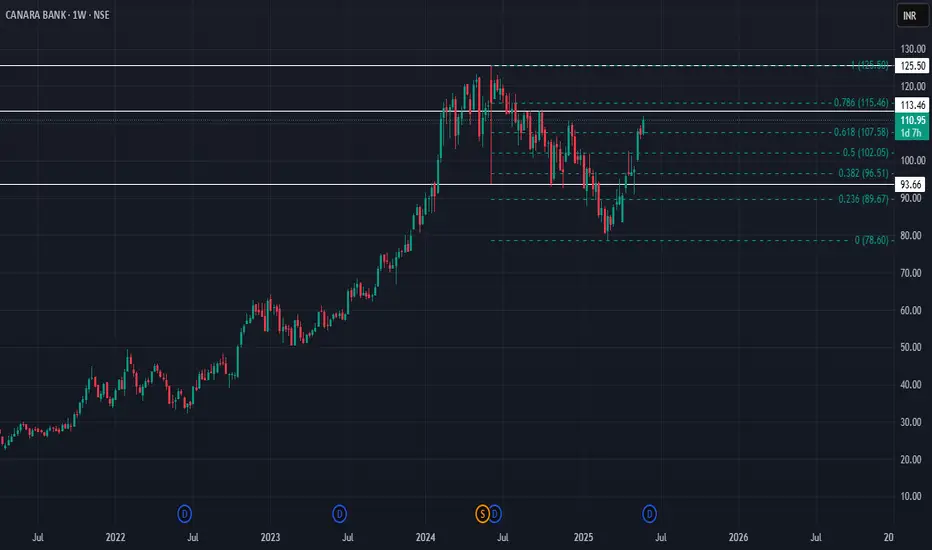
Canara Bank: Rounding Bottom Breakout in Progress!🚀 Canara Bank: Rounding Bottom Breakout in Progress! 🚀
📉 CMP: ₹111.8
🔒 Stop Loss: ₹104
🎯 Targets: ₹126 | ₹140
🔍 Why It Looks Promising?
✅ Rounding Bottom Formation
✅ Breakout Above Key Fibonacci 62% Level
✅ Sectoral Strength: Banking & Financials are poised to lead the next leg of the Nifty rally—and Canara Bank could be a key driver.
💡 Strategy & Risk Management
📈 Staggered Entry: Accumulate in phases near support for better risk control
🔒 Strict SL: Protect downside with a disciplined stop loss at ₹104
📍 Outlook: Strong technical breakout with sector tailwinds makes Canara Bank a compelling swing and positional trade setup.
📉 Disclaimer: Not SEBI-registered. Please conduct your own research or consult a financial advisor before investing.
#CanaraBank #BankNifty #BreakoutTrade #FibonacciLevels #SwingTrading #TechnicalAnalysis #StockMarketIndia #InvestSmart
CANARA BANK✅ CANARA BANK — Summary
📌 Trend Overview
HTF (Yearly, Half-Yearly, Quarterly): Strong UP
MTF (Monthly, Weekly, Daily): UP
ITF (240m, 180m, 60m): UP
➡️ Full alignment UP across all timeframes — high probability long setup.
📍 Key Demand Levels
HTF Avg Demand: 97
MTF Avg Demand: 124
ITF Avg Demand: 124
➡️ Micro → Macro demand confluence between 121–127.
🎯 Trade Plan
Entry 1: 130
Entry 2: 125
Avg Entry: 128
Stop-Loss: 121
Risk per share: 9
Targets
First Target: 180
Positional Target: 215
Upside Potential: 217
📈 Risk–Reward
Potential Profit: 617,500
Net Profit: 611,250
Max Loss: 96,250
Net RR: 6.35 (Excellent)
🔮 Gann Confirmation
Gann High (Uptrend): 145
➡️ Staying above 145 = strong continuation.
💹 ROI
If target hits in 12 months: +584,848
If target hits in 4 months: 131% ROI
⭐ Overall Summary
CANARA BANK is a high-conviction long trade.
All timeframes in UPTREND, strong demand between 121–127, excellent RR 6.35, and solid upside towards 180 → 215.
Plan for 31st October 2025 Nifty future and banknifty future analysis and intraday plan.
Quarterly results- analysed.
This video is for information/education purpose only. you are 100% responsible for any actions you take by reading/viewing this post.
please consult your financial advisor before taking any action.
----Vinaykumar hiremath, CMT
WEEKLY CUP & HANDLE IN CANBKLong term cup and handle formation in weekly time frame.
breakout above 129 on weekly basis will be the good opportunity to enter
1st Target = 165
2nd Target = 178
Also as per Elliot wave wav3 (3) one of the strongest on going.
one can go long with short term view with mentioned target.
This chart includes
1) Pattern = cup & handle
2) Breakout = 129
3) Elliot wave = wave 3(3)
considering all 3 Canbk looks bullish strongly.
Canara Bank - Breaking Bad with Volumes!Breakout from Base with Rising Volume in NSE:CANBK - NSE:CNXPSUBANK
📈Pattern & Setup:
The stock has just broken out from a falling wedge pattern on the weekly chart with a strong bullish candle.
Breakout is backed by heavy volume, indicating strong institutional participation.
Structure shows a clean base formation between 100–120, followed by a decisive breakout above 125.
📝 Trade Plan:
Entry: Current levels 125–126 look suitable for early entry.
🚩Stop-Loss: 115 (below recent base).
🎯Targets:
Target 1 → 150 (previous resistance zone).
Target 2 → 178 (extended measured move, nearly 38% upside).
💡Pyramiding Strategy:
1. Enter first lot around 125–126.
2. Add above 135 breakout continuation, trail SL to 120.
3. Add final lot above 150, trail SL to 135.
Ride the momentum towards 178 zone.
🧠Logic Behind Selecting this Trade:
This setup represents a textbook breakout from accumulation. After months of sideways action, the breakout candle backed by strong volume confirms renewed strength. A retest towards 120–122 could act as a golden re-entry opportunity if missed initially.
Keep Learning. Keep Earning.
Let's grow together 📚🎯
🔴Disclaimer:
This is not an investment advice. Always do your own due diligence before making any trading or investment decision.
Canara Bank 🔥 Canara Bank – Breakout on the Cards! ⚡🚀
💰 Capital to Deploy: ₹20K
📌 Entry: ₹122
⚡ Breakout: ₹122
🛑 SL: ₹105
🎯 Targets: ₹147 / ₹301
PSU banking space heating up 📈
Chart looks primed for a multi-leg rally 🔥
Solid risk–reward swing setup for bulls 💪
RT to spread the momentum 🚀
#CanBank #StocksToWatch #StocksInFocus #StocksToTrade #BreakoutStocks #SwingTrading #StockMarketIndia #Chennai
Canara Bank Double Bottom Breakout (1h, NSE)A logical buying idea for Canara Bank, based on this chart, would be to consider entries near the fair value gap (demand spot) and discounted price regions, with clear stop-loss and target plans.
Suggested Buying Plan
Entry Zone
Buy Between: 106.30–107.00 INR
This area is marked as the “Fair value gap (Demand Spot)” and overlaps with the recent bullish move from a double bottom. It also aligns with the discounted price range below 110 INR shown on the chart.
Stop-Loss
Below 106.00 INR
Set a stop-loss just below 106.30 INR to manage downside risk, as a drop below this level could invalidate the bullish setup visible on the chart.
Targets
Target 1: 110.90–111.00 INR (Resistance 2, Fibonacci 0.5 zone)
Target 2: 113.47–113.92 INR (Fibonacci 0.786/0.836 zone)
Extended target: 115.38 INR (Fibonacci 1.0 level)
Logic
The double bottom pattern and CHoCH signal early trend reversal, suggesting momentum is shifting bullish.
Entering near the demand spot provides a good risk-reward setup with minimal downside.
Resistance and Fibonacci zones offer logical profit-taking areas as shown by prior swing levels and retracement targets.
Note: Price action near 108.13–108.57 INR (Resistance Breakout Zone) may see temporary rejection; consider scaling in at the demand zone or on retests. Always adjust position sizing and risk according to the overall portfolio and market volatility.
Disclaimer: lnkd.in
Momentum building… Canara Bank in the spotlightCanara Bank (CANBK) Technical View
Canara Bank is currently trading within a well-defined parallel channel and has recently bounced strongly from its demand zone near 100–105.
At the same time, the stock is also moving inside a falling channel pattern, which provides important reference levels:
Support is placed around 105–107
Resistance is seen near 115 and 122
Importantly, the stock is sustaining above its daily, weekly, and monthly pivot levels, signaling strong upside potential. In addition, the RSI is holding above 50, which indicates momentum is building and a strong move could emerge at any time.
If the stock manages to hold the support levels, there is a strong possibility of witnessing higher prices in Canara Bank in the coming sessions.
Thank you.