CESC inverted H&S CESC Ltd – Head & Shoulders Reversal Watch
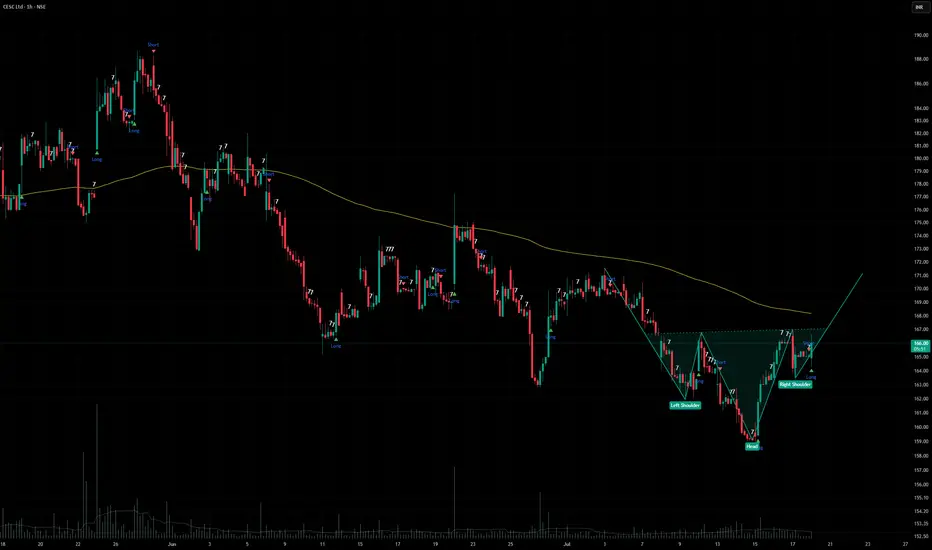
Setup: 1‑hour chart showing a Head & Shoulders formation with neckline in play.
Current Price Zone: ₹158 – ₹190.
Trend Context:
Left Shoulder, Head, Right Shoulder clearly defined.
Moving average providing dynamic support.
Long/Short signals marking trad
CESC Ltd
No trades
No trades
Compare with CESC Ltd
11.60 INR
15.42 B INR
185.70 B INR
657.89 M
Next report date
—
Report period
—
EPS estimate
—
Revenue estimate
—
Details
Sector
Industry
Website
Headquarters
Kolkata
Founded
1899
IPO date
Nov 3, 1994
ISIN
INE486A01021
FIGI
BBG000BKW9S7
Identifiers
ISIN INE486A01021
CESC Ltd. engages in the generation and distribution of electricity. Its projects include Chandrapur and Haldia Thermal Plant. The company was founded in 1899 and is headquartered in Kolkata, India.
CESC✅ CESC – Multi-Timeframe Analysis Summary
1. Higher Time Frame (HTF) – Strong Uptrend
TF Zone Trend Analysis Proximal Distal Avg
Yearly Demand UP Rally–Rally 134 109 122
6 Month Demand UP Rally–Rally 134 109 122
Quarterly Demand UP Rally–Base–Rally 150 109 130
HTF Average — UP — 139 109 124
Interpr
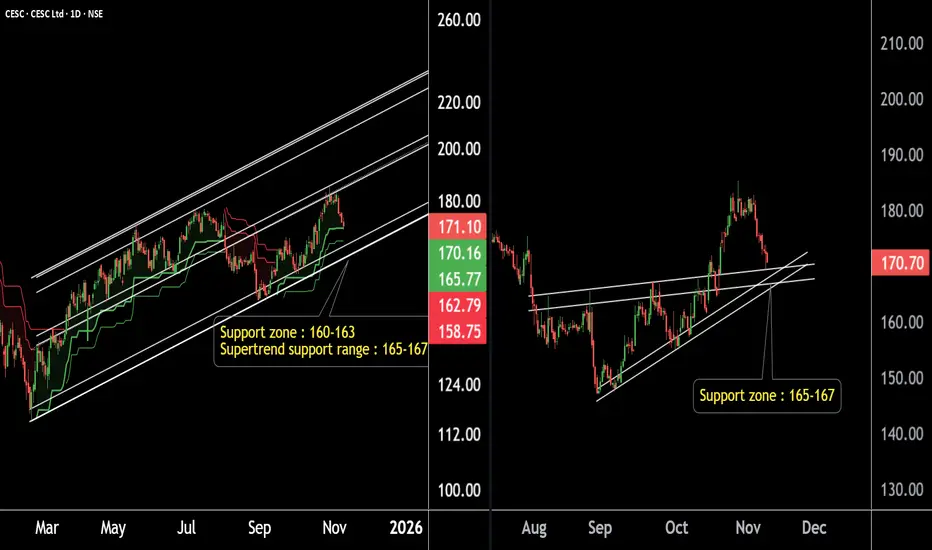
CESC Set to Ignite: Key Levels Triggering a Bull MoveThis is the daily and 4-hour timeframe chart of CESC.
The stock is moving within a well-defined parallel channel, with a support zone in the 160–163 range.
The Supertrend indicator is positive and suggests an additional support zone around 165–167.
CESC is forming a rising wedge pattern, and afte
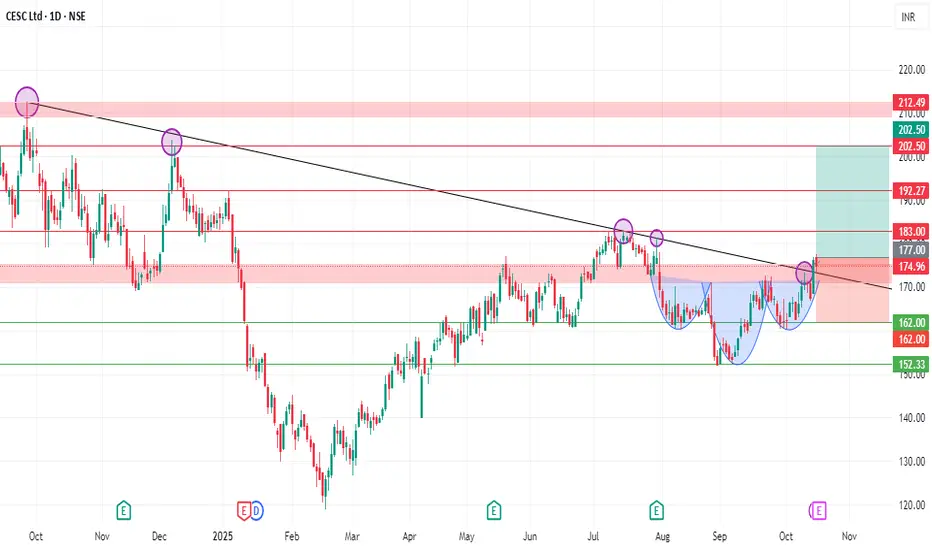
CESC Stock Looking Strong For Longterm REASON TO GO LONG:
Technically: This stock given a STRONG Trendline Breakout with STRONG Volume, Where the Trendline acts as a Resistance and rejected their many times, This stock consolidating since 3 months in a range and formed Head and Shoulder which gives more confirmation.
Fundamentally: Thi
CESC on Fire - Strong Momentum Building !CESC Daily Timeframe Analysis
CESC is sustaining above its Law of Polarity (LOP) after a breakout.
The stock has successfully retested the LOP and is showing strength.
This level also aligns with the Golden Ratio Zone of Fibonacci Retracement, representing a strong support zone around 159–162.
P
CESC on the Verge of Upside Momentum – Buy SuggestedCESC Breakout Update (4H Chart)
The stock has given a breakout on the 4-hour timeframe.
The short-term polarity zone, earlier acting as resistance, is now expected to act as support around 158–160 levels.
If the stock sustains above this zone, we may see further upside momentum.
Potential Target
Review and plan for 2nd July 2025 Nifty future and banknifty future analysis and intraday plan.
Swing idea.
This video is for information/education purpose only. you are 100% responsible for any actions you take by reading/viewing this post.
please consult your financial advisor before taking any action.
----Vinaykumar hiremat
See all ideas
Summarizing what the indicators are suggesting.
Neutral
SellBuy
Strong sellStrong buy
Strong sellSellNeutralBuyStrong buy
Neutral
SellBuy
Strong sellStrong buy
Strong sellSellNeutralBuyStrong buy
Neutral
SellBuy
Strong sellStrong buy
Strong sellSellNeutralBuyStrong buy
An aggregate view of professional's ratings.
Neutral
SellBuy
Strong sellStrong buy
Strong sellSellNeutralBuyStrong buy
Neutral
SellBuy
Strong sellStrong buy
Strong sellSellNeutralBuyStrong buy
Neutral
SellBuy
Strong sellStrong buy
Strong sellSellNeutralBuyStrong buy
Displays a symbol's price movements over previous years to identify recurring trends.
Frequently asked questions
The current price of CESC is 163.50 INR — it has increased by 0.25% in the past 24 hours. Watch CESC Ltd stock price performance more closely on the chart.
Depending on the exchange, the stock ticker may vary. For instance, on BSE exchange CESC Ltd stocks are traded under the ticker CESC.
CESC stock has fallen by −2.96% compared to the previous week, the month change is a −5.14% fall, over the last year CESC Ltd has showed a −9.14% decrease.
We've gathered analysts' opinions on CESC Ltd future price: according to them, CESC price has a max estimate of 244.00 INR and a min estimate of 172.00 INR. Watch CESC chart and read a more detailed CESC Ltd stock forecast: see what analysts think of CESC Ltd and suggest that you do with its stocks.
CESC reached its all-time high on Sep 26, 2024 with the price of 212.70 INR, and its all-time low was 5.50 INR and was reached on May 18, 2004. View more price dynamics on CESC chart.
See other stocks reaching their highest and lowest prices.
CESC stock is 1.30% volatile and has beta coefficient of 0.75. Track CESC Ltd stock price on the chart and check out the list of the most volatile stocks — is CESC Ltd there?
Today CESC Ltd has the market capitalization of 214.74 B, it has increased by 1.98% over the last week.
Yes, you can track CESC Ltd financials in yearly and quarterly reports right on TradingView.
CESC Ltd is going to release the next earnings report on Aug 12, 2026. Keep track of upcoming events with our Earnings Calendar.
CESC earnings for the last quarter are 3.30 INR per share, whereas the estimation was 2.90 INR resulting in a 13.79% surprise. The estimated earnings for the next quarter are 3.20 INR per share. See more details about CESC Ltd earnings.
CESC Ltd revenue for the last quarter amounts to 43.13 B INR, despite the estimated figure of 44.88 B INR. In the next quarter, revenue is expected to reach 55.16 B INR.
CESC net income for the last quarter is 4.39 B INR, while the quarter before that showed 2.85 B INR of net income which accounts for 0.00% change. Track more CESC Ltd financial stats to get the full picture.
Yes, CESC dividends are paid semi-annually. The last dividend per share was 6.00 INR. As of today, Dividend Yield (TTM)% is 3.70%. Tracking CESC Ltd dividends might help you take more informed decisions.
EBITDA measures a company's operating performance, its growth signifies an improvement in the efficiency of a company. CESC Ltd EBITDA is 34.47 B INR, and current EBITDA margin is 18.56%. See more stats in CESC Ltd financial statements.
Like other stocks, CESC shares are traded on stock exchanges, e.g. Nasdaq, Nyse, Euronext, and the easiest way to buy them is through an online stock broker. To do this, you need to open an account and follow a broker's procedures, then start trading. You can trade CESC Ltd stock right from TradingView charts — choose your broker and connect to your account.
Investing in stocks requires a comprehensive research: you should carefully study all the available data, e.g. company's financials, related news, and its technical analysis. So CESC Ltd technincal analysis shows the sell today, and its 1 week rating is sell. Since market conditions are prone to changes, it's worth looking a bit further into the future — according to the 1 month rating CESC Ltd stock shows the neutral signal. See more of CESC Ltd technicals for a more comprehensive analysis.
If you're still not sure, try looking for inspiration in our curated watchlists.