CROMPTON - TRENDLINE BREAKDOWN OR SHAKEOUT?CMP: 295
TF: Weekly
By breaking and sustaining below the trendline and the swing lows at 250 odd level, this script looked like to be in the downtrend.
But if you take a moment to observe the levels from which buyers pushed it up higher in the past, one can be confident that this script is head higher and the breakdown was just a shakeout.
On weekly TF, the 270-280 level was the trigger point for the buyer to take it past 450 and the price has sustained above 280 for about two weeks already.
A clos above 300 as well as the rising trendline would further confirm our view for this script to go past 450 in the coming weeks/months.
In simple price action, the chart is exhibiting HH-HL formation
Price is sustaining well above the cloud and 200 DEMA breakout retest also done.
From now on, dips to 270-280 levels is a buying opportunity with SL below 250 on DCB
Volumes are very convincing as well.. a potential stock to consider for the next 3 months or so.
Disclaimer: I am not a SEBI registered Analyst and this is not a trading advise. Views are personal and for educational purpose only. Please consult your Financial Advisor for any investment decisions. Please consider my views only to get a different perspective (FOR or AGAINST your views). Please don't trade FNO based on my views. If you like my analysis and learnt something from it, please give a BOOST. Feel free to express your thoughts and questions in the comments section.
Crompton Greaves Consumer Electricals Ltd.
No trades
No trades
In-depth trading ideas
CROMPTON
📈 **Stock Name: Crompton Greaves Consumer Electricals Limited**
💰 **Current Market Price:** **₹272.36** (recent close price)
### The chart is showing a strong **Uptrend Structure** with clear **Higher Highs** and **Higher Lows**. This means buyers are in control and trend is positive.
✅ **My View:**
Price may come for a **retest near ₹265 support zone** (Green Line). If buyers defend that level, fresh upside move possible.
🎯 **Targets:**
• First Target: ₹360
• Second Target: ₹480
🛑 **Stop Loss:**
Below **₹248 Red Swing Low** on **Daily Candle Closing Basis**.
⚡ **Trend Valid Till:**
As long as price stays above support and keeps making higher highs/higher lows.
⚠️ **Disclaimer**
This analysis is for educational and informational purposes only. It is not financial advice or a recommendation to buy or sell any stock.
Trading and investing in the stock market involve high risk, and you should always do your own research before taking any trade. The levels mentioned (Entry, Stop Loss, Target) are based on personal analysis and may not work as expected.
I am not responsible for any profit or loss.
Trade at your own risk and follow proper risk management.
Crompton Greaves Reclaims 50 DEMA1. Level Analysis
Current Price: 249.36
50 DEMA (Entry Trigger): The chart labels the 249.36 area as "50 DEMA (Entry Above)". Today's price action is sitting exactly on this trigger point.
20 DEMA (Support/SL): Marked at 246.36. This serves as the immediate "floor" for the current bullish move.
200 DEMA (Major Resistance): Sitting higher at 277.24. This is the ultimate "gravity" line that the stock is currently trading below, indicating a long-term bearish trend that hasn't been fully broken yet.
2. Trade Projection (Swing Setup)
This projection assumes a "Long" bias based on the recent recovery from the 224-230 support zone.
3. Projected Price Path
Phase 1 (The Breakout): If the price stays above 250 for the next session, expect a quick move toward the 260 handle as short-sellers cover their positions.
Phase 2 (The Test): Around 263.30, expect some consolidation. This was a previous rejection point in March.
Phase 3 (The Trend Shift): A successful breach of 265 would set the stage for a rally toward the 277 (200 DEMA). Reaching this level would officially shift the medium-term outlook from Bearish to Neutral-Positive.
Warning: If the stock fails to close above 250 and slips back below 241, the "V-shape" recovery will likely fail, and the stock may retest the 230 support level.
Solar Business Momentum
Crompton is gaining significant traction in the renewable space:
Market Share: The company has gained market share in the pump segment, specifically reporting 2x growth in solar pumps.
Order Book: It recently secured a major ₹52 crore solar rooftop order, marking a strategic entry into a large growing sector. 1
Catalyst,Impact on Stock,Status
Summer Demand High - IMD's forecast for a hot summer is a massive tailwind for fans and air coolers.
Diversification,Medium-High - Entry into wires and mobile accessories reduces reliance on seasonal fans.
Valuation,Positive, - "Trading at a discount compared to historical highs, attracting ""value"" buyers."
Disclaimer: aliceblueonline.com/legal-documentation/disclaimer/
at good support area Stocks at a good support area" refers to equities whose prices are trading near a level where historically,
buying interest has been strong enough to stop the price from falling further. This price level, or "support zone," is seen by technical analysts as a potential entry point for buying, with the expectation that the price is likely to bounce back up
CROMPTON: Breakout Toward ₹512 | Budget Boost Crompton Greaves Consumer Electricals is showing strong bullish intent as it gears up to challenge the ₹512 resistance level. The stock is perfectly positioned at the intersection of improving internal fundamentals and massive government policy support.
Fundamental & Policy Catalysts
1. Union Budget 2026 Impact: The sharp increase in the Electronics Components Manufacturing Scheme (ECMS) outlay to ₹40,000 crore significantly reduces input cost pressures for domestic giants.
2. Semiconductor & PCB Push: With the launch of Semiconductor Mission 2.0, Crompton stands to benefit from better supply chain localization for its premium smart-appliance range and IoT-enabled lighting.
3. Operational Strength: The company remains nearly debt-free with an impressive ROCE of ~20%, showcasing high capital efficiency as it expands into residential wires and solar businesses.
4. Margin Expansion: Local sourcing of PCBs and electronic components, supported by budget incentives, is expected to bolster EBITDA margins in the coming quarters.
Technical View
Target: ₹512+ (Previous High)
Support: ₹250 - ₹260 zone
Bias: Bullish on the back of volume-backed accumulation and sector tailwinds.
Summary: A combination of "Make in India" incentives for electronics and Crompton's premiumization strategy makes this a high-conviction breakout candidate.
Positional trading strategy in CROMPTONA bit lengthy video but don't miss the details here.
I have shared the aspects which makes this stock worth buying for. Missed the early entry but while analyzing for second entry I got another interesting setup.
Although this is a hypothetical technical analysis, but I will be doing thorough fundamental analysis too for any supporting or contrary views.
Crompton Greaves Consumer Durables Bullish View From Here ## **Crompton Greaves Consumer Durables Ltd – Company Profile**
**Crompton Greaves Consumer Durables Ltd** is a leading Indian consumer electricals company known for its wide range of home and lifestyle electrical products. The company focuses on delivering energy-efficient, reliable, and innovative solutions that enhance everyday living for consumers across India.
### **Company Overview**
Crompton is headquartered in **Mumbai, India** and has a strong presence throughout the country with a vast distribution and retail network. Over the years, it has built a trusted brand name through quality products, extensive after-sales service, and a reputation for customer satisfaction.
### **Product Portfolio**
The company offers a broad portfolio of consumer electrical products, including:
* **Electric Fans:** Ceiling, pedestal, table, and wall fans in various designs and technologies.
* **Lighting Solutions:** LED bulbs, LED tubes, and energy-efficient lighting fixtures.
* **Home Appliances:** Water heaters, air coolers, kitchen appliances, and pumps.
* **Electrical Consumer Products:** Switches, home electrical solutions, and related accessories.
This diversified product range caters to both residential and commercial needs, emphasizing durability, design, and energy efficiency.
### **Market Position**
Crompton is one of the **most recognized brands** in the Indian consumer electricals market, competing with other major players in fans, lighting, and small appliances. Its strong brand recall, coupled with a wide service network, helps maintain a significant share in its core categories.
### **Business Strengths**
* **Wide Distribution:** Extensive retail presence across urban and rural markets.
* **Brand Trust:** Longstanding reputation for product quality and reliability.
* **Innovation:** Continuous product enhancements and introduction of energy-efficient solutions.
* **Customer Support:** Robust after-sales and service infrastructure.
### **Strategic Focus**
The company continues to aim for growth by expanding its product portfolio, strengthening its reach in emerging segments, and enhancing digital and direct-to-consumer channels. Crompton’s focus remains on sustainable practices, consumer satisfaction, and long-term brand loyalty.
CROMPTON GREAVES – Liquidity Sweep Near Monthly POI | Swing TradMarket Structure Overview:
Crompton Greaves ne Sep 2021 me All-Time High 512 banaya tha. Uske baad stock ne lagbhag 50% correction diya aur recent low 247 ke paas aaya. Itna deep correction ke baad price ab important Monthly POI zone ke aas-paas behave kar raha hai.
🔍 What Price Is Telling Us
Monthly POI tap hone ke baad pehle ek up-move aaya
Uske baad market wapas same zone me aakar consolidate kar rahi hai
Is process me Monthly POI liquidity sweep bhi ho chuki hai
Ab price fir se liquidity sweep kar raha hai
Daily timeframe par equal lows / liquidity ko sweep karke new highs bana raha hai
👉 Ye clearly indicate karta hai ki buyers is price zone me interested hain
aur upward movement ki probability ban rahi hai.
🟢 Trade Plan (Small Risk – Swing Setup)
Entry Zone:
253 – 250
Stop Loss:
245
(Small SL, kyunki multiple liquidity sweeps ke baad rejection nahi mila)
🎯 Swing Targets
Target 1: 266
Target 2: 280
Target 3: 300
Target 4: 330
🧠 Trade Logic (Simple Words Me)
✔ Deep correction ke baad price value zone me hai
✔ Monthly + Daily liquidity sweep buyers ke presence ko show karta hai
✔ New highs on Daily TF = strength building
✔ Small SL ke saath risk-reward favorable hai
➡️ Isliye controlled risk ke saath swing trade possible hai.
📌 Important Note
300 ke baad agar price structure banata hai,
to naye entry opportunities mil sakti hain —
wo main next analysis me clearly share karunga.
📢 Don’t Miss Out!
✅ Follow me for regular market & swing trade analysis
👍 Like this idea if it added value
💬 Comment your view — let’s discuss
🚀📊 See you in the comments section!
⚠️ This analysis is for educational purposes only. Not a buy/sell recommendation.
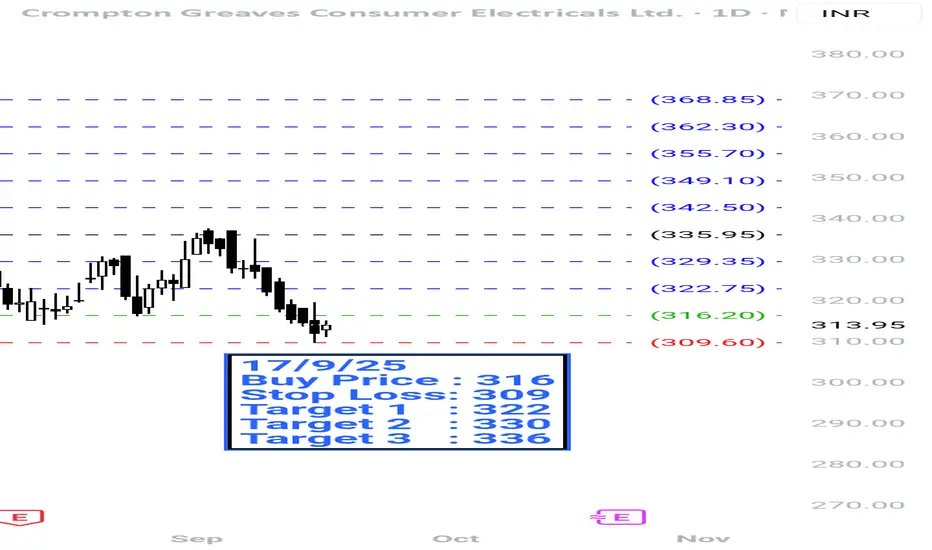
CROMPTON | Buy @LTP | SL below 245 | 1st Target 290Disclaimer (Please Read Carefully):
This is not investment advice. The stocks shared here are purely for educational and informational purposes. Please do your own research or consult with a financial advisor before making any investment decisions.
******************************************************************************************************************
Stock market में सिर्फ risk ही risk होता है। Market में survive करने का एक ही तरीका है, stop loss को पूरी discipline के साथ accept करना। अपनी capital को protect करने का इससे बेहतर कोई तरीका नहीं है।
मैं जो भी stock यहाँ शेयर करता हूँ, वो या तो मेरी existing holding में होता है, या फिर मैं उसी level पर fresh buying या add on करता हूँ जिसे मैं mention करता हूँ।
मैं हमेशा buy करते समय अपने system में stop loss ज़रूर लगा देता हूँ, और मेरे लिए stop loss, target से भी ज़्यादा important होता है।
Target achieve होने के बाद मैं पहले profit book करता हूँ और फिर retest या fresh breakout का इंतज़ार करता हूँ।
मैं सिर्फ breakouts पर buy करता हूँ, कभी भी support पर नहीं। और मैं resistance पर sell भी नहीं करता।
******************************************************************************************************************
The stock market involves risk, risk, and only risk. To survive in the market, accepting stop-loss with discipline and without hesitation. There is no other way to protect you capital.
Any stock I share is either already part of my existing holding or I take a fresh entry at the same level I mention. I always place the stop-loss in my system at the time of buying, and I give the highest importance to stop-loss more than the target. Once the target is achieved, I usually book profit once and then wait for either a retest or a fresh breakout.
I buy only on breakouts, never on supports. I also do not sell at resistance levels.
That is simply my trading style.
Crompton Swing Trade Setup📊 Price Action & Trend Analysis
Analyzing market trends using price action, key support/resistance levels, and candlestick patterns to identify high-probability trade setups.
Always follow the trend and manage risk wisely!
Price Action Analysis Interprets Market Movements Using Patterns And Trends On Price Charts.
👉👉👉Follow us for Live Market Views/Trades/Analysis/News Updates.
CROMPTON GREACES CONSUMER S/RSupport and Resistance Levels:
Support Levels: These are price points (green line/shade) where a downward trend may be halted due to a concentration of buying interest. Imagine them as a safety net where buyers step in, preventing further decline.
Resistance Levels: Conversely, resistance levels (red line/shade) are where upward trends might stall due to increased selling interest. They act like a ceiling where sellers come in to push prices down.
Breakouts:
Bullish Breakout: When the price moves above resistance, it often indicates strong buying interest and the potential for a continued uptrend. Traders may view this as a signal to buy or hold.
Bearish Breakout: When the price falls below support, it can signal strong selling interest and the potential for a continued downtrend. Traders might see this as a cue to sell or avoid buying.
20 EMA (Exponential Moving Average):
Above 20 EMA(50 EMA): If the stock price is above the 20 EMA, it suggests a potential uptrend or bullish momentum.
Below 20 EMA: If the stock price is below the 20 EMA, it indicates a potential downtrend or bearish momentum.
Trendline: A trendline is a straight line drawn on a chart to represent the general direction of a data point set.
Uptrend Line: Drawn by connecting the lows in an upward trend. Indicates that the price is moving higher over time. Acts as a support level, where prices tend to bounce upward.
Downtrend Line: Drawn by connecting the highs in a downward trend. Indicates that the price is moving lower over time. It acts as a resistance level, where prices tend to drop.
RSI: RSI readings greater than the 70 level are overbought territory, and RSI readings lower than the 30 level are considered oversold territory.
Combining RSI with Support and Resistance:
Support Level: This is a price level where a stock tends to find buying interest, preventing it from falling further. If RSI is showing an oversold condition (below 30) and the price is near or at a strong support level, it could be a good buy signal.
Resistance Level: This is a price level where a stock tends to find selling interest, preventing it from rising further. If RSI is showing an overbought condition (above 70) and the price is near or at a strong resistance level, it could be a signal to sell or short the asset.
Crompton intraday level for 22nd Aug #CROMPTON Crompton intraday level for 22nd Aug #CROMPTON
Buying may witness above 471
Support area 464. Below ignoring buying momentum for intraday
Selling may witness below 464
Resistance area 471
Above ignoring selling momentum for intraday
Charts for Educational purposes only.
Please follow strict stop loss and risk reward if you follow the level.
Thanks,
V Trade Point
50 SMA Rising - Swing TradingI am not a Sebi registered adviser.
This Idea is publish purely for educational purpose only before investing in any stocks please take advise from your financial adviser.
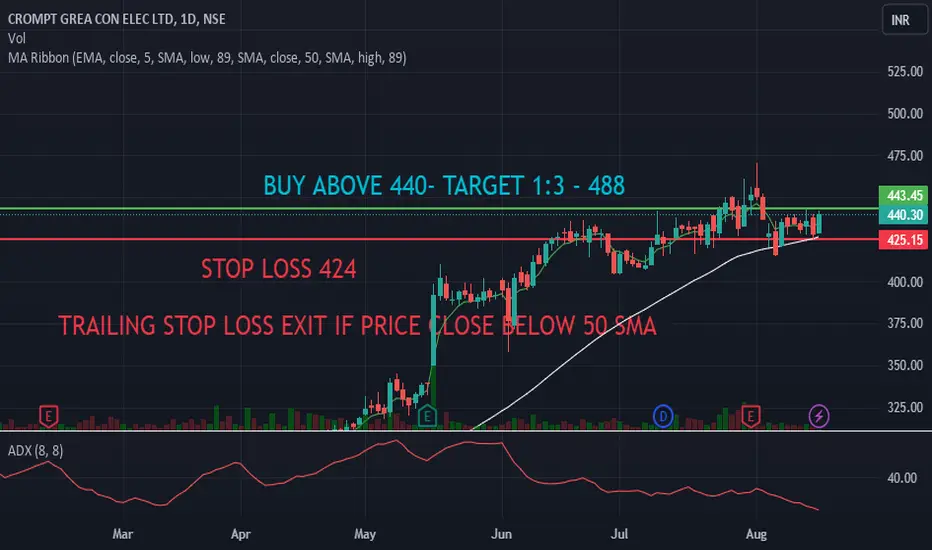
50 SMA Rising strategy. Suitable for Swing Trading Initial Stop loss lowest of last 2 candles and keep trailing with 50 days SMA if price close below 50 SMA then Exit or be in the trade for 2 to 4 weeks.
Do not Forget to Exit is Stop loss Hit.
Be Discipline because discipline is the Success in the STOCK Market.