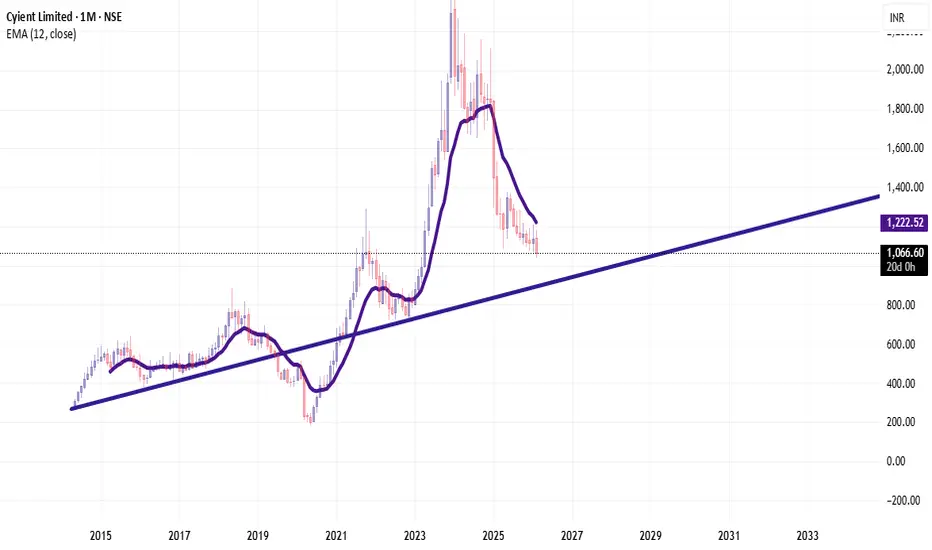
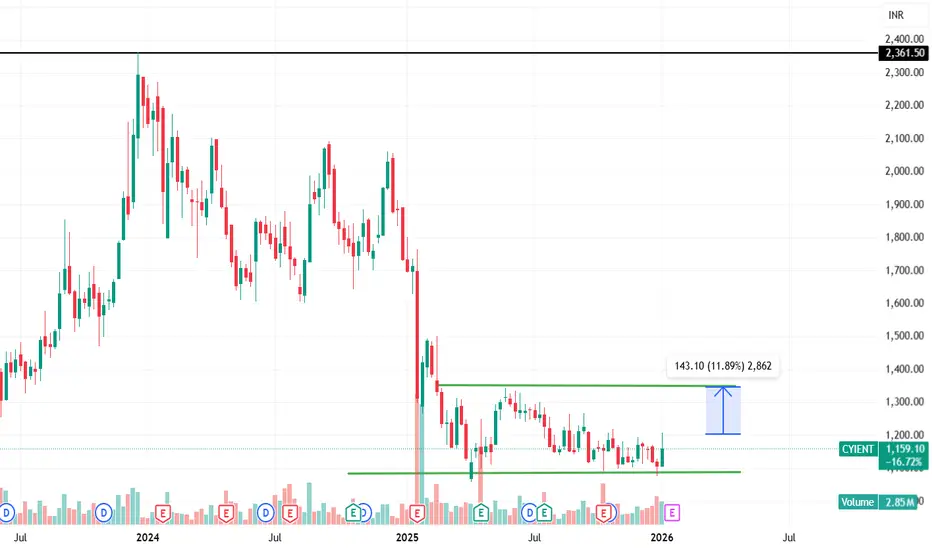
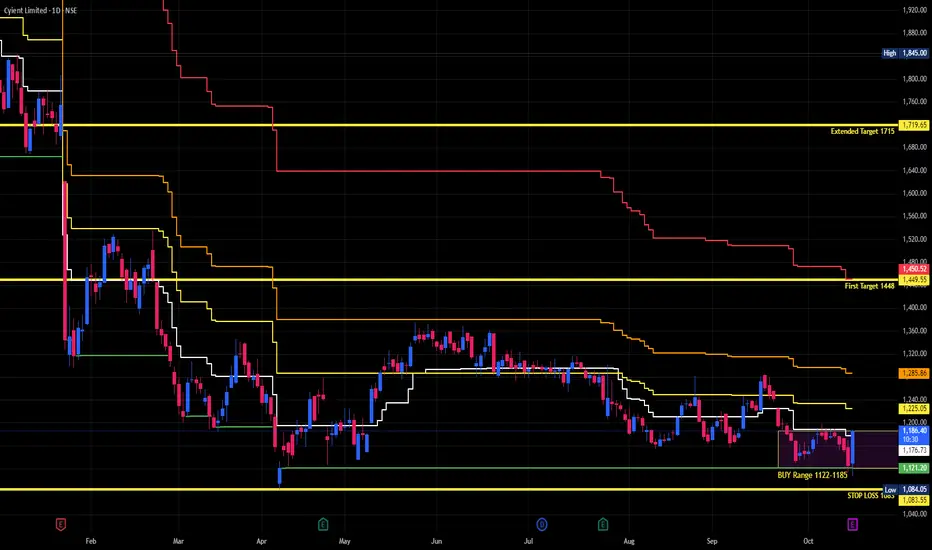
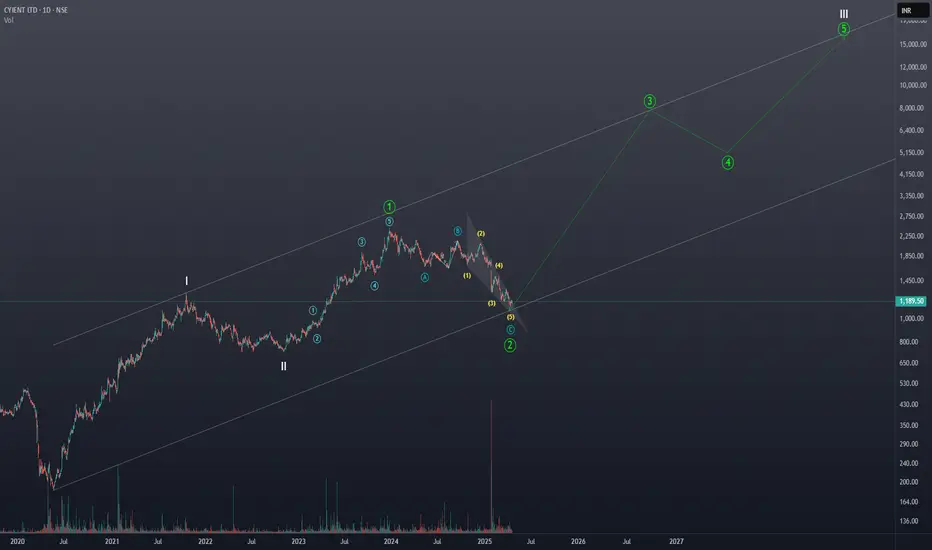
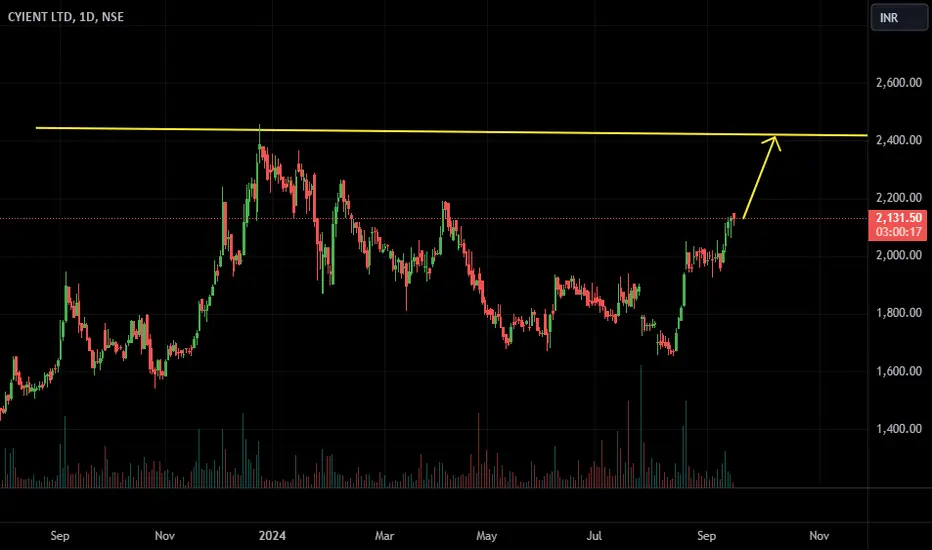
TREND REVERSAL IN CYIENT LTD-- EDUCATIONAL PURPOSECyient (formerly Infotech Enterprises Limited) is an Indian multinational technology company that is focused on engineering, manufacturing, data analytics, and networks and operations. Infotech Enterprises Ltd. was established in 1991 in Hyderabad.
Stock made high of 2287 in December 2023, after that it crashed and came down to 750.30 in Mar 2026 i.e.-68% correction in 2 years and 3 months. Then stock entered consolidation phase and now breakout is seen with higher high higher low formation thi
Cyient Limited
No trades
No trades
In-depth trading ideas
Bearish View Price Play With VWAP On Broad VWAP D/W/M/3Q/6M## **Cyient Limited – Company Profile**
*(Without Images and Hyperlinks)*
---
## **1. Company Overview**
Cyient Limited is an Indian **multinational engineering and technology solutions company** that provides services in engineering design, digital technology, manufacturing, data analytics, and network operations. The company helps global enterprises design, build, operate, and maintain products, plants, and networks.
Founded in 1991 and headquartered in Hyderabad, Cyient serves customers
Cyient Tech Ltd
## **Cyient Ltd — Brief Company Profile**
**Cyient Ltd** is a global engineering, digital, and technology solutions company headquartered in Hyderabad, India. Founded in 1991 (earlier known as Infotech Enterprises), Cyient partners with organizations to design, build, and operate complex products and systems across multiple industries.
### **Key Facts**
* **Founded:** 1991
* **Headquarters:** Hyderabad, Telangana, India
* **Listed:** NSE & BSE (India)
* **Global Workforce:** 15,000+ employee
Bearish View in Cyient price try reach below 850Here’s a clear overview of **Cyient**, a major Indian engineering and technology company:
---
## 🏢 **Company Overview: Cyient**
**Cyient** (formerly *Infotech Enterprises Ltd*) is a **global engineering and technology solutions company** headquartered in **Hyderabad, India**. It was founded in **1991** and rebranded as Cyient in **2014** to reflect its expanded focus on technology and engineering excellence. ( )
### 🌐 **What the Company Does**
Cyient specializes in delivering **“Intelligent
CYIENT - Rebound Possible from Key Support?Cyient is currently navigating a bearish trend, having underperformed the broader market over the past year. However, short-term indicators are showing some signs of life with a minor recovery (~6.6%) in the last week. We are approaching a critical decision zone.
CYIENT Swing Trade Setup📊 Price Action & Trend Analysis
Analyzing market trends using price action, key support/resistance levels, and candlestick patterns to identify high-probability trade setups.
Always follow the trend and manage risk wisely!
Price Action Analysis Interprets Market Movements Using Patterns And Trends On Price Charts.
👉👉👉Follow us for Live Market Views/Trades/Analysis/News Updates.
GANN SQ9+ INV H&S + FIBO The inverted head and shoulder pattern can be observed in the chart. It is a bullish reversal chart pattern indicating potential shift from downtrend to uptrend. The green horizontal line was the support that was broken with a gap and is the potential target for the bulls to reach. The Fibonacci retracement from 1807 to 1084.05 provide important levels for the bulls to watch for. The GANN Sq9 provide near term support and resistances .
Cyient 1DCyient is currently trading at ₹1,144. If the price sustains above the ₹1,200 level, there is a strong potential for it to rally towards the ₹1,600 mark.
Disclaimer: The information provided is for educational and informational purposes only and should not be considered as financial advice. Investing in the stock market involves risk, and past performance is not indicative of future results. Please consult with a certified financial advisor or conduct your own research before making any inves
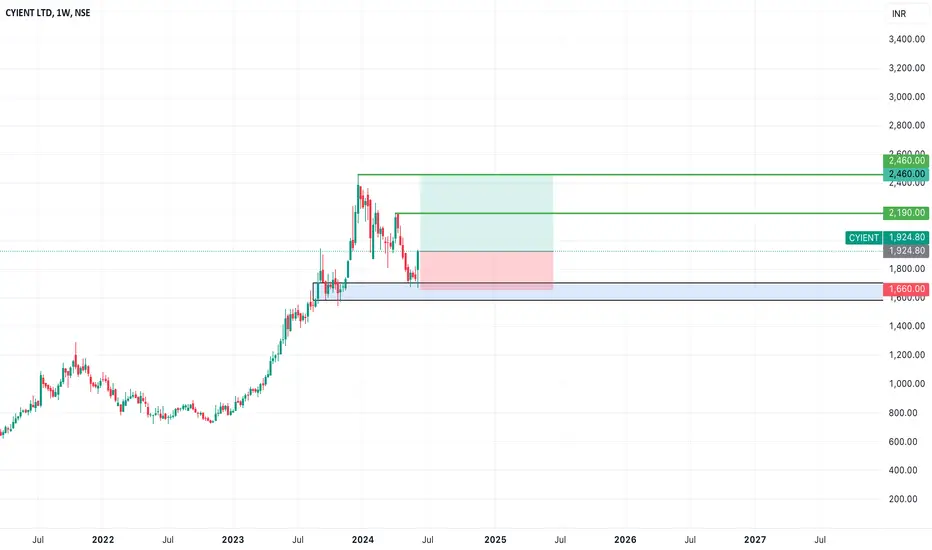
CYIENT Trade Setup Analysis: Risk-to-Reward and Key ZonesThis analysis outlines a trade setup observed on the chart based on technical price action and supply-demand dynamics. Please note, this is not investment advice but a learning perspective. Below is a detailed breakdown of the idea:
Demand Zone (DZ):
A key demand zone has been identified in the range of 1869.65 - 1879.90, indicating a strong area where buyers stepped in previously, causing a significant price rally. This zone serves as a potential support area, providing a base for further upw
CYIENTHi guys,
In this chart i Found a Demand Zone in CYIENT CHART for Positional entry,
Observed these Levels based on price action and Demand & Supply.
*Don't Take any trades based on this Picture.
... because this chart is for educational purpose only not for Buy or Sell Recommendation..
Thank you
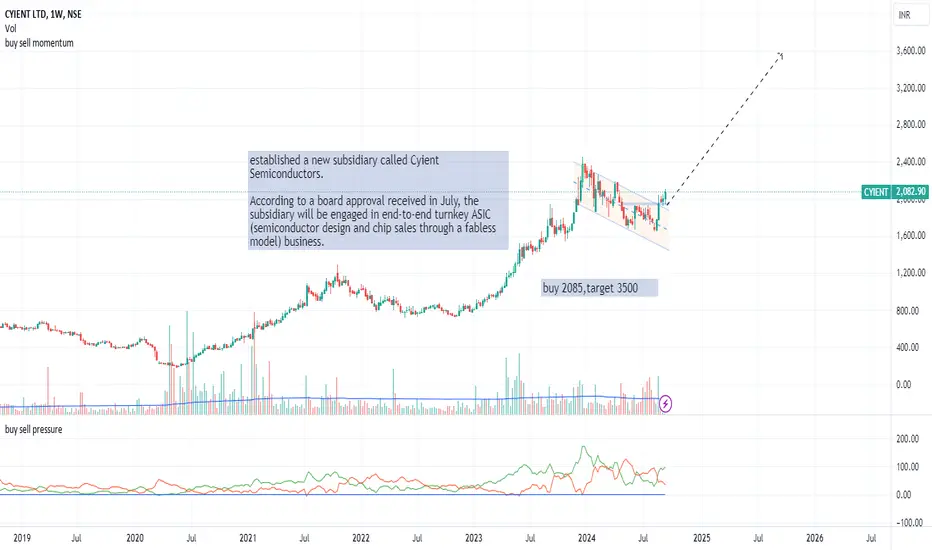
cyientestablished a new subsidiary called Cyient Semiconductors, according to a Friday filing to the Indian stock exchanges.
According to a board approval received in July, the subsidiary will be engaged in end-to-end turnkey ASIC (semiconductor design and chip sales through a fabless model) business.
SWING IDEA - CYIENT Cyient , a global engineering and technology solutions company, is displaying technical indicators that suggest a potential swing trading opportunity.
Reasons are listed below :
1700 Support Zone : The 1700 level has been established as a strong support zone, providing a solid base for potential upward movement.
Double Bottom Pattern : The formation of a double bottom pattern indicates a potential reversal from the downtrend, signaling a bullish outlook.
Bullish Hammer Candle on Weekly Tim