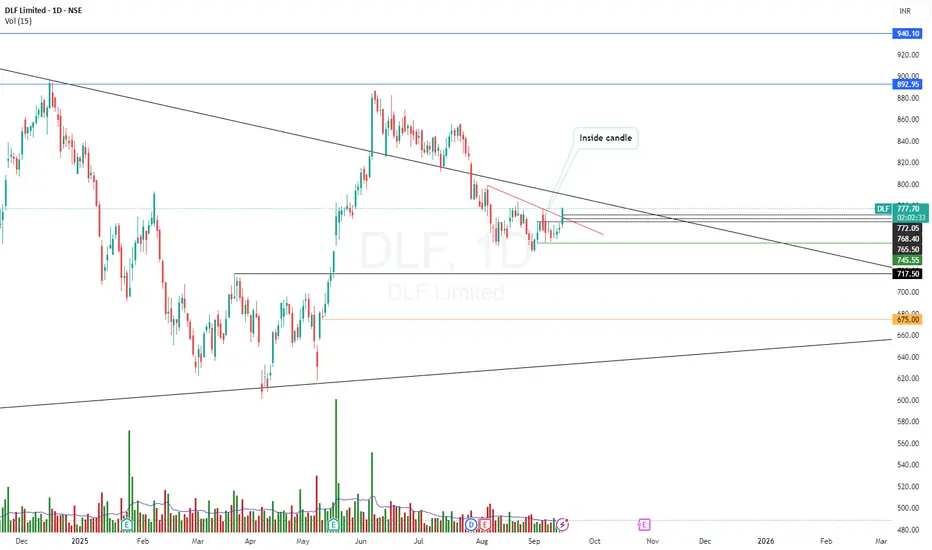
In-depth trading ideas
DLF (D)Technical Note: Let the market come to your zones and show its hand. Trade safely and manage your risk! Always wait for your own confirmations before entering the market.
Risk Disclaimer: This analysis is for educational purposes only and does not constitute financial advice. Always practice proper risk and position sizing. The market is supreme; no one can make a 100% accurate prediction. Stop Loss Must if you want to be a profitable Trader.
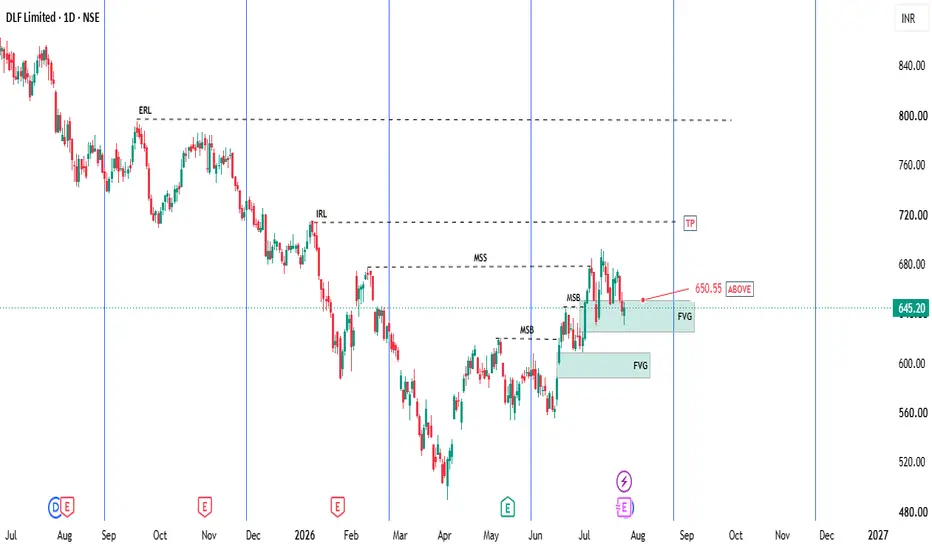
MARKET VIEW:-
Current Bias: BULLISH
Preferred Strategy: – BUY ON DIP .... Wait for Confirmation
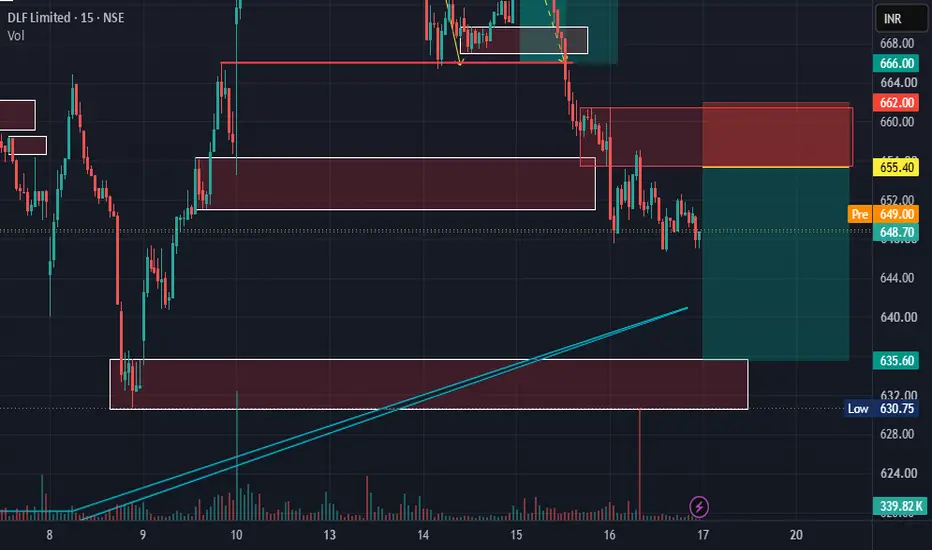
TEDS Swing Trading Analysis | DLF Sell SetupMany traders believe the job is done once a signal appears. In reality, a signal is only the starting point of disciplined trade planning.
The TEDS (Trend Exhaustion Detection System) is built to help traders move from observation → confirmation → execution, instead of reacting emotionally to market movements.
Chart Observation
🔹 Following a sustained bullish move, the framework first entered a Short Queue, encouraging patience while monitoring for a potential trend exhaustion.
🔹 Once the required confirmation conditions aligned, TEDS generated a Sell Signal and established a predefined Entry Zone.
🔹 Before planning the trade, the framework also identified the Stop Loss Area and the first Target Level (T-1), allowing traders to evaluate the complete risk-to-reward structure before execution.
The purpose of a trading framework is not to predict every market reversal.
Its purpose is to help traders answer the right questions before placing an order:
• Has the setup been fully confirmed?
• Is the entry based on predefined rules rather than market noise?
• Is the downside risk clearly defined?
• Do I have a complete trading plan before execution?
The market rewards consistency more than excitement. A disciplined process repeated over hundreds of trades is more valuable than chasing individual opportunities.
Trade with a Framework. Not with Emotions.
Disclaimer: This chart is shared for educational purposes only to explain a structured trading framework and market behaviour. It is not investment advice or a recommendation to buy or sell any security. Please conduct your own analysis and apply appropriate risk management before making any trading decisions.
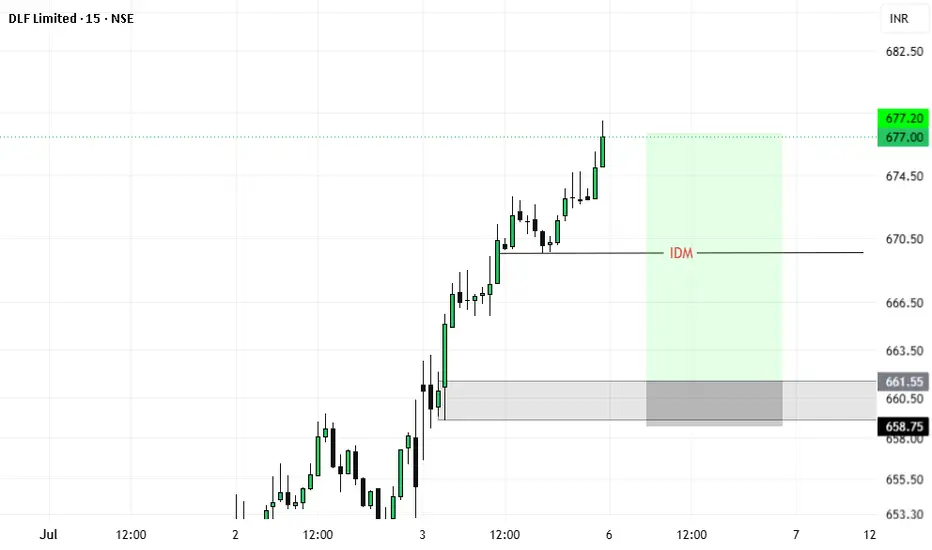
DLF: 1H High-Level Consolidation Holding Key 📊 DLF Limited (DLF) - 1-Hour (1H) Chart Analysis
This post is shared for EDUCATIONAL PURPOSES ONLY to observe structural price action consolidation, moving average alignment, and trend continuation behaviors. It is not financial or investment advice.
🎯 Educational Swing Setup:
• Entry Zone: 655.00 – 667.80 (Sizing into position blocks inside this structural consolidation base, or trailing entries near the dynamic hourly EMA cluster).
• Target 1: 700.00 (Immediate key psychological milestone and structural barrier)
• Target 2: 740.00+ (Extended macro swing continuation target zone)
• Invalidation / Stop-Loss: 630.00 (A definitive hourly close back below the pink long-term moving average baseline completely invalidates this bullish momentum thesis).
• Expected Duration: 5 to 12 Trading Days (Short-to-medium hourly swing view)
⚠️ Risk Management:
Since the price is trading within a corrective consolidation envelope, look for a fresh expansion spike in volume to confirm institutional continuation backing. Maintain disciplined position sizing at all times!
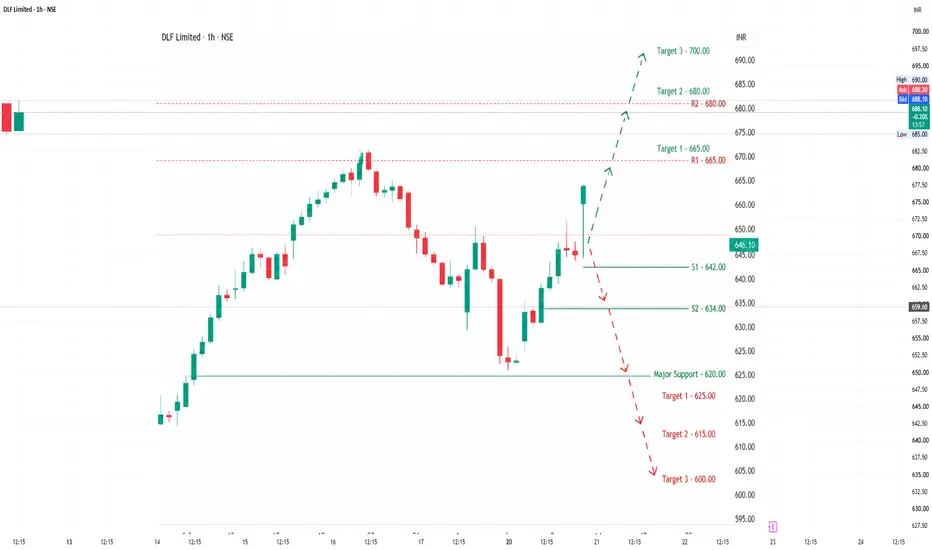
DLF Technical Analysis🟢 Key Support Zones
S1: ₹642–645
S2: ₹634–636 (strong demand zone)
Major Support: ₹620–625
🔴 Key Resistance Zones
R1: ₹665–670
R2: ₹680–690
Major Resistance: ₹700+
Trading Plan
✅ Bullish Scenario
Hold above ₹645
Breakout above ₹670
Upside targets:
🎯 ₹680
🎯 ₹690
🎯 ₹705
⚠️ Bearish Scenario
Breakdown below ₹634
Downside targets:
🎯 ₹625
🎯 ₹615
🎯 ₹600
Momentum View
Trend: Bullish to Neutral
Bias: Buy on dips near support rather than chasing at resistance.
Risk Management: A close below ₹634 would weaken the short-term structure.
NSE – NIFTY 750 | DLF Limited | Structural CensusDLF Limited shows a Regime Shift Structure on the long-term chart.
Following the strong expansion during its early listed years, the stock entered a prolonged corrective phase that lasted for more than a decade. During this period, price behaviour formed a broad structural base as the market gradually absorbed the earlier excesses.
Around the 2020–2021 period, price broke above the upper boundary of this long consolidation range. The breakout from the multi-year base signalled a structural transition and initiated a strong impulsive advance.
After this expansion phase, the stock is currently exhibiting higher-range consolidation, which is commonly observed after powerful structural advances as markets digest earlier gains.
This analysis is part of the ongoing NIFTY 750 Structural Census, a long-term study documenting structural behaviour across hundreds of Indian equities.
Disclaimer
This study focuses on long-term structural observation and is not intended as financial advice.
#NF750Census
#MarketStructure
#StructuralAnalysis
#DLF
#IndianStockMarket
DLF Strategy for next week Dlf in this stock formed negative pattern which is bearish engulfing pattern it is indicating the stock embraced by bearish grip in the short term so investors can accumulated short positions around 640 levels and keep stop at 670 on daily closing basis.
Sell price :640
Target price : 580
Stop loss : 670
Disclaimer :I am not a SEBI Reasearch Analyst please take an advise before take position based on my recommendation
Thanking you for your support if you liked my content suggest to your friends
DLF Forms Bullish 'W' Pattern | Strategy Levels Marked🎯 STRATEGY SNAP: CLASSIC 'W' BOTTOM PATTERN IN ACTION
CHART SETUP:
Stock: DLF (India)
Timeframe: Daily - Ideal for swing identification
Pattern: Bullish 'W' Formation (Double Bottom)
Key Feature: Right-side breakout above neckline
📊 STRATEGY EXECUTION PLAN:
ENTRY ZONE: ₹723 - ₹725
Optimal area for position initiation
Confirmation above pattern neckline
RISK MANAGEMENT:
Stop Loss: ₹715 (Below pattern support)
Risk Per Trade: ~1.4% from entry
Position Sizing: Standard 1-2% portfolio risk
PROFIT TARGETS:
Target 1: ₹740 (+2.1% return)
Target 2: ₹760 (+4.8% return)
Risk-Reward Ratio: 1:2.1 (Very favorable)
🎓 PATTERN EDUCATION - THE 'W' BOTTOM:
Why This Pattern Works:
Double Support Confirmation: Price tested ₹715 level twice and held
Neckline Break: Signal triggers above the W's peak
Volume Confirmation: Ideally should see increasing volume on breakout
Measured Move Projection: Pattern height suggests ₹760 target
Pattern Psychology:
First bottom: Sellers exhaust at support
Middle peak: Bulls attempt recovery
Second bottom: Final test of support confirms reversal
Breakout: Bulls take control above resistance
⚡ MY STRATEGY CRITERIA MET:
✅ Clear chart pattern identified
✅ Defined entry with confirmation
✅ Specific risk management levels
✅ Favorable risk-reward ratio
✅ Logical target projections
TRADE MANAGEMENT SUGGESTIONS:
Consider partial profit booking at Target 1
Trail stop loss to breakeven at Target 1
Let remaining position ride to Target 2
🔔 FOLLOW FOR MORE CHART PATTERN STRATEGIES!
#DLF #ChartPatterns #TechnicalAnalysis #StockMarket #SwingTrading #TradingStrategy #Investing
⚠️ DISCLAIMER: I am not a SEBI registered advisor. This is educational content demonstrating chart pattern analysis. Not a recommendation to buy/sell. Trade at your own risk. Past performance doesn't guarantee future results.
This educational approach positions you as a knowledgeable chart strategist rather than just a signal provider, which is exactly what TradingView Mind appreciates and promotes.
DLF - RISING WEDGE CHART PATTERN BREAKOUT [SELL SIDE]I am not a SEBI-registered investment advisor. The information provided here is for educational and informational purposes only and should not be construed as financial or investment advice. Please do your own research or consult with a SEBI-registered financial advisor before making any investment decisions. Investments in the securities market are subject to market risks. Read all the related documents carefully before investing.
dlfCurrent Technical Setup & Key Observations
200-DMA Breakout
Recently DLF closed above its 200-day moving average.
That generally signals a bullish bias in the medium-term, showing the trend may be shifting upward.
Inverse Head & Shoulders & Neckline Breakout
Earlier, DLF was reported to have broken out from an inverse head & shoulder pattern. Neckline breakout confirmed.
That sort of pattern can provide a “measured move” target calculated as height of pattern (distance from head to neckline) added to neckline level.
Candle Breakouts / Strong Candlestick Action
On shorter timeframes, there are signs of strong bullish candles and breakouts (i.e. candles closing above resistance levels, rejections of lower levels).
Also mention of patterns like bullish pennants / flags forming after upmove, indicating consolidation before continuation.
DLF is still struggling till today - {30/07/2025}2008 financial crisis it was so difficult for every corporate person in this living era,
Some companies have not yet recovered from the pre-2008 financial crisis level.
It is so hard to see them struggling,
I wish good luck to DLF company to make ALL TIME HIGH Soon,
Regards,
Happy Trading,
Stocks & Commodities Trade Analysis.