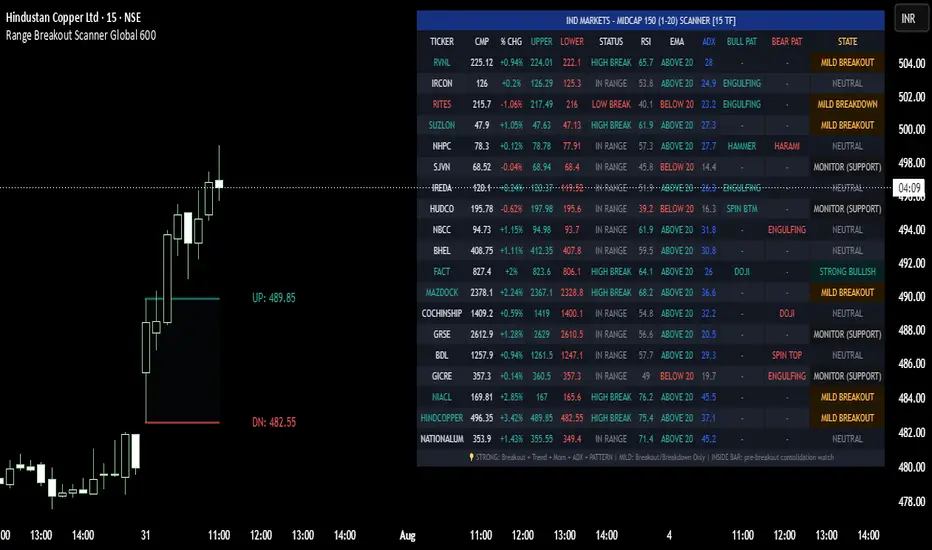
HOW-TO: Spot Range Breakouts Before They RunMost traders spot a breakout after it's already moved. Here's how to catch it at the trigger, using Hindustan Copper's 15-minute chart as today's live example.
Chart reference:
Step 1 — Define the Range
UP: 489.85 / DN: 482.55. Price consolidated in this band before making its move — mark the range
Hindustan Copper Ltd
No trades
No trades
Compare with Hindustan Copper Ltd
9.50 INR
9.19 B INR
30.78 B INR
327.27 M
Details
Sector
Industry
CEO
Anupam Misra
Website
Headquarters
Kolkata
Founded
1967
IPO date
Jan 8, 2010
ISIN
INE531E01026
FIGI
BBG000DFQN20
Identifiers
ISIN INE531E01026
Hindustan Copper Ltd. engages in the exploration, exploitation, and mining of copper and copper ore. Its products include cast copper rod, copper cathode, copper concentrate, copper sulphate, sulphuric acid, reverts, anode slime, and nickel cathode. The company was founded on November 9, 1967 and is headquartered in Kolkata, India.
#hindustancoppera Metal stock which is promising and demand for this stock will continue to rise in coming future.
Stock should break the recent lows and we wait for divergence. one can see it being 2x or more from there and complete wave5.
Keep accumulating and dont wait for bottom fishing.
Disc: Only for educati
HINDCOPPER Positive consolidation A positive price consolidation (often referred to as a "bullish" consolidation) occurs when a stock's price pauses and moves sideways within a tight range after a previous upward move. This represents a temporary equilibrium between buyers and sellers, showing that investors are holding strong rathe
Hindcopper retest done, near breakout zone🔹 Market Structure
Long-term chart shows a multi-year base formation (2013–2020)
Strong structural breakout and trend reversal post-2021
Current price action indicates continuation of long-term uptrend
🔹 Key Levels
🟣 Major Resistance: ₹580 – ₹600
Historical supply zone (visible from prior rejection
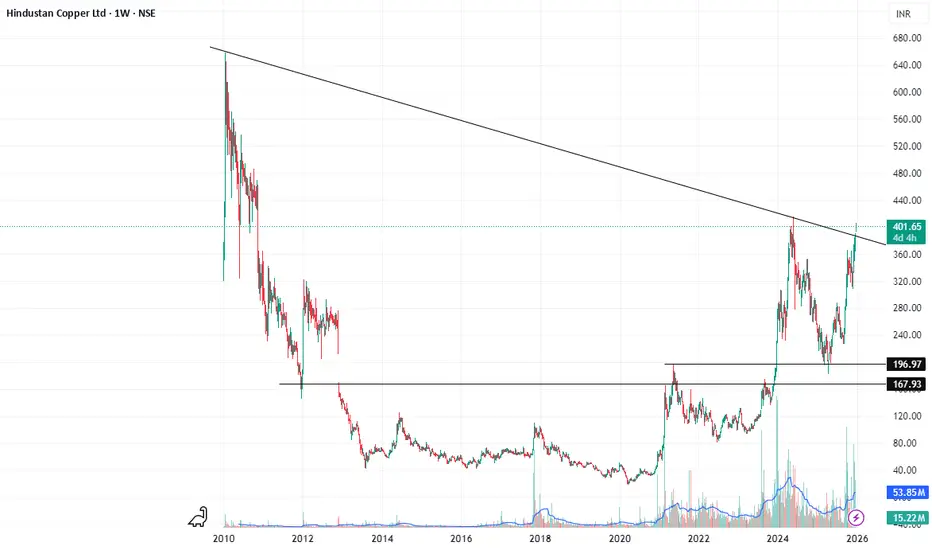
Hindustan Copper – 16‑Year Breakout Hindustan Copper – 16‑Year Breakout Candidate!
Setup: Monthly chart shows Hindustan Copper testing the 2010 high at ₹658 after 16 years.
Current Price: ₹575.95 (+19.91%).
Support Zone: ₹445–₹475 holding firm.
Upside Potential: Sustained breakout above ₹658 could open path toward ₹800+ in the medium
HINDCOPPER – Resuming Upside Momentum📲 HINDCOPPER – Resuming Upside Momentum
After a clean breakout and successful retest, HINDCOPPER has spent almost 2 months consolidating (lagging vs other metal stocks). That phase now looks complete, and the stock is again setting up for fresh upside momentum, with potential to move towards new hi
HINDCOPPER: Long-Term Structure Holding After Base ResolutionMulti-year base → impulsive expansion → structural digestion.
No breakdown. No reversal structure.
Higher-degree trend remains intact.
Structure > Sentiment.
#HINDCOPPER #ElliottWave #MarketStructure #IndianStocks #LongTermCharts #StructuralAnalysis #EWaves
Patience Pays Off: From Analysis to 65% Returns!I shared the initial breakout setup for Hindustan Copper back in September 2024. While the breakout didn't happen immediately, the thesis remained intact as the stock consolidated. Fast forward one year, and the patience has been rewarded with a massive +65.62% move.
See all ideas
Summarizing what the indicators are suggesting.
Neutral
SellBuy
Strong sellStrong buy
Strong sellSellNeutralBuyStrong buy
Neutral
SellBuy
Strong sellStrong buy
Strong sellSellNeutralBuyStrong buy
Neutral
SellBuy
Strong sellStrong buy
Strong sellSellNeutralBuyStrong buy
An aggregate view of professional's ratings.
Neutral
SellBuy
Strong sellStrong buy
Strong sellSellNeutralBuyStrong buy
Neutral
SellBuy
Strong sellStrong buy
Strong sellSellNeutralBuyStrong buy
Neutral
SellBuy
Strong sellStrong buy
Strong sellSellNeutralBuyStrong buy
Displays a symbol's price movements over previous years to identify recurring trends.
Frequently asked questions
The current price of HINDCOPPER is 491.85 INR — it has increased by 1.34% in the past 24 hours. Watch Hindustan Copper Ltd stock price performance more closely on the chart.
Depending on the exchange, the stock ticker may vary. For instance, on BSE exchange Hindustan Copper Ltd stocks are traded under the ticker HINDCOPPER.
HINDCOPPER stock has risen by 0.16% compared to the previous week, the month change is a −3.30% fall, over the last year Hindustan Copper Ltd has showed a 95.80% increase.
We've gathered analysts' opinions on Hindustan Copper Ltd future price: according to them, HINDCOPPER price has a max estimate of 715.00 INR and a min estimate of 715.00 INR. Watch HINDCOPPER chart and read a more detailed Hindustan Copper Ltd stock forecast: see what analysts think of Hindustan Copper Ltd and suggest that you do with its stocks.
HINDCOPPER reached its all-time high on Jan 29, 2026 with the price of 759.20 INR, and its all-time low was 18.30 INR and was reached on Mar 25, 2020. View more price dynamics on HINDCOPPER chart.
See other stocks reaching their highest and lowest prices.
HINDCOPPER stock is 3.83% volatile and has beta coefficient of 1.26. Track Hindustan Copper Ltd stock price on the chart and check out the list of the most volatile stocks — is Hindustan Copper Ltd there?
Today Hindustan Copper Ltd has the market capitalization of 464.75 B, it has decreased by −2.35% over the last week.
Yes, you can track Hindustan Copper Ltd financials in yearly and quarterly reports right on TradingView.
Hindustan Copper Ltd revenue for the last quarter amounts to 11.56 B INR, despite the estimated figure of 8.79 B INR. In the next quarter, revenue is expected to reach 8.55 B INR.
HINDCOPPER net income for the last quarter is 4.44 B INR, while the quarter before that showed 1.56 B INR of net income which accounts for 0.00% change. Track more Hindustan Copper Ltd financial stats to get the full picture.
EBITDA measures a company's operating performance, its growth signifies an improvement in the efficiency of a company. Hindustan Copper Ltd EBITDA is 13.66 B INR, and current EBITDA margin is 47.50%. See more stats in Hindustan Copper Ltd financial statements.
Like other stocks, HINDCOPPER shares are traded on stock exchanges, e.g. Nasdaq, Nyse, Euronext, and the easiest way to buy them is through an online stock broker. To do this, you need to open an account and follow a broker's procedures, then start trading. You can trade Hindustan Copper Ltd stock right from TradingView charts — choose your broker and connect to your account.
Investing in stocks requires a comprehensive research: you should carefully study all the available data, e.g. company's financials, related news, and its technical analysis. So Hindustan Copper Ltd technincal analysis shows the buy rating today, and its 1 week rating is neutral. Since market conditions are prone to changes, it's worth looking a bit further into the future — according to the 1 month rating Hindustan Copper Ltd stock shows the buy signal. See more of Hindustan Copper Ltd technicals for a more comprehensive analysis.