In-depth trading ideas
Hindustan Zinc Ltd. – Ascending Triangle DevelopingHindustan Zinc is showing signs of strength after finding support near the rising trendline of a developing Ascending Triangle. The stock has been making higher lows, while the broader descending resistance continues to cap the upside, bringing price closer to a decisive breakout point.
With volatility compressing and buyers defending higher levels, the setup is becoming increasingly attractive for a potential bullish expansion.
Trading Plan:
✅ Bullish on a sustained breakout above ₹560–₹565 with strong volume
🎯 Target Zone: ₹580–₹590
🛑 Immediate Support: ₹535–₹540
🛑 Major Structural Support: ₹485–₹490
As long as the rising support remains intact, the bulls retain the advantage. A decisive close above the descending trendline could trigger momentum buying and drive the stock toward the highlighted target zone.
Disclaimer: This analysis is shared solely for educational purposes and does not constitute investment advice. Please conduct your own research and practice proper risk management.
THE INDIAN INDESTRUCTIBLE: HINDUSTAN ZINC IS THE ULTIMATE MACRO WEAPON for second half of 2026 and beyond...
Hindustan Zinc #HINDZINC isn't just a mining stock; it is a global cash-printing machine disguised as a domestic industrial giant.
1. A Natural Global Duopoly / Monopoly Status.
Hindustan Zinc commands a staggering 75% to 77% market share of the primary zinc market in India.
Globally, it stands as the 2nd largest integrated zinc producer on Earth. You are not trading a speculative mid-cap; you are investing in a critical sovereign infrastructure provider that faces virtually zero domestic competition.
2. The Secret Weapon: The World’s 3rd Largest Silver Engine.
Most retail investors look at the name and think "industrial base metals." What they miss is that Hindustan Zinc is the 3rd largest silver producer globally, achieving a massive output of 627 tonnes in FY26.
With silver entering an aggressive global macro expansion—fuelled by both solar/electronics industrial demand and monetary hedging—Hindustan Zinc operates as a highly leveraged, hyper-profitable silver proxy.
3. Absurd, Institutional-Grade Capital Efficiency.
When you look under the hood at the corporate metrics, the profitability is nothing short of breathtaking: Return on Capital Employed (ROCE): A staggering 69.3%.
Return on Equity (ROE): 76.6%.
A mining business that prints near-80% ROE while digging physical wealth out of the earth is a statistical anomaly that outclasses almost every software business on the Nifty 50.
4. The Ultimate Cash-Flow Machine for Passive Compounding.
The company maintains a legendary dividend payout record (historical average of 84.8% of its earnings distributed back to shareholders).
In FY26 alone, it generated ₹40,844 crore in revenue and ₹13,832 crore in pure Profit After Tax (PAT).
This incredible cash generative power means you get paid heavily via distributions while waiting for structural technical targets to trigger.
5. The Aggressive AI-Led Operational Revolution.
Hindustan Zinc is currently executing a structural transformation by implementing an AI-driven industrial push across its mining complexes, targeting ₹2,000 crore in optimized financial gains. By introducing autonomous operations at assets like Rampura Agucha (India's first certified Eco-Zinc mine), they are permanently lowering production costs and widening their structural moat.
6. Insulated Green Energy.
InfrastructureIndustrial miners are typically vulnerable to soaring fossil-fuel input costs. Hindustan Zinc has brilliantly de-risked its operations by aggressively building out wind and solar delivery networks, aiming to source over 70% of its power requirements from renewable energy by 2027.
This has allowed them to launch EcoZen, Asia’s first low-carbon "green zinc" brand, commanding premium pricing in a decarbonising global supply chain.
7. Flawless Index & ESG Passive Inflow Tailwinds.
Institutional capital flows where the ESG scores are flawless.
Hindustan Zinc secured a spot in the Top 1% globally in the S&P Global Sustainability Yearbook 2026.
Following its official inclusion into the Nifty 100, Nifty Next 50, and all primary Nifty ESG indices, the stock is now subject to massive, systematic passive buying from international ETFs.
Stop looking across the ocean for world-class compounders. India has one right here.
Hindustan Zinc is the 2nd largest zinc producer and 3rd largest silver powerhouse on the planet, delivering a jaw-dropping 76% ROE.
Technically, the 'Hunt Volatility Funnel' on the weekly chart is running out of room.
The price is coiling into an unbreakable apex at ₹626.
A confirmed breakout above the ₹678 level opens the floodgates for an asymmetric structural move straight to LOG T2 (₹979) and LOG T3 (₹1,331).
Keep your eyes on the pattern failure level at ₹615.50; as long as that holds, the balance of probability points to an absolute monster leg higher in H2 2026.
@TheCryptoSniper #HuntvolatilityFunnel
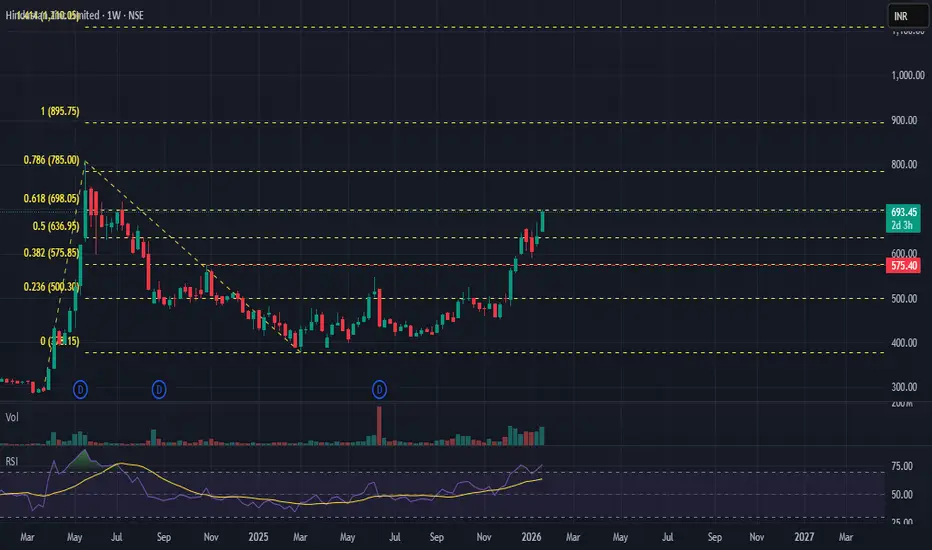
Hindustan Zinc – Rounding Bottom Breakout (Pre-emptive)Hindustan Zinc – Rounding Bottom Breakout (Pre-emptive)
Setup: Rounding bottom formation on higher timeframe
CMP: ₹690
SL: ₹570 (structure breakdown)
🎯 Targets (trail progressively)
T1: ₹737 T2: ₹807 T3: ₹895 T4: ₹1,110 T5: ₹1,236
Fibonacci confluence: Long-term Fibonacci extension 1.61 ≈ ₹1,211, aligning with T5 zone → strengthens the structural target.
🔗 Why this works
Silver linkage: Hindustan Zinc benefits from silver strength; the ongoing global silver run supports the upside bias.
Fundamentals: Quarterly results were strong, improving confidence to hold through volatility.
Structure: Rounding bottom indicates accumulation → expansion if the neckline sustains.
⚠️ Risk & Execution Notes (read carefully)
If global cues turn unstable and silver corrects, expect sharp volatility.
Do NOT go all-in. Use staggered buying near dips/confirmations.
Strict position sizing is critical; patience required to capture higher targets.
Trail SL once T1–T2 is achieved to protect capital.
⚠️ Clarification:
This is an independent analysis based purely on technical and market study. No part of Religare is involved in this view or recommendation.
📝 Important:
I am not responsible for any loss or profit incurred. I am not taking any fees for these views – just sharing my analysis for educational and informational purposes.
📉 Disclaimer: Not SEBI-registered. Please do your own research or consult a financial advisor before taking any investment decision.
HINDZINC -BullishChart Structure Analysis
Ignoring the drawn trend lines, the price action over the displayed period (June 2025 to January 2026) reveals several key bullish characteristics:
Higher Highs and Higher Lows: The price consistently forms higher peaks and higher troughs, which is the classic definition of an uptrend.
Rounding Bottom Pattern: The chart displays a large "rounding bottom" or "cup" formation, an accumulation pattern that typically precedes a strong upward movement. The stock recently broke above the neckline of this pattern around the ₹654–₹660 level, confirming the bullish signal.
Price Above Key Moving Averages: The stock price is trading well above its significant moving averages (like the 50-day and 200-day simple moving averages), further reinforcing the bullish sentiment.
Volume Confirmation: The recent rise in price has been accompanied by strong trading volume, which confirms high buying interest and adds strength to the upward move.
Expected Targets and Resistance
Based on technical analysis from various sources, several potential price targets can be expected if the bullish momentum continues:
Immediate/Near-Term Resistance: The stock just reached a fresh 52-week high of ₹733.00, which acts as an immediate resistance level.
Targets: ₹920.
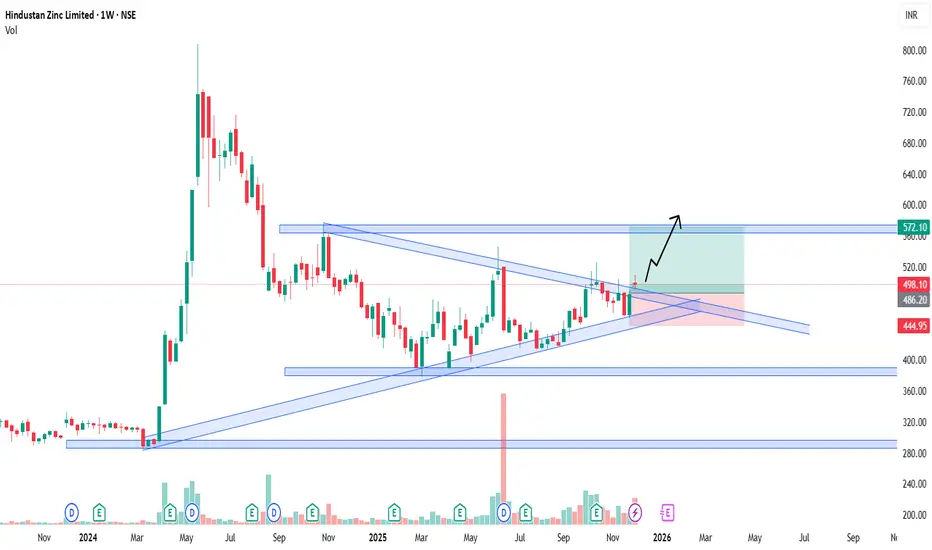
From Silver Shine to Zinc Strength: Hindustan Zinc’s Rally AheadBreakout: Stock has broken out of a descending triangle (bullish signal).
Current Price: ₹498.10
Target Zone: ₹572.10 (upside potential)
Stop-Loss: ₹444.95 (risk level)
Volume: Strong at 36.55M, confirming momentum.
Market Drivers
Silver Rally: Recent gains supported by rising silver prices.
Sector Strength: Outperformed metals sector and Sensex in early December.
Fundamentals
India’s only integrated zinc producer.
Strong reserves with >25 years mine life.
⚠️ Disclaimer
This is educational analysis only, not investment advice. Please consult a SEBI-registered advisor before trading.
Outside Bar Formation in HINDZINCTF: Daily
CMP: 615
One 29th Dec, price has formed an Outside bar completely engulfing the previous day's candle.
One can wait for the break of this candle to trade the range breakout targets.
The upside target is at 698 and the lower end target is 572
If you have a bullish bias on this counter, either wait for the breakout on the upside and enter, OR wait for the breakdown target (570-580 levels) to buy the dip.
For now, it is a wait and watch
Disclaimer: I am not a SEBI registered Analyst and this is not a trading advise. Views are personal and for educational purpose only. Please consult your Financial Advisor for any investment decisions. Please consider my views only to get a different perspective (FOR or AGAINST your views). Please don't trade FNO based on my views. If you like my analysis and learnt something from it, please give a BOOST. Feel free to express your thoughts and questions in the comments section.
HINDZINC – Swing Setup (Short-Term View)HINDZINC – Swing Setup (Short-Term View)
With silver showing strength and HINDZINC maintaining a higher-low structure, the stock is setting up for a momentum-based swing move.
📌 Swing Trade Plan
• CMP: ₹503
• Stop Loss: ₹449
• Swing Targets: ₹526 / ₹546
• Extended Targets: ₹575 / ₹663
• Risk per share: ₹54
📍 Swing Logic
• Higher-low + consolidation = coil-up structure
• Silver strength gives a clear sector tailwind
• Momentum expected towards 526–546 in the near term
• Use partial profit booking at first two targets
⚠️ Global markets remain volatile → Staggered buying preferred
⚠️ Clarification:
This is an independent analysis based purely on technical and market study. No part of Religare is involved in this view or recommendation.
📝 Important:
I am not responsible for any loss or profit incurred. I am not taking any fees for these views – just sharing my analysis for educational and informational purposes.
📉 Disclaimer: Not SEBI-registered. Please do your own research or consult a financial advisor before taking any investment decision.
HINDUSTAN ZINCHindustan Zinc Ltd., incorporated in the year 1966, is a Large Cap company (having a market cap of Rs 2,16,610.98 Crore) operating in Metals - Non Ferrous sector.
Hindustan Zinc Ltd. key Products/Revenue Segments include Scrap, Other Operating Revenue, Export Incentives and Wind Energy for the year ending 31-Mar-2025.
For the quarter ended 30-09-2025, the company has reported a Consolidated Total Income of Rs 8,787.00 Crore, up 9.16 % from last quarter Total Income of Rs 8,050.00 Crore and up 3.11 % from last year same quarter Total Income of Rs 8,522.00 Crore. Company has reported net profit after tax of Rs 2,649.00 Crore in latest quarter.
The company’s top management includes Ms.Priya Agarwal Hebbar, Mr.Arun Misra, Mr.Dinesh Mahur, Mr.Navin Agarwal, Mrs.Nirupama Kotru, Mr.Vivek Kumar Bajpai, Mr.Akhilesh Joshi, Mr.Kannan Ramamirtham, Ms.Pallavi Joshi Bakhru, Mr.Sandeep Modi, Mr.Kishore S, Mrs.Aashhima V Khanna. Company has S R Batliboi & Co. LLP as its auditors. As on 30-09-2025, the company has a total of 422.53 Crore shares outstanding.
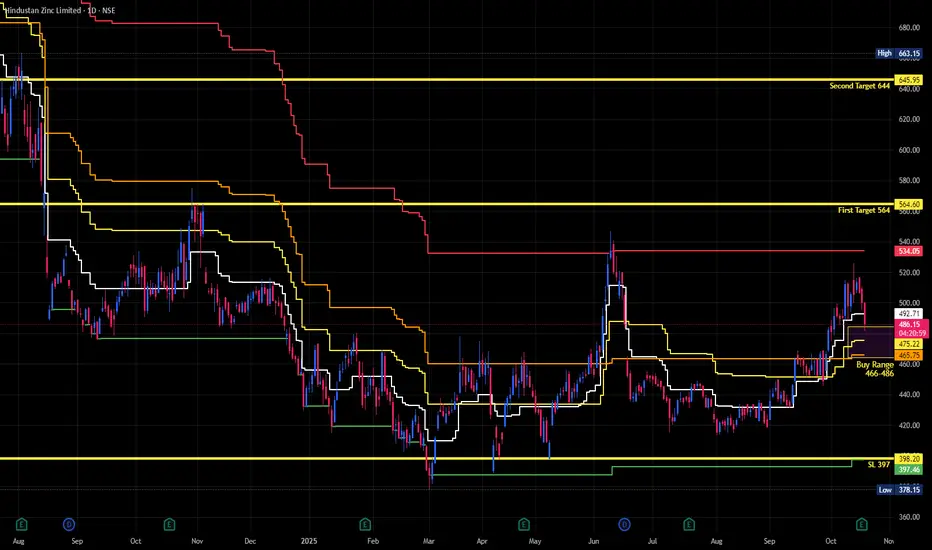
HINDZINC | Buy @LTP | SL below 480 | Targets 600, 750Disclaimer (Please Read Carefully):
This is not investment advice. The stocks shared here are purely for educational and informational purposes. Please do your own research or consult with a financial advisor before making any investment decisions.
******************************************************************************************************************
Stock market में सिर्फ risk ही risk होता है। Market में survive करने का एक ही तरीका है, stop loss को पूरी discipline के साथ accept करना। अपनी capital को protect करने का इससे बेहतर कोई तरीका नहीं है।
मैं जो भी stock यहाँ शेयर करता हूँ, वो या तो मेरी existing holding में होता है, या फिर मैं उसी level पर fresh buying या add on करता हूँ जिसे मैं mention करता हूँ।
मैं हमेशा buy करते समय अपने system में stop loss ज़रूर लगा देता हूँ, और मेरे लिए stop loss, target से भी ज़्यादा important होता है।
Target achieve होने के बाद मैं पहले profit book करता हूँ और फिर retest या fresh breakout का इंतज़ार करता हूँ।
मैं सिर्फ breakouts पर buy करता हूँ, कभी भी support पर नहीं। और मैं resistance पर sell भी नहीं करता।
******************************************************************************************************************
The stock market involves risk, risk, and only risk. To survive in the market, accepting stop-loss with discipline and without hesitation. There is no other way to protect you capital.
Any stock I share is either already part of my existing holding or I take a fresh entry at the same level I mention. I always place the stop-loss in my system at the time of buying, and I give the highest importance to stop-loss more than the target. Once the target is achieved, I usually book profit once and then wait for either a retest or a fresh breakout.
I buy only on breakouts, never on supports. I also do not sell at resistance levels.
That is simply my trading style.
HINDZINC a Closer Look 1. Hindustan Zinc stands tall as a global low-cost zinc producer with decades of reserves, making it a structural play in the commodities cycle.
2. The company’s FY25 results showed revenue up 18% and PAT up 33%, highlighting its ability to grow even in volatile markets.
3. With a PEG ratio under 1 based on recent earnings growth, valuations suggest significant headroom for long-term investors.
4. Management’s FY26 guidance and capacity expansion plans, including the new ₹12,000 crore metals complex, strengthen the growth visibility.
5. Silver production, where Hindustan Zinc is already a top global player, adds a powerful earnings kicker for future cycles.
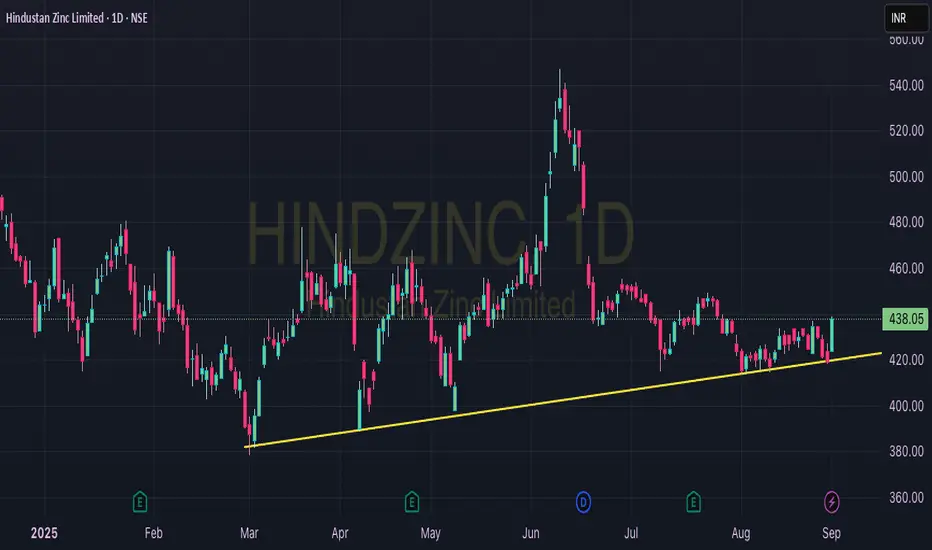
6. On the charts, the ascending trendline from March lows shows steady accumulation and strong buyer support.
7. A breakout above the ₹445 zone could propel the stock toward ₹465–478, aligning with fundamental fair-value bands.
8. Even dips to ₹385–400 would offer excellent accumulation opportunities, backed by robust balance sheet and dividend history.
9. This rare alignment of technical resilience and fundamental growth makes Hindustan Zinc a future fortune builder in the portfolio.
10. For patient, long-term investors, Hindustan Zinc offers a blend of cyclical opportunity and structural wealth creation.
Not an investment advise, Do you OWN Research
HINDUSTAN ZINC LTD at Best Support !!There are two charts of Hindustan Zinc — one on the 4-hour time frame, and the second on weekly time frame.
Chart 1 (4-Hour Timeframe):
The stock is moving in a Higher High, Higher Low (HH-HL) structure, indicating a bullish trend.
Support zone is observed near the 400–410 range.
Chart 2 (Weekly Timeframe):
On the weekly chart:
the stock is approaching a major support zone in the range of ₹375 – ₹390, which has historically held strong.
If this level is sustain then we may see higher prices in HINDZINC.
Thank You !!
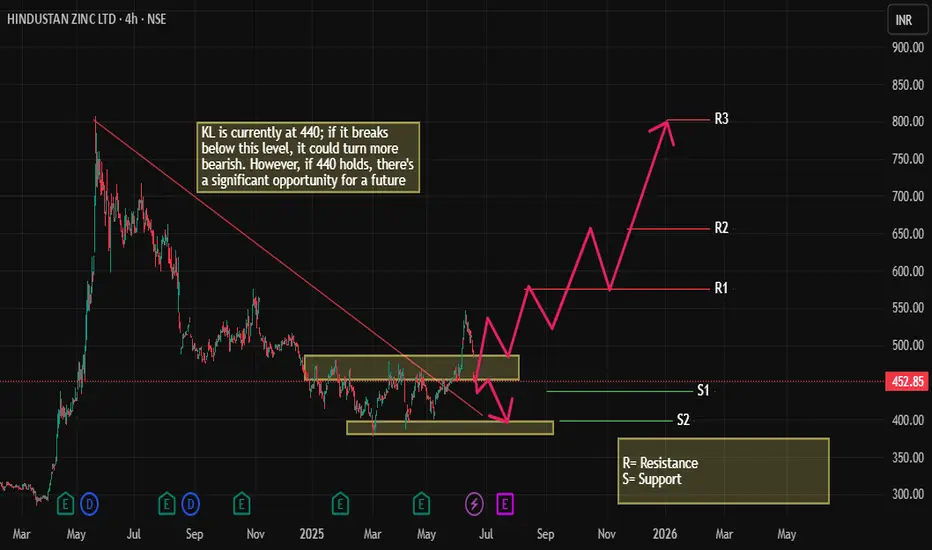
Trade setup HINDZINCHINDZINC Is approaching a key support level at 440. This level is critical for determining the stock's next move. A breakdown below 440 could signal increased bearish momentum, potentially leading to further downside. On the other hand, if the 440 level holds strong and shows signs of support, it could mark the beginning of a bullish reversal. In that case, there's a significant upside potential, with a possible long-term target around 655. For now, it's important to stay patient and wait for a clear signal—either a breakdown or a bounce from the current level—before making any trading decisions.
HINDZINC- Talk of the Town.🔍 Analysis:
Cup Formation:
The rounding bottom or "cup" pattern suggests accumulation and a potential reversal.
The breakout above the cup’s lip (~₹475) is confirmed with volume.
Price has tested the ₹575 zone but faced resistance.
Volume Analysis:
Noticeable volume spike during the upward breakout phase confirms buying interest.
Sustained volume will be essential for a move towards ATH (All-Time High).
RSI Indicator:
RSI at 68.53 indicates strong momentum.
RSI-based MA at 73 shows it's nearing overbought territory. A minor pullback/consolidation is possible.
Trendlines:
Downward sloping trendline (dotted) was broken convincingly—bullish signal.
Parabolic arc trajectory towards ATH (~₹807) has been drawn to project potential.
ATH Potential:
"IT CAN REACH ATH VERY SOON" is speculative but supported technically if it sustains above ₹575 and breaks it with volume.