HONEYWELL AUTOMATIONHoneywell Automation India Ltd. (CMP ₹39,015.00, NSE: HONAUT)
Prepared by Sucrit Patil | The SmartWay Research Desk | 25 June 2026
A Pune‑based automation and technology company, incorporated in 1984. Honeywell Automation India operates across industrial automation, building technologies, process solutions, and software‑driven IoT platforms, serving manufacturing, energy, infrastructure, and smart city projects.
Promoter Holding (Mar 2026): Honeywell Asia Pacific — 75.00% stake (no pledges)
FY22–FY26 Snapshot
Revenue Growth: FY26 revenue ₹5,842 Cr vs ₹5,112 Cr in FY25 (+14.2% YoY). → Good
Net Profit: FY26 PAT ₹812 Cr vs ₹712 Cr in FY25 (+14.0% YoY). → Good
Operating Margin: FY26 EBITDA ₹1,312 Cr, margin 22.4% vs 21.6% last year (+80 bps). → Good
Equity Capital: Stable, face value ₹10. → Good
Dividend Policy: Dividend ₹95.00/share declared for FY26. → Good
Asset Building: Investments in IoT, AI‑driven automation, and smart building solutions. → Good
Sales: Strong demand from industrial automation and smart city projects. → Good
Expense: R&D spend ~9% of revenue; manageable. → Good
EPS: FY26 EPS ₹820.25 vs ₹720.10 last year (+13.9%). → Good
Institutional Interest & Ownership Trends (Mar 2026)
Promoter Holding: 75.00% (no pledges)
FII Holding: 8.12%
DII Holding: 10.34%
Retail & Others: 6.54%
Strategic Moves & Innovations
Expansion in IoT‑enabled automation and AI platforms.
Focus on energy efficiency and smart building technologies.
Partnerships with government smart city initiatives.
Diversification into digital twin and predictive analytics solutions.
Cash Flow & Balance Sheet Strength
Market cap ~₹43,800 Cr.
Debt‑to‑equity ratio ~0.10 (low leverage).
Book value per share ₹1,215.00; P/B ~32.1.
EPS (TTM) ₹820.25; P/E ~47.6.
Risk Factors
High P/E ratio ~47.6, indicating premium valuations.
Dependence on industrial and infrastructure capex cycles.
Exposure to global technology competition.
Competition from ABB India, Siemens India, and Schneider Electric.
Investor Takeaway
Honeywell Automation India has delivered robust FY26 performance, supported by automation, IoT, and smart city demand. With strong promoter backing, dividend payouts, and leadership in industrial technology, Honeywell remains a premium play on India’s automation and smart infrastructure growth story. At CMP ₹39,015.00, valuations are expensive (P/E ~47.6, P/B ~32.1), reflecting high growth expectations but also significant risk.
Honeywell Automation India Limited
No trades
No trades
In-depth trading ideas
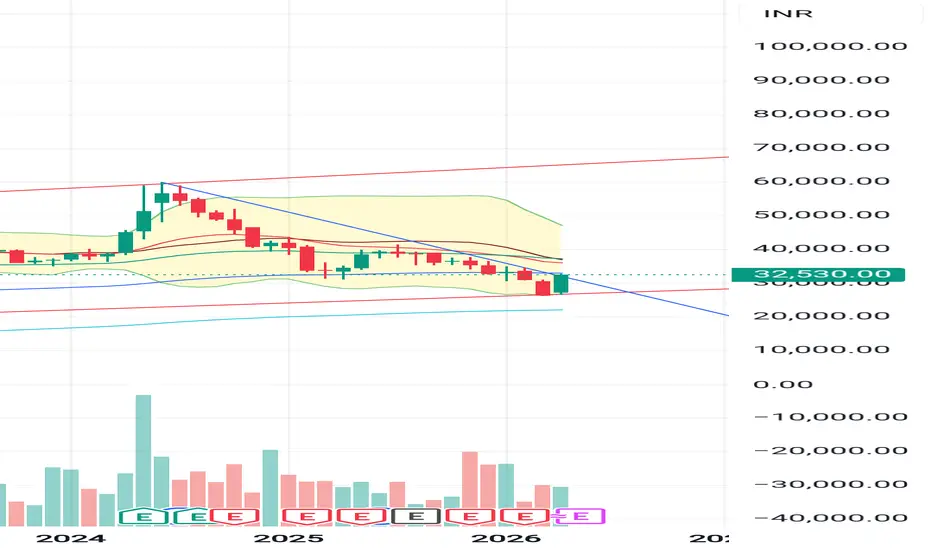
HONEYWELL AUTOMATION IND S/RSupport and Resistance Levels:
Support Levels: These are price points (green line/shade) where a downward trend may be halted due to a concentration of buying interest. Imagine them as a safety net where buyers step in, preventing further decline.
Resistance Levels: Conversely, resistance levels (red line/shade) are where upward trends might stall due to increased selling interest. They act like a ceiling where sellers come in to push prices down.
Breakouts:
Bullish Breakout: When the price moves above resistance, it often indicates strong buying interest and the potential for a continued uptrend. Traders may view this as a signal to buy or hold.
Bearish Breakout: When the price falls below support, it can signal strong selling interest and the potential for a continued downtrend. Traders might see this as a cue to sell or avoid buying.
20 EMA (Exponential Moving Average):
Above 20 EMA(50 EMA): If the stock price is above the 20 EMA, it suggests a potential uptrend or bullish momentum.
Below 20 EMA: If the stock price is below the 20 EMA, it indicates a potential downtrend or bearish momentum.
Trendline: A trendline is a straight line drawn on a chart to represent the general direction of a data point set.
Uptrend Line: Drawn by connecting the lows in an upward trend. Indicates that the price is moving higher over time. Acts as a support level, where prices tend to bounce upward.
Downtrend Line: Drawn by connecting the highs in a downward trend. Indicates that the price is moving lower over time. It acts as a resistance level, where prices tend to drop.
Disclaimer:
I am not a SEBI registered. The information provided here is for learning purposes only and should not be interpreted as financial advice. Consider the broader market context and consult with a qualified financial advisor before making investment decisions.
HONAUT NSEHoneywell Automation after a 3Year Bearish Trend has Broken Out with a Bang and now corrected to its pervious all time High. The stock has currently retraced to the the 50% FIB level for its last Impulse on the WTF.
Stock is trading close to 200EMA and below 50EMA following is and early entry recommendation with 25% quantity and add progressively up to 52K WTF close
ENTY above 50400 WTF close. SL at 48600 WTF Close and Target 60000..
HONEYWELL - Flat Q2 results
🔻The chart is self-explanatory as always.
Here are some pointers for easy understanding.
🔻 Current price at ₹45,490 is near 100 WEMA, acting as a potential strong support
🔻 The recent 7.85% drop is linked to weaker Q2 2024 results, with a decline in sales, EBITDA, net profit, and EPS.
🔻 You can now access all our structured charts for all Nifty 500 companies. Check the signature column below for more info.
🔻 Price has fallen below the previous ATH of ₹50,000, making it a potential resistance on bounce back.
🔻 Price is testing the previous consolidation zone extreme after breaking out; it may serve as new support.
Disclaimer: This analysis is for educational purposes only and should not be considered as financial advice. All investments carry risk, and it’s important to conduct your own research or consult with a certified financial advisor before making any investment decisions. I do not provide buy, sell, or hold recommendations. Past performance is not indicative of future results.
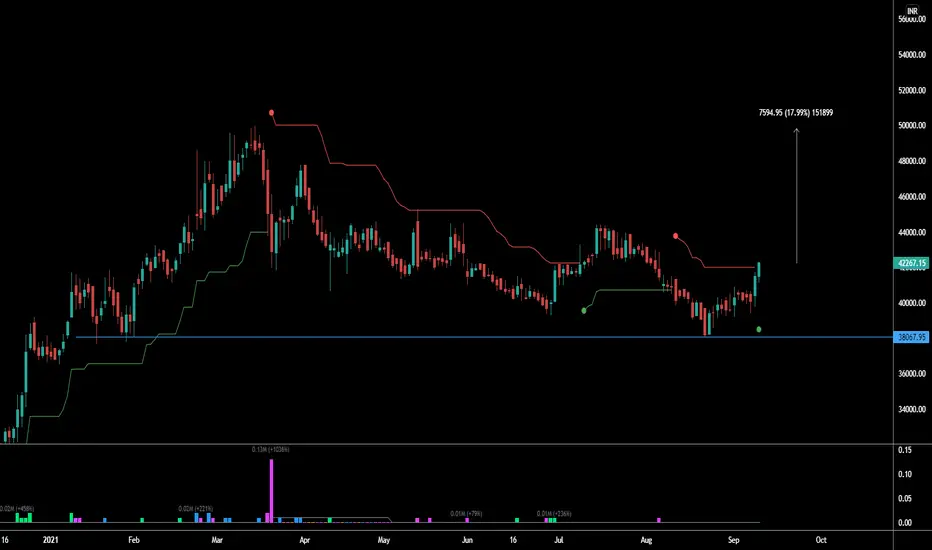
Honeywell: Honey's Well or Unwell? - If you are a layman with some knowledge of charts and price action, This chart looks good, Doesn't it?
- It finally broke the trendline starting in March 2021. Breaking a 2-Year Trendline
- With Bulls charging the markets, everything looks lucrative. Now that investors are getting greedy, Caution is advised.
- If you look closely, The price is taking resistance at a crucial resistance zone. See the long wicks on all the prior tests of this zone?
- Say the price breaks and sustains over it, we have another resistance waiting at a mere 5% up move.
- Will it be able to break both resistances in one go? Maybe, Maybe Not.
- Is it wise to enter now and hope that it does? Or should we wait for both resistances to be taken out and let the price sustain over it?
- I would go with the latter.
- Don't get me wrong. I like this company. I just don't like the price action at this point.
What are your thoughts? Feel free to comment. If it helped, Do Leave us a boost 🚀
Disclaimer: We are not registered advisors. The views expressed here are solely personal opinions. Irrespective of the language used, Nothing mentioned here should be considered as advice or recommendation. Please consult with your financial advisors before making any investment decisions. We like everybody else, have the right to be wrong :)
NEXT MRF - HONEYWELL AUTO ( HONAUT ) Multiple study like flag and trend line from upper price that share price is running on 38800
CHART PATTERNS HOLD
1. Trend line on monthly
2. Multiple cup & handle
3. Ready to cross us supply zone
4 Range breakout
2 Slide flag pattern brekaout
BUY honey well auto above 39000
TRG 1 - 44000
TRG 2 - 48000
TRG 3- 52000
and above 52000 that convert in jackpot trade if that not split
TRG 64000 --- 72000 ----- 88000 if everything will be going in good that share
Review and plan for 17th May 2024Nifty future and banknifty future analysis and intraday plan in kannada.
This video is for information/education purpose only. you are 100% responsible for any actions you take by reading/viewing this post.
please consult your financial advisor before taking any action.
----Vinaykumar hiremath, CMT
Triangle pattern on HONAUTHONAUT formed a triangle patter on weekly chart. This pattern has been forming for the last two years. It appears breakout has happened on it today. Though the volume was relatively low compared to previous trading session. There was strong bullishness with Marubozu candle formation today. Multiple support and resistance were tested with recent runup in price that broke out of resistance. Entry can be held just above today's high with stop loss below previous trading session candle as shown on the chart.
Hope you liked this idea. If you do, please boost the idea or leave a comment below. I'll be glad to have a chat. Otherwise happy trading :-).
BUY HONAUT PRICE @35997 ROI 30% EXPECTEDBUY HONAUT PRICE @35997 ROI 30% EXPECTED
Buy1 cmp entry @35997
Target 1 @47223
ROI 1 @ 30%
Buy2 Pending entry @ 22649
Target 2 @47223
ROI 2 @ 107%
Our Unique Features
—————————————————————
1. Follow our 10 signals ….10% equity will increase in your account for sure.
2. We are not Trailing stop! or average the trades.
3. 1% Risk Management Per trade.
4. Risk vs Reward up to 25.
Note Please leave comments for any query.
Disclaimer This is my trading experience, it is not an invite or recommendation to trade.
Best Wishes
PRABHUMAYAKANNAN
Honeywell Automation BreakoutThe stock has broken out and retested; therefore may undergo a reversal rally. Trade is supported by brokerage calls and Supports Nearby.
Risk Reward Ratio - 2:1
SL is placed below support zone and the upper & lower trendline. The target is placed based on fundamentals and near swing high.