INDIGO | THE BTF DAILY BLOCK IS STILL DEVELOPING 🧭
#Crude #oil has suffered a sharp selloff, and airline stocks are attracting renewed attention as the market reassesses the outlook for fuel costs.
But the more interesting story may be unfolding on the chart.
**IndiGo's BTF Daily Trend has transitioned from bearish to bullish**, with successive green daily blocks illustrating the recovery.
Despite the recent sharp advance, price remains within the developing bullish Daily BTF block, while the 18-day SMA near ₹4,790 provides a broader dire
InterGlobe Aviation Ltd
No trades
No trades
In-depth trading ideas
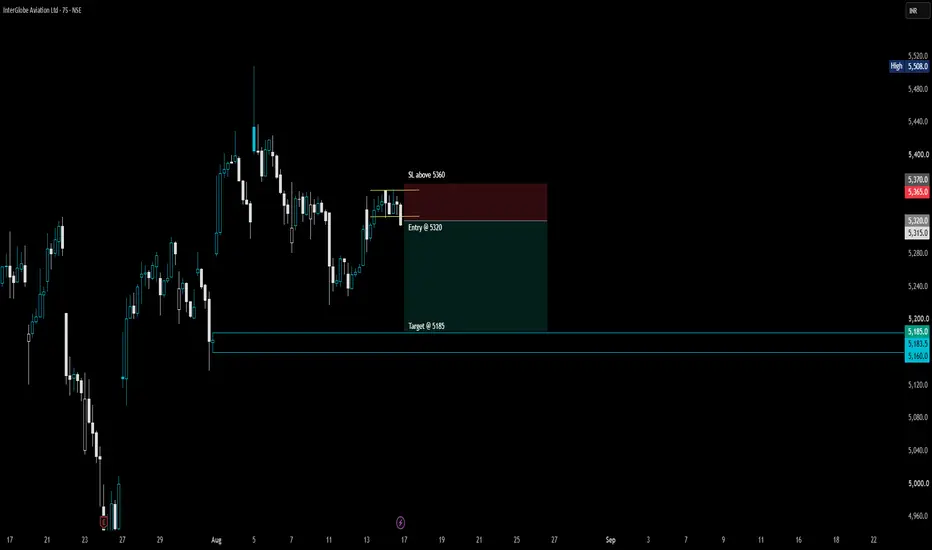
INDIGO - Channel Breakdown | High-Probability Short SetupHello traders, let's dive into the current price action for INDIGO (InterGlobe Aviation).
If we look closely at the recent market structure, the stock had been consolidating within a tight channel pattern since August 13th. However, the momentum has shifted, and we are now seeing clear signs of weakness as the price begins to break down from this localized support level.
The Trade Setup (Short):
Instead of guessing the market's next move, we wait for the chart to give us clear confirmation. He
INDIGO (D) CHARTTechnical Note: Let the market come to your zones and show its hand. Trade safely and manage your risk! Always wait for your own confirmations before entering the market.
Risk Disclaimer: This analysis is for educational purposes only and does not constitute financial advice. Always practice proper risk and position sizing. The market is supreme; no one can make a 100% accurate prediction. Stop Loss Must if you want to be a profitable Trader.
MARKET VIEW:-
Current Bias: BULLISH
Preferred Strat
INDIGO Ascending Triangle / Squeeze:Ascending Triangle / Squeeze: The stock is consolidating inside an ascending triangle pattern, forming higher lows along the rising trendline while encountering repeated resistance around the ₹5,500 - ₹5,517 zone.
Squeeze Near Apex: The price is approaching the pinch point near the trendline support and horizontal resistance. This typically precedes a higher-volatility expansion movement (breakout or breakdown).
"Disclaimer: Educational chart study only. Not a SEBI-registered advisory. No buy/
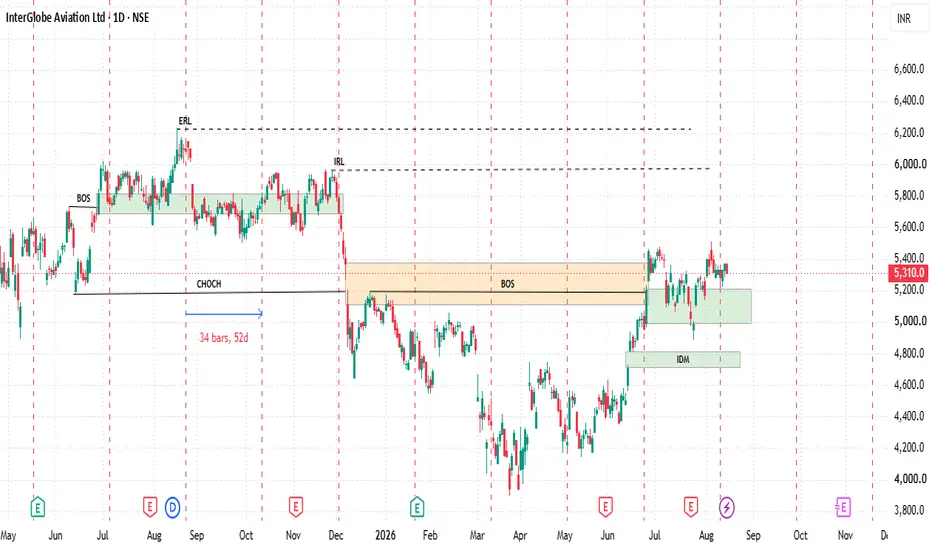
Indigo - A final leg down on the cards to move below 4000?CMP: 5333
TF: 75 minutes
(Daily TF chart with counts are copied below)
Exactly about one year after, As much as it looks like a breakout (of the falling trendline from the highs at 6232 (formed on 18th AUG 2025), I still feel that one more leg is pending for the script on the downside.
Internal counts for the A leg down and B leg up are marked with details for easy interpretation.
I could mark last week's (First week of Aug-26) high at 5510 as 5th of c of B leg.. or it could make one more
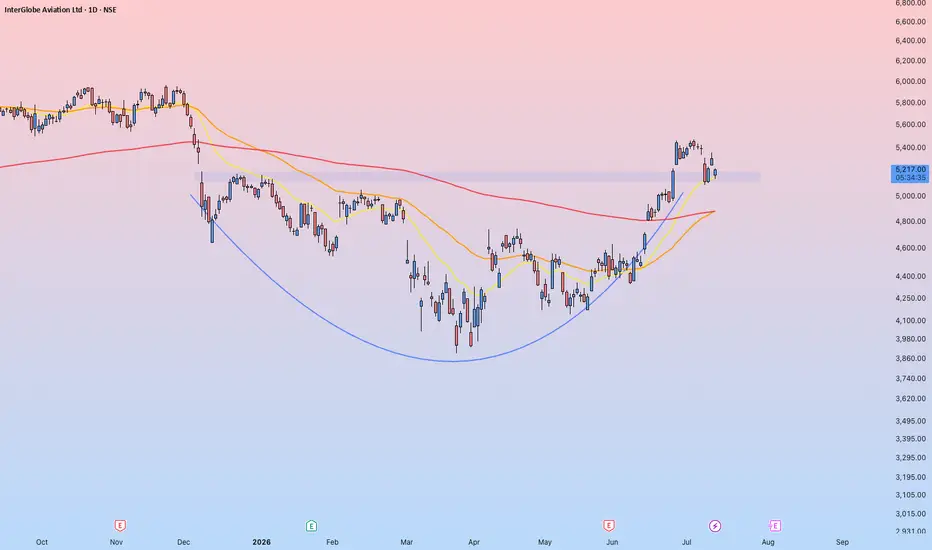
Base Breakout with RetestIndigo post the December mayhem has made a U-Shape recovery.
Post the breakout the price is currently retesting the previous resistance.
Taking support of short term EMA.
Bullish crossover of medium and long term EMA.
Indigo is the leading Airlines in Indian Aviation sector.
INDIGO Three Inside Up Breakout📊 STWP Equity Snapshot
________________________________________
MARKET STRUCTURE SNAPSHOT | NSE: INDIGO | DAILY
________________________________________
• Closing Price: 5,011.80 (+133.40 | +2.73%)
• Core Trend: Uptrend (Swing Structure)
• Market State: Breakout Attempt Above Consolidation Range
• Price Structure: Strong bullish continuation emerging from accumulation zone
________________________________________
OPERATIONAL PRICE GRID & KEY REFERENCE LEVELS
_____________________________________
Trend is your friend, Indigo.The greatest ally of a technical trader is the trend of the market. When the markets fail to give us higher highs, it is prudent not to make any long positions to preserve capital.
On 4H chart we can see a downward parallel channel with a potential breakout possibility. With the price near a resistance zone and no relief in headwinds for the company, it is advisable to go short on Indigo for a favourable risk:reward.
Entry: 3905
Target: 3895
Target2: Lower end of the channel.
SL: 4417
NSE – NIFTY 750 | InterGlobe Aviation Ltd | 22 Mar 2026Part of the ongoing NIFTY 750 Structural Census study.
InterGlobe Aviation reflects a sustained impulsive structure following the post-2020 expansion phase.
Price is currently correcting within the rising structure and interacting with trend support. This represents a structural test within the broader uptrend.
Structural Status: Sustained Impulsive Structure
This analysis is for educational purposes and reflects structural market observation.
Structure → Level → Trigger → Probability
#NF7
Indigo Share Analysis## ✈️ InterGlobe Aviation Ltd — Company Profile (IndiGo Airlines)
---
## 📌 Company Overview
**InterGlobe Aviation Ltd** is the parent company of **IndiGo**, India’s largest airline by market share in domestic air travel.
Founded in **2006**, the company operates as a **low-cost carrier (LCC)** focused on affordable, on-time, and efficient air transportation.
Its business philosophy is simple:
> **Low cost operations + High aircraft utilization + Large passenger volume = Profitability**
--
IndiGo – Watching for Potential RSI Positive Divergence ReversalINDIGO is trading near an important weekly zone after a healthy corrective phase, with price currently around 4,769 and weekly RSI cooling off towards the lower band. The earlier decline was largely driven by the flight‑cancellation chaos and related news flow, but much of that impact now appears to be digested both in price and in recent results.
On the weekly chart, price is still above the long‑term EMA but has meaningfully corrected from recent highs, bringing the RSI into a potential overs
INDIGO | Short @LTP | Strict SL above 5200 | Targets 4800, 4260Disclaimer (Please Read Carefully):
This is not investment advice. The stocks shared here are purely for educational and informational purposes. Please do your own research or consult with a financial advisor before making any investment decisions.
******************************************************************************************************************
Stock market में सिर्फ risk ही risk होता है। Market में survive करने का एक ही तरीका है, stop loss को पूरी discipline के साथ accept करन
NDIGO (InterGlobe Aviation) – Bearish Elliott Wave Setup (45-MinBias: Bearish | Structure: Impulsive 5-Wave Decline in Progress
Final Target (Wave 5): ~4300 Levels
Elliott Wave Structure (As per Chart)
Completed Waves
Wave 1 → Wave 2: Initial decline and corrective retracement.
Wave 3: Strong impulsive fall (largest, fastest leg).
Wave 4: Corrective structure (ABC) completed near the trendline resistance.
Wave 4 termination is well-placed:
Near prior breakdown zone
Below major resistance
Weak upside momentum
Overlapping structure (corrective in nature)
This
InterGlobe Aviation (INDIGO) – Weekly Elliott Wave OutlookInterGlobe Aviation (INDIGO) – Weekly Elliott Wave Outlook
On the weekly timeframe, INDIGO is clearly trading within a long-term rising channel, maintaining a strong primary uptrend. The structure so far suggests a completed impulsive sequence, with wave (iii) already in place and a corrective phase currently unfolding. The recent decline appears to be part of a corrective ABC structure, where wave C is projected to test the 38.2% retracement zone near 4430–4500, which also aligns well with cha
INDIGO | Short @LTP | Strict SL above 4885| Targets 4550, 4000Disclaimer (Please Read Carefully):
This is not investment advice. The stocks shared here are purely for educational and informational purposes. Please do your own research or consult with a financial advisor before making any investment decisions.
******************************************************************************************************************
Stock market में सिर्फ risk ही risk होता है। Market में survive करने का एक ही तरीका है, stop loss को पूरी discipline के साथ accept करन
When Charts Speak Before News: The IndiGo StoryWhen Charts Speak Before News: The IndiGo Story
From a trader’s lens, the IndiGo (InterGlobe Aviation) daily chart is telling a very uncomfortable story.
On 2nd May 2023, the price was around ₹2,085. From there, IndiGo (InterGlobe Aviation) moved into a strong and steady uptrend, reaching about ₹5,649 by 23 April 2025 – almost a threefold rise.
But what happened after that is what really raises eyebrows:
23 April to 28 November 2025 – the chart shows a clear distribution phase, where large,
INDIGO |Short below 5390 | Strict SL above 5580 |1st Target 4929Disclaimer (Please Read Carefully):
This is not investment advice. The stocks shared here are purely for educational and informational purposes. Please do your own research or consult with a financial advisor before making any investment decisions.
******************************************************************************************************************
Stock market में सिर्फ risk ही risk होता है। Market में survive करने का एक ही तरीका है, stop loss को पूरी discipline के साथ accept करन
Indigo, waiting for take off..I use simple price action and not in favor of using multiple indicators to make things complicated.
Check Indigo chart on daily time frame. Hovering around all time high, and now it's time to fly high. Keep eye on 5975 level. Closing above this level , then wait for 15-20% upside minimum in quick time
Disclaimer: this is NOT a buy/sell recommendation. Just for education purpose
IndiGo (InterGlobe Aviation): Breaking Out to New Highs! 🚀 IndiGo (InterGlobe Aviation): Breaking Out to New Highs! 🚀
📉 CMP: ₹5131
🔒 Stop Loss: ₹4420
🎯 Target: ₹6383
✈️ Why IndiGo Looks Promising?
🔹 All-Time High Breakout:
IndiGo is forming a rounding bottom on the weekly chart, heading towards an all-time high breakout with a monthly and weekly close at record levels.
🔹 Strength Amid Market Correction:
While Nifty corrected due to high valuations, IndiGo showed strong resilience—a sign of relative strength and institutional confidence.
🔹 Upcomin