Jindal Stainless Limited
No trades
No trades
In-depth trading ideas
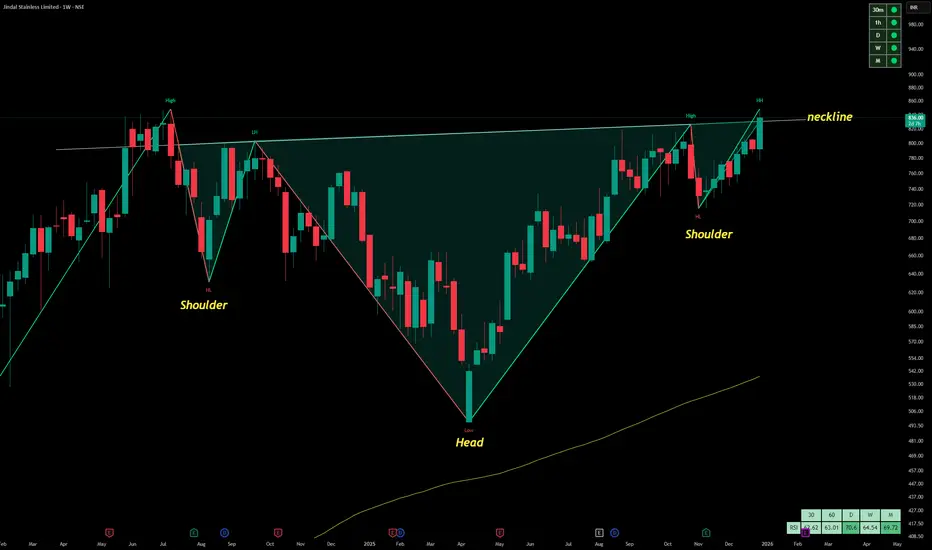
Inverse Head & Shoulders on JSL A textbook bullish reversal pattern is forming on Jindal Stainless. After a prolonged downtrend, the stock has carved out a deep Head between two higher Shoulders, with a clean neckline now in sight. Weekly RSI is strengthening, and price action shows signs of accumulation. A breakout above the neckline with volume could signal trend reversal and fresh upside.
Watch for sustained close above neckline + volume confirmation
Pattern targets can be projected from neckline to head depth.
Jindal Stainless Ltd., incorporated in the year 1980, is a Small Cap company (having a market cap of Rs 68,921.48 Crore) operating in Metals - Ferrous sector.
Jindal Stainless Ltd. key Products/Revenue Segments include Steel, Sale of services, Job Work, Other Operating Revenue and Export Incentives for the year ending 31-Mar-2025.
For the quarter ended 30-09-2025, the company has reported a Consolidated Total Income of Rs 10,982.46 Crore, up 6.87 % from last quarter Total Income of Rs 10,276.01 Crore and up 11.79 % from last year same quarter Total Income of Rs 9,823.88 Crore. Company has reported net profit after tax of Rs 821.71 Crore in latest quarter.
The company’s top management includes Mrs.Savitri Devi Jindal, Mr.Ratan Jindal, Mr.Abhyuday Jindal, Mr.Tarun Kumar Khulbe, Mr.Jagmohan Sood, Dr.Aarti Gupta, Mr.Ajay Mankotia, Mrs.Arti Luniya, Mr.Jayaram Easwaran, Dr.Rajeev Uberoi, Mrs.Shruti Shrivastava, Mr.Navneet Raghuvanshi. Company has Walker Chandiok & Co. LLP as its auditors. As on 30-09-2025, the company has a total of 82.44 Crore shares outstanding.
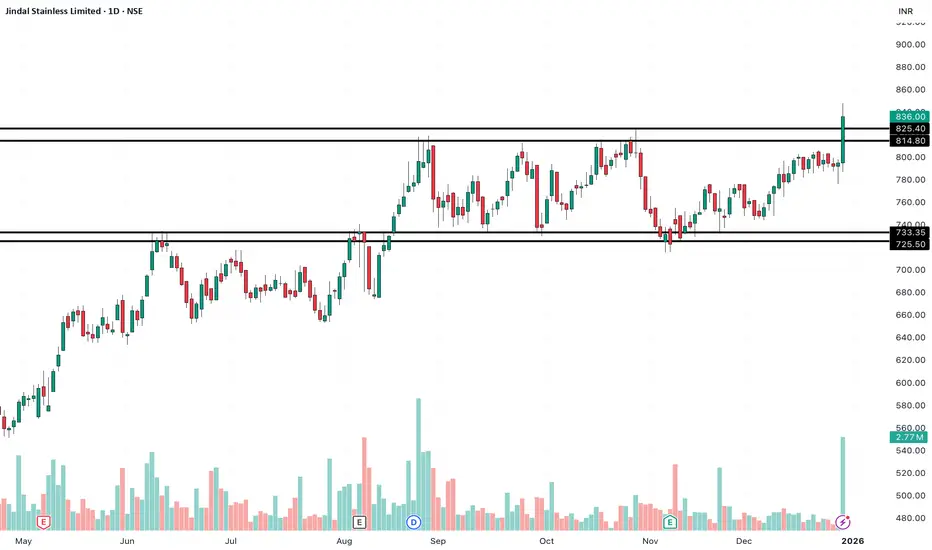
Jindal Stainless Ltd (Daily | NSE)🔑 Key Observations
1️⃣ Structure & Trend
Clear higher high – higher low structure since April → primary trend is bullish.
Price has respected demand zones around ₹725–735 multiple times → strong base.
2️⃣ Breakout Quality
Recent candle shows a strong bullish close above ₹825–830, which was a major supply / resistance zone.
Breakout is accompanied by above-average volume (≈2.77M) → confirms institutional participation.
3️⃣ Support & Resistance Mapping
Immediate Support: ₹815–820 (previous resistance, now support)
Major Support: ₹785–790
Next Resistance / Target Zones:
₹860–880 (measured move + prior swing projection)
₹910–930 (extension zone if momentum continues)
4️⃣ Momentum Context
No signs of exhaustion candles (no long upper wicks or rejection).
Consolidation before breakout → energy build-up pattern (range expansion likely).
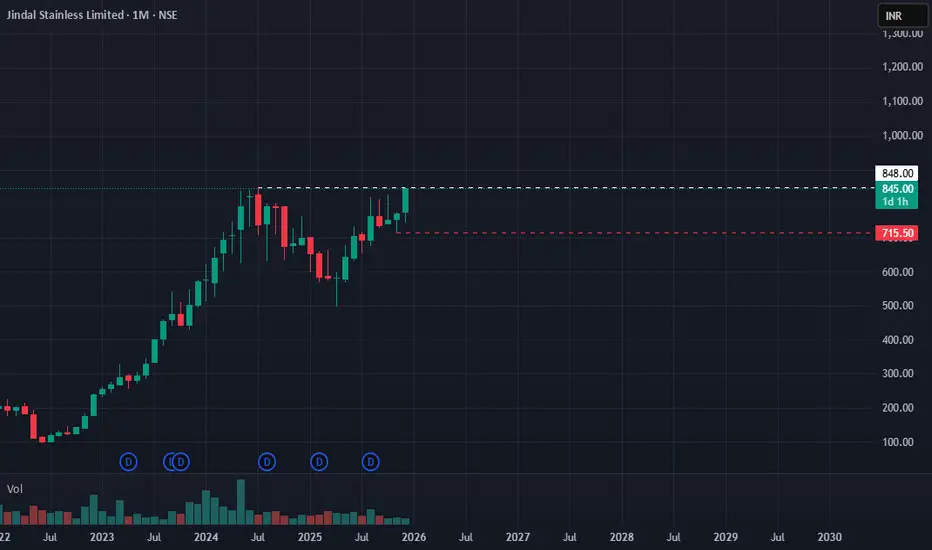
JINDAL STAINLESS – Ready for New Rally?JINDAL STAINLESS – Ready for New Rally? 🚀
Jindal Stainless Limited
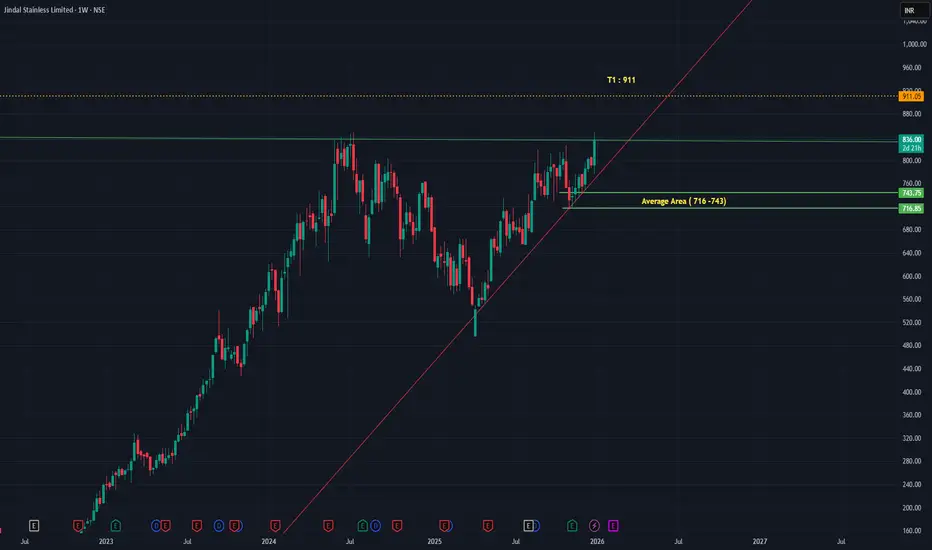
📌 Trade / Positional Setup
• CMP: ₹847
• SL: ₹715
• Target: ₹1202
📍 Structure & Logic
• Rounding bottom structure in place
• Monthly close above ₹848 = pattern breakout confirmation
• Metal rally is rotating (Copper → Aluminium → Steel)
• Rotation tailwind can push JSL towards new highs
🧠 Approach:
Structure-based positional trade — patience + position sizing required.
Enter/hold on confirmation; avoid chasing intraday noise.
⚠️ Clarification:
This is an independent analysis based purely on technical and market study. No part of Religare is involved in this view or recommendation.
📝 Important:
I am not responsible for any loss or profit incurred. I am not taking any fees — sharing for educational and informational purposes only.
📉 Disclaimer: Not SEBI-registered. Please do your own research or consult a financial advisor before taking any investment decision.
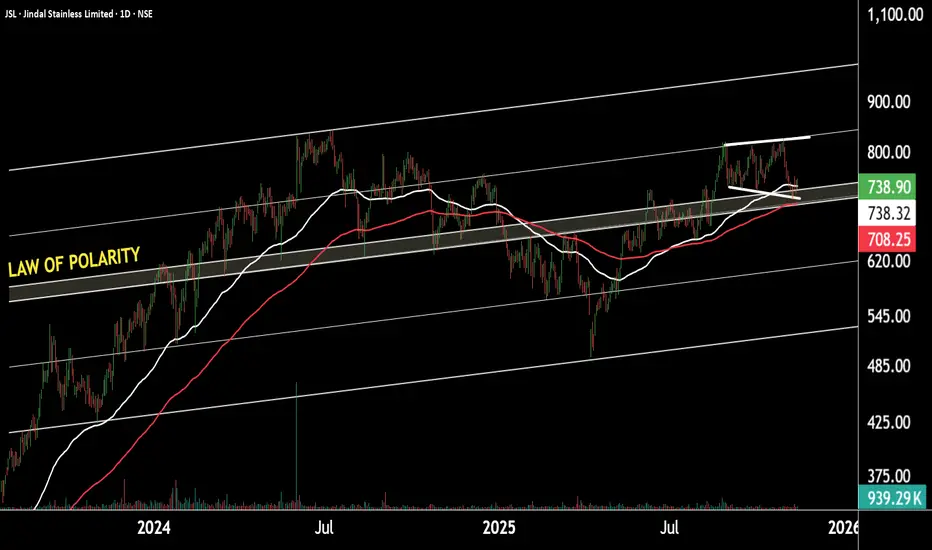
JSL Entering Bull Mode – Potential Upside Loading!JSL – Daily Timeframe Analysis
JSL is moving within a well-defined parallel channel and is currently sustaining above the Lop and key support zone near ₹700–710.
The EMA’s positive crossover further confirms the bullish trend and supports the ongoing momentum in this range.
On the shorter timeframe, the stock is forming a broadening wedge pattern with a support base around ₹700–710.
If this zone continues to hold, we may witness higher price levels in JSL in the coming sessions.
Thank you!
Swing Trade Journey – Trade 14: JSLTrade 14 Log
Long in #JSL at ₹778
Reasoning:
Same sector view as prior trades — anticipating a broader metal stock rally. Price is forming support above short-term averages with signs of accumulation. Risk–reward looks favourable within the sector momentum.
Tracking this as part of my swing trade journey — recording setups, risks & outcomes.
#TradingJourney #StockMarketIndia #SwingTrading #JST #Metals
Breakout spotted in Jindal Stainless – momentum could accelerateThis is the daily chart of Jindal Stainless (JSL).
JSL is currently trading near its resistance zone, while the RSI is sustaining above 69.This indicates strong momentum, and the stock may give a breakout this time.
JSL has a strong support zone in the 700–720 range.
If a breakout occurs, we may see higher prices in JSL.
For a safer trade, one can wait for a retest near the support zone before entering, which may provide a better risk-reward setup for capturing the upside move.
Thank You !!
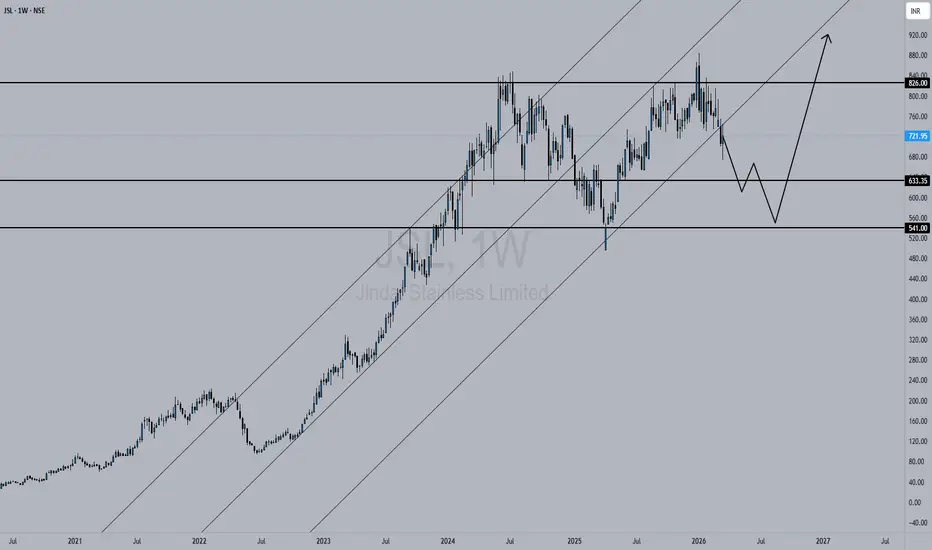
JSL is Shorttime Downside Trend Sharing the chart of JSL in detail research as my opinion trend is Bearish. If closeing basis below 670 then Tg - 657-655, For a shorter time 1 week to 2 weeks
I AM NOT A SEBI REGISTER,
Before invest or trade please consult with financial advisor.
SO This is not TIPS, SUGGESTIONS. Just Sharing my Experience.
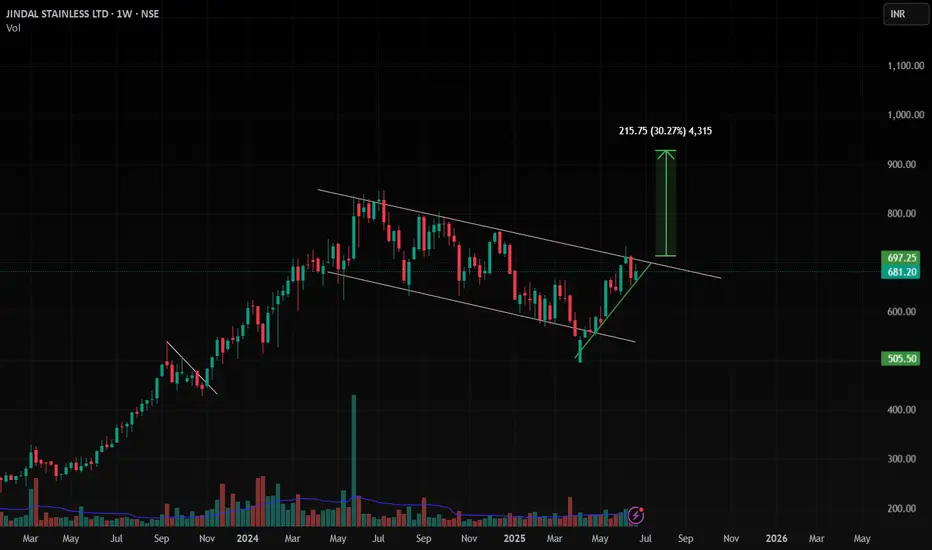
JINDAL STAINLESS Breaks the Channel – What’s Next?After completing a long WXY correction, Jindal Stainless has flipped into a strong uptrend. The price broke above the downtrend channel and also reclaimed the 200-day moving average — confirming strength.
The rally from 504 has unfolded as a nested 1-2, 1-2 impulse, and the wave 5 has now entered its 1 to 1.618 projection zone. We’re likely entering a blue Wave 4 pullback, especially as:
RSI shows bearish divergence
The rally looks stretched short-term
A healthy retracement toward the 661–640 zone can follow.
As long as 633.35 holds, this bullish structure remains intact.
Trend : Bullish
Retracement zone : 661.80 – 640.65
Invalidation : Below 633.35
This is a dynamic setup. Chart will be updated as price action unfolds
Disclaimer: This analysis is for educational purposes only and does not constitute investment advice. Please do your own research (DYOR) before making any trading decisions.
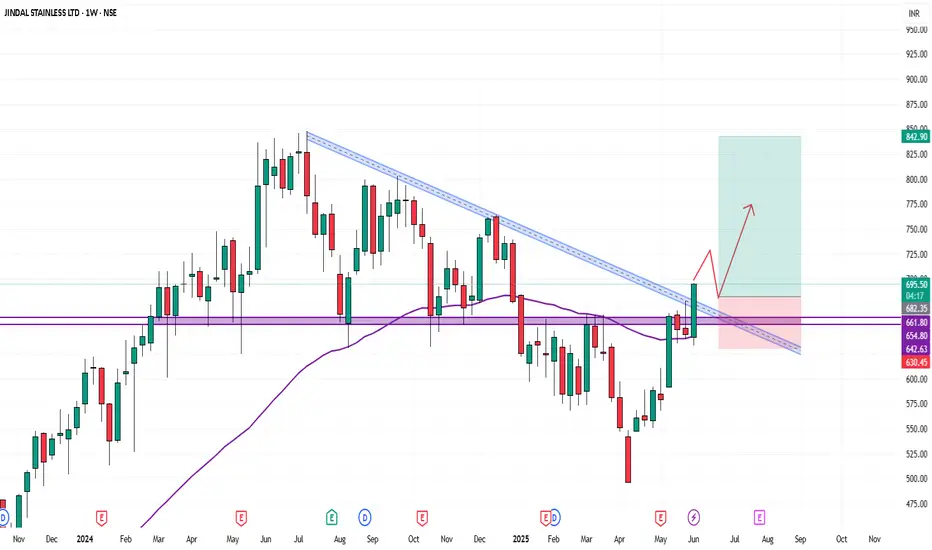
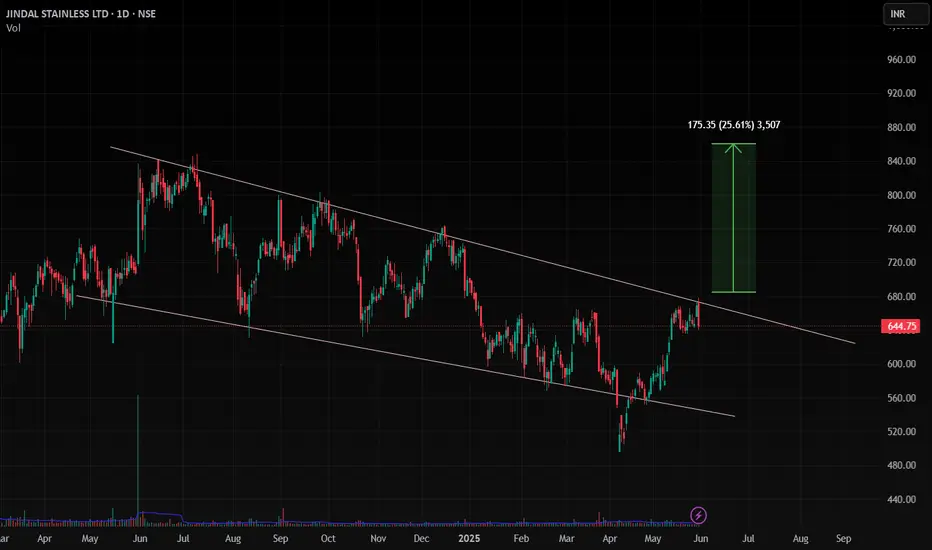
Jindal stainless ltdJindal Stainless Ltd has been forming higher lows and has now broken through the key resistance level at 660. With this congestion breakout, the stock signals a continued bullish move, potentially heading towards the target of 740.
Please conduct your own technical analysis and apply proper risk management before taking any trade. This is solely my personal view.
#jsl #bestbreakout #uptrend #longteam
Jindal Stainless Ltd Stock Daily AnalysisJindal Stainless Ltd has been forming higher lows and has now broken through the key resistance level at 660. With this congestion breakout, the stock signals a continued bullish move, potentially heading towards the target of 740.
Please conduct your own technical analysis and apply proper risk management before taking any trade. This is solely my personal view.
Review and plan for 6th June 2025 Nifty future and banknifty future analysis and intraday plan.
Positional ideas.
This video is for information/education purpose only. you are 100% responsible for any actions you take by reading/viewing this post.
please consult your financial advisor before taking any action.
----Vinaykumar hiremath, CMT
JSL-promoters are showing lot of confidence !This chart represents the weekly price action of Jindal Stainless Ltd. (NSE) with an Elliott Wave analysis and Fibonacci retracement levels. Here's a summary of the key observations:
Technical Analysis Summary:
Elliott Wave Structure:
The stock appears to be in a corrective Wave 4 after completing an impulsive Wave 3.
A potential Wave 5 uptrend is anticipated, as per the Elliott Wave structure.
Fibonacci Retracement Levels:
The price has retraced close to the 0.5 Fibonacci level (465.85), which is a strong support zone.
The 0.382 level (553.40) is also a critical resistance, which the price is testing.
RSI Analysis (Relative Strength Index):
RSI is at 40.26, indicating that the stock is approaching the oversold region.
The RSI moving average (44.12) is slightly above the RSI value, suggesting weak momentum.
Support & Resistance:
Support levels: ~465.85 and ~549.90.
Resistance levels: Previous high near 848.00.
Possible Future Movement:
If Wave 4 completes, a bullish reversal for Wave 5 could take the stock higher.
A further breakdown below 465.85 might invalidate the bullish scenario.
Conclusion:
The stock is in a correction phase, but signs of reversal are emerging.
Watch for price action near the 549.90 support zone and RSI movement above 50 for confirmation of bullish momentum.
If bullish Wave 5 starts, the stock may target new highs.
JSL- On My shopping list!!Analysis of the Chart (Jindal Stainless Ltd - NSE, Weekly Timeframe)
1. Elliott Wave Structure
Wave (1) and (2) are complete.
Wave (3) reached its peak and Wave (4) is forming, finding support near 549.90 INR (highlighted blue line).
Wave (5) projection: The chart suggests a possible bullish move from Wave (4) to Wave (5), targeting new highs.
2. Fibonacci Retracement Levels
0.382 (553.40 INR) and 0.5 (465.85 INR) are key Fibonacci levels.
Current support: The stock is bouncing from the 0.382 Fibonacci retracement level, indicating a potential reversal zone.
If this level fails, the next major support is near 465 INR (0.5 level).
3. Price Action & Trendline Support
The stock has been following an ascending channel, touching both the upper and lower trendlines.
Currently, the price is near the lower boundary of the channel, which historically has acted as a strong support.
A breakout above the mid-line of the channel could trigger Wave (5) rally.
4. RSI (Relative Strength Index)
The RSI is 39.48, indicating mildly oversold conditions.
The RSI-based moving average is 44.59, showing weakness but also potential for reversal.
If RSI crosses above 50, it could signal bullish momentum.
5. Key Levels to Watch
Immediate Support: 549.90 INR (current bounce level)
Major Support: 465.85 INR (0.5 Fibonacci level)
Resistance Levels:
605-610 INR (recent highs)
848 INR (previous peak & target for Wave 5)
Conclusion
✅ Bullish Scenario: If the price holds 549 INR support and RSI improves, a potential Wave 5 rally could push the stock towards 700-850 INR in the coming months.
❌ Bearish Scenario: A breakdown below 465 INR could signal further downside towards 350-400 INR.
Jindal stainless steel-Bullish Swing- Is this reversal signal???
12.08.2024
Buy 694
Target 807
Stop Loss 616
Risk Reward- 1:1.5
1. Inside bar breakout
2. Price rejection from both parallel and horizontal support zone
3. Double bottom formation.
4. RSI from over sold to normal bullish level(40)
5. Good increasing volumes in bullish movement
6. Price rejection from 0.618 Fibonacci level
7. 200 EMA Rejection
NSE:JINDALSTEL
JSL S/RSupport and Resistance Levels:
Support Levels: These are price points (green line/shade) where a downward trend may be halted due to a concentration of buying interest. Imagine them as a safety net where buyers step in, preventing further decline.
Resistance Levels: Conversely, resistance levels (red line/shade) are where upward trends might stall due to increased selling interest. They act like a ceiling where sellers come in to push prices down.
Breakouts:
Bullish Breakout: When the price moves above resistance, it often indicates strong buying interest and the potential for a continued uptrend. Traders may view this as a signal to buy or hold.
Bearish Breakout: When the price falls below support, it can signal strong selling interest and the potential for a continued downtrend. Traders might see this as a cue to sell or avoid buying.
20 EMA (Exponential Moving Average):
Above 20 EMA: If the stock price is above the 20 EMA, it suggests a potential uptrend or bullish momentum.
Below 20 EMA: If the stock price is below the 20 EMA, it indicates a potential downtrend or bearish momentum.
Trendline: A trendline is a straight line drawn on a chart to represent the general direction of a data point set.
Uptrend Line: Drawn by connecting the lows in an upward trend. Indicates that the price is moving higher over time. Acts as a support level, where prices tend to bounce upward.
Downtrend Line: Drawn by connecting the highs in a downward trend. Indicates that the price is moving lower over time. It acts as a resistance level, where prices tend to drop.
RSI: RSI readings greater than the 70 level are overbought territory, and RSI readings lower than the 30 level are considered oversold territory.
Combining RSI with Support and Resistance:
Support Level: This is a price level where a stock tends to find buying interest, preventing it from falling further. If RSI is showing an oversold condition (below 30) and the price is near or at a strong support level, it could be a good buy signal.
Resistance Level: This is a price level where a stock tends to find selling interest, preventing it from rising further. If RSI is showing an overbought condition (above 70) and the price is near or at a strong resistance level, it could be a signal to sell or short the asset.
Disclaimer:
I am not a SEBI registered. The information provided here is for learning purposes only and should not be interpreted as financial advice. Consider the broader market context and consult with a qualified financial advisor before making investment decisions.