JSW Infrastructure Limited
No trades
No trades
In-depth trading ideas
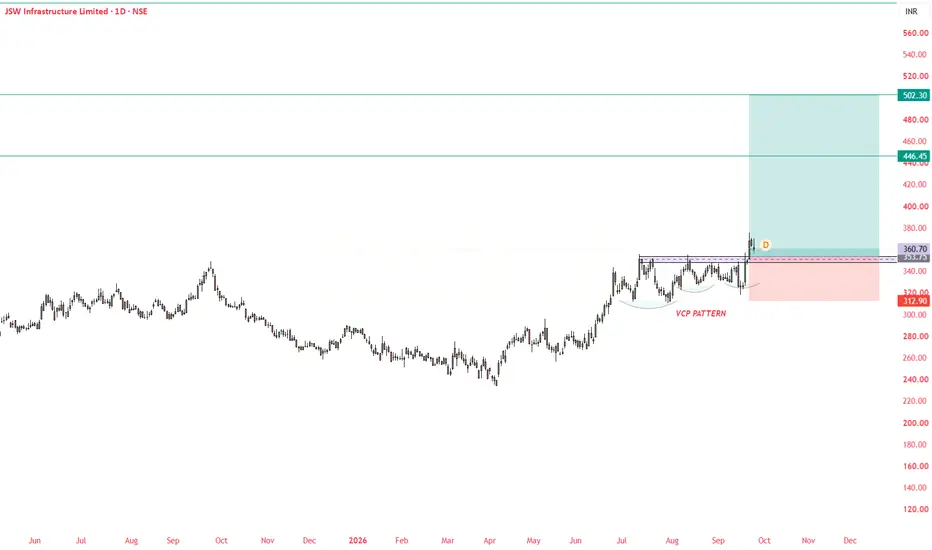
JSWINFRA-VCP PatternVolume Contraction Pattern + Weekly Breakout 📈
A clean setup showing a volume contraction pattern followed by a weekly breakout, potentially indicating a shift in momentum and increased participation.
Sharing this chart purely for educational purposes.
Please do your own research and analysis before taking any trading position.
#TradingView #TechnicalAnalysis #Breakout #VolumeContraction #SwingTrading #PriceAction
JSW Infrastructure 🎯 STOCK TO WATCH
WEEKLY R4 BREAKOUT SETUP
JSW INFRASTRUCTURE LTD — NSE: JSWINFRA
₹356–360 → ₹568
📌 TRADE LEVELS
🟢 Buy Zone: ₹356–360
🚀 Breakout Zone: ₹356
🛑 Stop Loss: ₹296
🎯 Target: ₹568
💰 ₹20,000 ALLOCATION PLAN
Using ₹358 as reference:
Approx. shares: 55
Investment: ₹19,690
At ₹568: ₹31,240
Potential Profit: ₹11,550
Potential Return: ~58.7%
⚓ BUSINESS OVERVIEW
One of India's leading private port operators.
Operates ports, terminals and logistics assets.
Q1 FY27 cargo volumes reached 31 MT, +6% YoY.
Logistics business is expanding alongside the port network.
🔥 WHY IT CAUGHT MY ATTENTION
✅ ₹356 is the key breakout reference
✅ Q1 FY27 revenue ₹1,444.8 Cr, +18.1% YoY
✅ Operating EBITDA ₹674 Cr, +16% YoY
✅ Logistics EBITDA jumped to ₹73 Cr from ₹20 Cr
✅ Long-term capacity expansion planned toward 400 MTPA by FY30.
📊 COMPANY SNAPSHOT
Industry: Ports & Infrastructure
Q1 FY27 Revenue: ₹1,444.8 Cr
Q1 FY27 EBITDA: ₹674 Cr
Q1 FY27 Cargo: 31 MT
FY30 Capacity Goal: 400 MTPA
📊 RISK VS REWARD
Using ₹358 as reference:
🔻 Risk: ₹358 → ₹296
~17.3% downside
🟢 Reward: ₹358 → ₹568
~58.7% upside
Risk Defined. Reward Visible.
⚠️ IMPORTANT
High-risk momentum setup.
Q1 PAT declined despite strong revenue and EBITDA growth.
Port/logistics businesses remain sensitive to trade volumes, geopolitical conditions and execution.
Follow strict stop-loss discipline.
Disclaimer: This content is for educational purposes only and not investment advice. Please do your own due diligence before making any investment decisions.
© 20K Microcap Investing | R4 Momentum Desk
#JSWInfrastructure #JSWINFRA #PortsStocks #InfrastructureStocks #LogisticsStocks #MomentumStocks #BreakoutStocks #IndianStocks #R4Momentum #StockToWatch
BULLISH VIEW IN JSWINFRA (NEAR BREAKOUT)- EDUCATIONAL PURPOSEJSW Infrastructure Limited provides maritime-related services including, cargo handling, storage solutions, and logistics services.
Stock is trading near 52 week high. Waiting for breakout. Once 385.is crossed and sustained it can continue its uptrend. Long position can be initiated once breakout is confirmed.
TARGET : 641 (79%) (FIBO)
STOPLOSS : WEEKLY CLOSING BELOW 310 (-13.5%)
RR RATIO: 1:5.9
TIME HORIZON : 40 months ( Till Dec 2029)
JSW Infra: Fundamentals Meet a Breakout SetupJSW Infrastructure continues to build a strong long-term growth profile through expansion of its port, cargo-handling and logistics operations. The company has also been strengthening its balance sheet to support its expansion plans, while institutional participation has increased significantly.
Fundamental Analysis
JSW Infrastructure operates in an asset-intensive industry with high entry barriers, and its financial profile reflects the benefits of scale. The company currently maintains an operating profit margin of around 48% and a net profit margin of approximately 27%. ROE stands around 14%, while ROCE is approximately 12.7%, indicating that the business continues to generate reasonable returns on the capital employed.
The long-term growth record is notable. The company's five-year net profit growth is above 400%, while operating cash flow has also increased substantially over the same period. Revenue growth remains healthy, supported by increasing cargo volumes and capacity expansion.
The latest operating numbers remain constructive. Q1 FY27 cargo volume increased to approximately 31 MT from 29.4 MT YoY, while revenue from operations increased to around ₹1,208 crore from ₹1,086 crore in the corresponding period. Operating EBITDA increased to approximately ₹601 crore, although the EBITDA margin moderated to around 49.8%.
The recent earnings picture is therefore mixed: operational growth remains intact, but PAT growth has temporarily lagged revenue and operating-profit growth.
Balance Sheet
JSW Infrastructure's leverage remains manageable. Total debt-to-equity is around 0.59x, while long-term debt-to-equity is approximately 0.55x. Interest coverage is around 7.7x, providing a reasonable cushion against interest costs.
The company's FY26 net debt-to-equity was approximately 0.27x, while net debt to operating EBITDA was around 1.19x. These levels indicate that the company has taken on additional debt for expansion, but leverage remains within a manageable range.
The company also raised approximately ₹6,555 crore through a QIP in June 2026, providing additional capital for future expansion.
Institutional Holding
One of the most notable developments in the fundamental story is the sharp increase in institutional ownership.
Institutional holding increased from approximately 9.4% in March 2026 to 20.4% in June 2026.
Within this:
FII holding: 6.9% → 11.2%
Mutual Fund holding: 2.1% → 8.7%
DII holding: approximately 2.5% → 9.2%
This represents a substantial increase in institutional participation.
Promoter holding declined from approximately 83.6% to 73.9% during the same period. However, this change needs to be viewed alongside the June 2026 QIP and the resulting increase in the company's equity base rather than being interpreted simply as promoter selling.
Valuation
The major fundamental consideration is valuation.
JSW Infrastructure trades at approximately 51x trailing earnings, around 6.7x book value, with EV/EBITDA in the high-teens. These ratios indicate that the market is assigning a significant premium to the company's future growth prospects.
Therefore, the fundamental equation is clear:
Strong business growth + improving institutional participation + manageable leverage
versus
Premium valuation + recent moderation in PAT growth.
For the valuation to remain supported over the longer term, continued revenue growth, improving earnings, disciplined capital allocation and healthy returns on incremental capital will be important
Technical Analysis
The long-term daily chart presents an interesting Cup & Handle formation.
The stock recovered from the ₹220–₹250 region and gradually moved back toward the ₹350–₹360 area, forming the cup. The subsequent consolidation around the ₹310–₹360 region represents the handle portion of the pattern.
The stock closed around ₹348.25 on September 18, 2026, after trading as high as approximately ₹356.25, with volume of around 25.41 million shares.
The price is therefore approaching an important long-term resistance zone.
Key Technical Levels
The chart identifies ₹350–₹367 as the major yearly resistance region.
Resistance
₹367 — Major breakout level
A sustained daily close above ₹367 would represent a breakout from the major resistance zone and would provide technical confirmation of the Cup & Handle structure.
The next chart-based resistance levels are:
₹396 → ₹420 → ₹465
These represent the successive upside levels marked on the chart.
Support / Reversal Zone
The ₹310–₹330 region is the key reversal and support zone.
This area becomes important because it represents the lower boundary of the recent handle/consolidation structure.
A sustained breakdown below this zone would weaken the present Cup & Handle setup and indicate that the breakout structure requires reassessment.
Cup & Handle Structure
The technical structure can therefore be visualised as:
₹310–₹330 → Reversal / Support Zone
₹350–₹367 → Major Resistance / Breakout Zone
₹367 → Breakout Confirmation
₹396 → First Major Resistance
₹420 → Next Resistance
₹465 → Higher Resistance
The most important technical confirmation would come from a sustained close above ₹367 accompanied by strong volume and improving momentum indicators.
Conclusion
JSW Infrastructure presents an interesting techno-fundamental setup. Fundamentally, the company has strong operating margins, substantial long-term earnings growth, manageable leverage and a significant increase in institutional participation. The QIP has also strengthened the capital base for future expansion.
At the same time, the valuation remains demanding, while recent PAT growth has moderated. Therefore, future earnings growth will be important in validating the current valuation.
Technically, the stock has developed a large Cup & Handle structure and is approaching the crucial ₹350–₹367 yearly resistance zone. Momentum indicators such as RSI, MACD and ADX should be monitored alongside volume for confirmation.
The key technical trigger remains ₹367. A sustained breakout above this level would place ₹396, ₹420 and ₹465 as the next chart-based resistance levels, while ₹310–₹330 remains the major structural support/reversal zone.
Disclaimer: aliceblueonline.com
JSW Infrastructure Ascending Triangle Near MultiMonth ResistanceJSW Infrastructure is approaching a critical multi-month resistance zone around ₹345, where price is compressing into an ascending triangle after a strong impulsive rally.
The stock has consistently formed higher lows, indicating increasing buying pressure, while the horizontal resistance continues to cap price. This type of structure often precedes a significant directional move.
🔍 Technical Setup
Timeframe: Daily
CMP: ₹345.25
Pattern: Ascending Triangle
Major Resistance: ₹345–₹352
Immediate Support: ₹338
Trendline Support: ₹332
Major Support: ₹314
🎯 Bullish Scenario
A decisive close above ₹345–₹352, supported by rising volumes, would confirm the breakout and could trigger the next leg higher.
Target 1: ₹365
Target 2: ₹380
Target 3: ₹400+
⚠️ Risk
Failure to break the resistance may lead to another consolidation phase toward the ascending trendline. A breakdown below ₹332 would invalidate the current bullish setup.
📌 Trade Plan
Entry: On a confirmed breakout above ₹352
Stop Loss: Below ₹332
Confirmation: Strong volume expansion and daily close above resistance
This is a classic ascending triangle breakout setup, where persistent higher lows are pressuring a long-term resistance. Keep it on your watchlist for a high-probability momentum move.
Disclaimer: This analysis is for educational purposes only and should not be considered investment advice.
JSW Infrastructure – Bullish Continuation Setup Near ₹275 ZoneThe price has shown a strong recovery after a consolidation phase and is currently trading around the ₹270–₹275 zone. The recent bullish momentum indicates strength, suggesting a potential continuation of the uptrend if the price sustains above the breakout area.
The key demand/support zone lies near ₹237 – ₹265, which can act as a strong base on pullbacks.
Trade Plan
Entry Zone:
₹268 – ₹275 (on consolidation or minor pullback near breakout zone)
Stop Loss:
₹237.10 (below key demand zone / invalidation level)
Primary Targets:
₹302.60 (near-term resistance level)
₹339.75 (major resistance level)
₹376.45 (final target if momentum continues)
Chart Observations
• Price has formed a higher low structure, indicating bullish recovery.
• The ₹237 – ₹265 zone is acting as a strong demand area.
• Current price action near ₹275 suggests breakout continuation strength.
• ₹302 is the immediate resistance where price may face selling pressure.
• A breakout above ₹302 can push the price toward ₹339 and higher levels.
• Structure supports bullish continuation after accumulation.
Notes
• This is a bullish continuation setup — buying on dips is favorable.
• The stop loss at ₹237.10 helps manage downside risk effectively.
• Traders may consider partial profit booking near ₹302 and trail positions for higher targets.
Disclaimer
This idea is for educational purposes only and not financial or investment advice. Markets are volatile and conditions can change quickly. Always do your own analysis and apply proper risk management before taking any trades.
JSW Infrastructure – Reversal on Cards?🚢 JSW Infrastructure – Reversal on Cards?
📊 CMP: ₹286
🛑 SL: ₹254
🎯 Targets: ₹304 | ₹349 | ₹420
JSW Infrastructure is forming a bullish Rounding Bottom pattern, indicating a potential trend reversal.
A sustained breakout above ₹292 can confirm the setup and trigger an upside move towards ₹349. If the stock breaches and sustains above ₹349, a larger rounding bottom pattern can get activated, opening the way for ₹420 in the medium term.
✅ Rounding Bottom Formation
✅ Breakout Trigger: ₹292
✅ Major Resistance: ₹349
✅ Positional Bullish Setup
⚠️ Markets remain volatile. Maintain strict position sizing, keep your stop loss in the system, and stay patient with the trade.
⚠️ Clarification:
This is an independent analysis based purely on technical and market study. No part of Religare is involved in this view or recommendation.
📝 Important:
I am not responsible for any loss or profit incurred. I am not taking any fees for these views—just sharing my analysis for educational and informational purposes.
📉 Disclaimer:
Not SEBI-registered. Please do your own research or consult a financial advisor before taking any investment decision.
Positional setup for JSW Infrastructure (JSWINFRA)🔍 Fundamentals (from Screener & other sources)
Market Cap: ~ ₹69,000 Cr.
Revenue / Profit: Last reported revenue ~₹4,690 Cr, Profit ~₹1,614 Cr.
5-Yr Profit Growth: ~51.5% CAGR.
Valuation:
P/E is very high (in some sources ~186×) which suggests heavy premium pricing.
P/B ≈ 13.3×.
Returns: ROE ~14.5%, ROCE ~13.3%.
Dividend Yield: Very low (~0.24-0.3%) indicating most return is from capital appreciation.
Pros: Good profit growth, infrastructure tailwinds, improving operational metrics.
Cons: Rich valuation, high expectations priced in. Any weakness in cargo volumes or macro slowdown could hurt sentiment.
📈 Technical / Positional Setup
Based on the chart shared and corroborated with external technicals:
Resistance Zone: ~₹330-₹335 seems to be a critical resistance level (multiple past highs around that).
Support Zones: ~₹300-₹310 (recent pivot), deeper support around ₹280-₹290 if weakness.
Moving Averages: Short term EMAs seem aligned bullishly (from chart), price pushing above resistance, indicating breakout attempt.
Macd / Momentum: External sources show moving averages giving “Buy” signals; momentum indicators generally positive.
🎯 Trade Plan
Parameter Value
Entry On clean breakout above ~₹335 with confirmation (strong volume)
Stop-Loss Below support ~₹300 - ₹305 zone
Target 1 ~₹370-₹400 (next resistance zones)
Target 2 ~₹430-₹450 (extended if trend continues)
Risk Profile High: because valuation is stretched and driver (cargo volumes, infra spending) needs to sustain
Review and plan for 17th September 2025 Nifty future and banknifty future analysis and intraday plan.
This video is for information/education purpose only. you are 100% responsible for any actions you take by reading/viewing this post.
please consult your financial advisor before taking any action.
----Vinaykumar hiremath, CMT
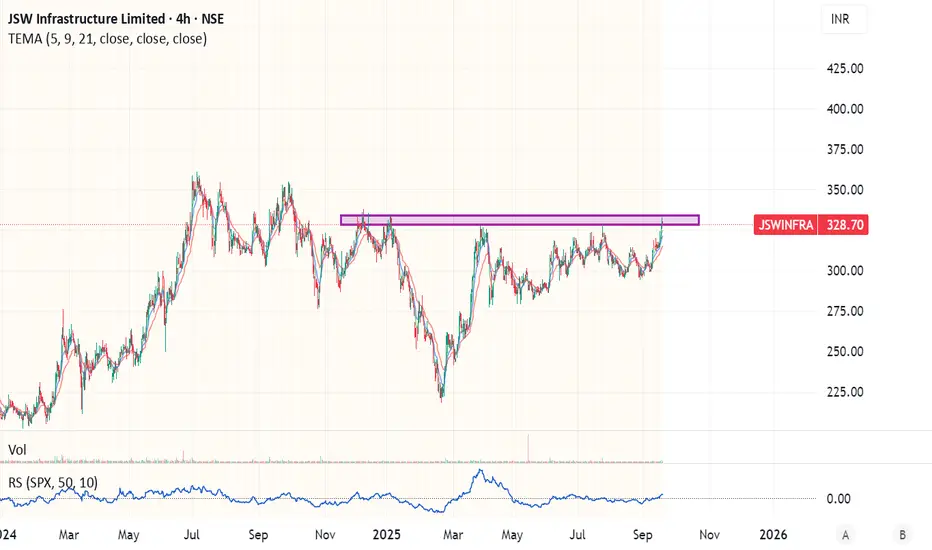
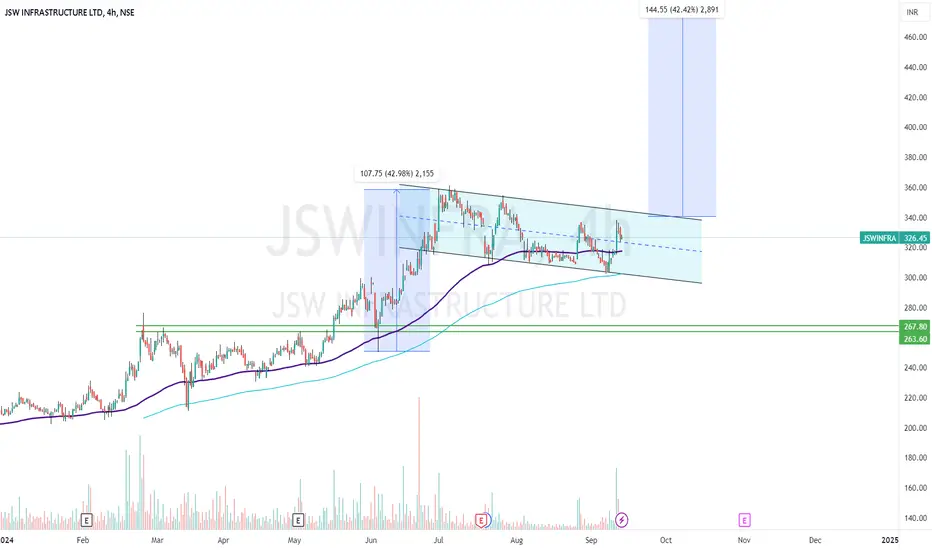
JSW INFRAJSW Infrastructure Ltd. (currently trading at ₹326) is India’s second-largest private port operator and a key logistics arm of the JSW Group. It operates 12 port concessions across India and a liquid storage terminal in Fujairah, UAE, with a total cargo-handling capacity of 170 MTPA. The company offers end-to-end maritime services including cargo handling, storage, rail connectivity, and logistics parks. JSW Infra is expanding aggressively through brownfield acquisitions, mechanization projects, and multi-modal logistics hubs.
JSW Infrastructure Ltd. – FY22–FY25 Snapshot
• Sales – ₹1,603 Cr → ₹2,950 Cr → ₹3,850 Cr → ₹4,476 Cr Growth driven by cargo volume expansion
• Net Profit – ₹284 Cr → ₹890 Cr → ₹1,240 Cr → ₹1,521 Cr Earnings surge supported by operating leverage and tariff optimization
• Operating Performance – Strong → Strong → Strong → Strong EBITDA margins consistently above 50%; high asset utilization
• Dividend Yield (%) – 0.00% → 0.27% → 0.30% → 0.35% Initiated payouts post listing; reinvestment remains priority • Equity Capital – ₹2,000 Cr (constant) No dilution; strong balance sheet post IPO
• Total Debt – ₹3,200 Cr → ₹3,000 Cr → ₹2,850 Cr → ₹2,700 Cr Gradual deleveraging supported by internal accruals
• Fixed Assets – ₹6,800 Cr → ₹7,500 Cr → ₹8,200 Cr → ₹9,000 Cr Capex focused on berth mechanization, rail siding, and logistics parks
Institutional Interest & Ownership Trends
Promoter holding stands at 85.00%, with no pledging. FIIs and DIIs have actively accumulated post IPO, citing long concession tenures and high-margin infra assets. Delivery volumes reflect long-term positioning by infra, logistics, and ESG-focused funds.
Business Growth Verdict
JSW Infra is scaling across port terminals, logistics parks, and rail connectivity Margins remain robust due to mechanization and operating efficiency Debt is declining steadily with strong operating cash flows Capex supports long-term competitiveness and cargo diversification
Management Con Call
• Q1 FY26 revenue rose 21.2% YoY to ₹1,223 Cr; PAT up 31.4% YoY to ₹390 Cr • Signed 30-year concession with Kolkata Port for ₹740 Cr berth modernization24 • Acquired 86-acre rail siding in Ballari, Karnataka for ₹57 Cr; ₹380 Cr logistics park planned5 • FY26 outlook: 18–20% revenue growth, 5–7% volume CAGR, and margin retention above 50%
Final Investment Verdict
JSW Infrastructure Ltd. offers a high-quality infra compounding story built on long-tenure port assets, operating efficiency, and strategic expansion. Its improving profitability, zero pledging, and multi-modal logistics integration make it suitable for accumulation by investors seeking exposure to India’s trade infrastructure and supply chain modernization.
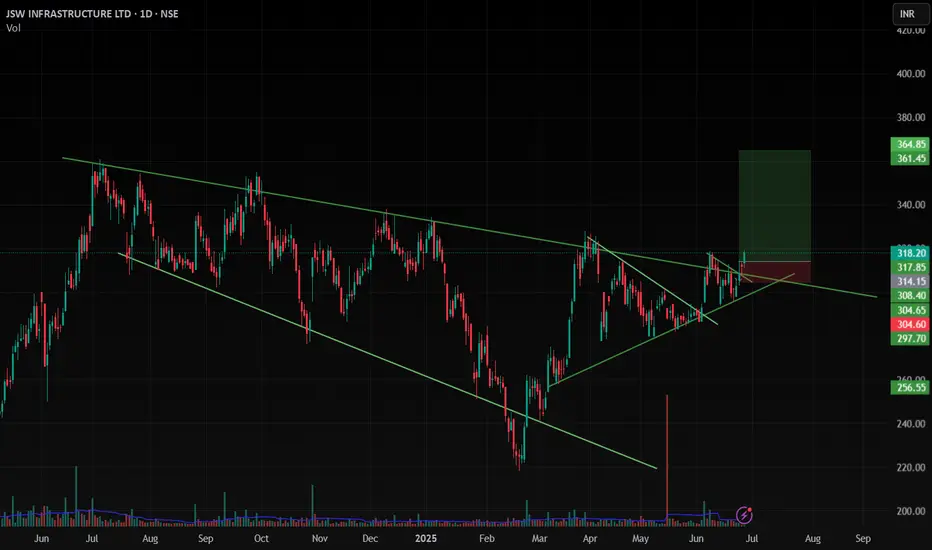
JSWINFRA - Daily time frame StudyFollowing are my Inputs for above chart reading -
1. MACD cross over
2. High volume Breakout of Symmetrical Triangle Pattern - Daily Time frame
3. It may go till weekly resistance line 330-340
This chart is only for educational purpose, Please contact your financial advisor for any trading or investment decisions.
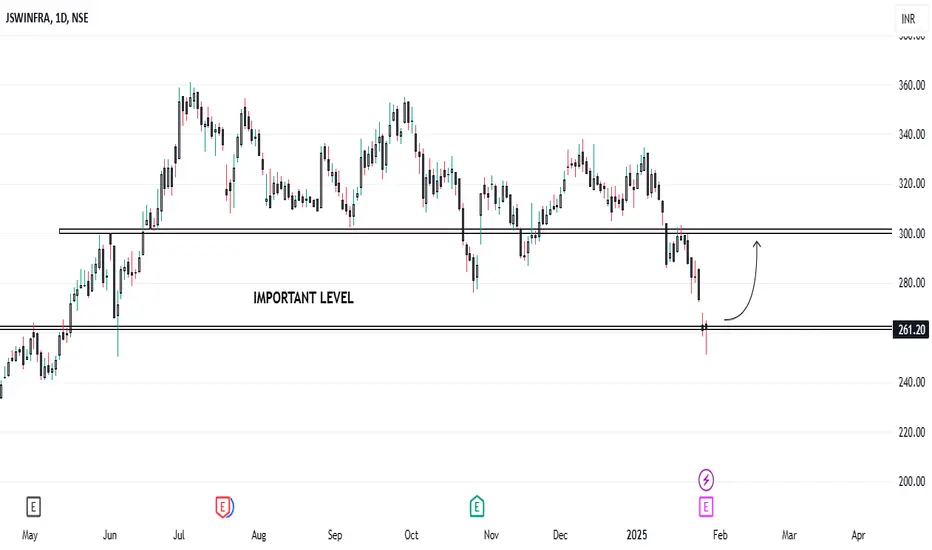
JSW Infra Set to Rise After Strong Results and Key Support..!JSW Infrastructure has released its financial results for the December quarter, showcasing a remarkable 32.35 percent surge in consolidated net profit, reaching an impressive Rs 335.62 crore. This substantial increase marks a significant rise from Rs 253.57 crore in the same quarter last year, fueled by a notable boost in income, as highlighted in the company's official statement.
Looking at the technical chart, the stock is currently positioned at a critical support level of Rs 260. It is making a determined effort to hold above this threshold, indicating a potential opportunity for investors. Given this scenario, traders might consider taking long positions or executing a buying strategy for swing trading, as a sustained performance above this level could signal further upward momentum.
JSWINFRA Weekly InvestingBuy when CLOSE between 322 -334
Stoploss - 307
Target Price : 358
Reward: Risk - 2:1
% Profit : 10%
Disclaimer:
I am not a SEBI registered. The information provided here is for learning purposes only and should not be interpreted as financial advice. Consider the broader market context and consult with a qualified financial advisor before making investment decisions.
JSW INFRASTRUCTURE LTD S/RSupport and Resistance Levels:
Support Levels: These are price points (green line/shade) where a downward trend may be halted due to a concentration of buying interest. Imagine them as a safety net where buyers step in, preventing further decline.
Resistance Levels: Conversely, resistance levels (red line/shade) are where upward trends might stall due to increased selling interest. They act like a ceiling where sellers come in to push prices down.
Breakouts:
Bullish Breakout: When the price moves above resistance, it often indicates strong buying interest and the potential for a continued uptrend. Traders may view this as a signal to buy or hold.
Bearish Breakout: When the price falls below support, it can signal strong selling interest and the potential for a continued downtrend. Traders might see this as a cue to sell or avoid buying.
MA Ribbon (EMA 20, EMA 50, EMA 100, EMA 200) :
Above EMA: If the stock price is above the EMA, it suggests a potential uptrend or bullish momentum.
Below EMA: If the stock price is below the EMA, it indicates a potential downtrend or bearish momentum.
Trendline: A trendline is a straight line drawn on a chart to represent the general direction of a data point set.
Uptrend Line: Drawn by connecting the lows in an upward trend. Indicates that the price is moving higher over time. Acts as a support level, where prices tend to bounce upward.
Downtrend Line: Drawn by connecting the highs in a downward trend. Indicates that the price is moving lower over time. It acts as a resistance level, where prices tend to drop.
Disclaimer:
I am not a SEBI registered. The information provided here is for learning purposes only and should not be interpreted as financial advice. Consider the broader market context and consult with a qualified financial advisor before making investment decisions.