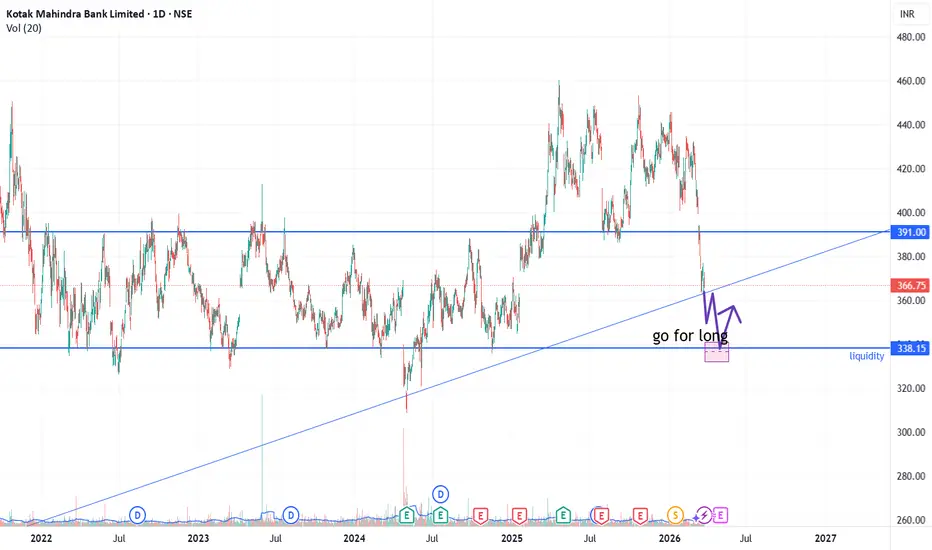
Kotak Mahindra Bank LtdKotak Mahindra Bank continues to look fundamentally steady and technically constructive, with the last four quarters reflecting resilience in core banking performance, stable asset quality, and a strong balance-sheet profile. The setup supports a measured bullish view for the coming quarter and full year, especially if momentum in loan growth and margins sustains.
Fundamental view — Last 4 quarters & guidance
Over the last four quarters, Kotak Mahindra Bank has shown a consistent operating profile with healthy advances growth, stable deposit traction, and controlled credit costs, which has kept earnings quality intact. The bank’s earnings trend has remained supported by prudent underwriting, strong capitalization, and a high-quality liability franchise, which reduces downside risk even in a choppy market.
For the coming quarter and the full year, the key watchpoints are loan growth acceleration, margin stability, fee-income momentum, and management commentary on retail and corporate credit demand. If the bank continues to deliver disciplined growth with stable asset quality, the market is likely to reward the stock with a premium valuation.
Technical view — RSI, MACD & bullish indicators
Technically, Kotak Mahindra Bank is showing a constructive setup with RSI holding in a healthy zone, indicating positive momentum without a strong overbought condition. MACD remains supportive of the trend, and broader chart structure suggests that buyers are active on dips.
Other technical indicators are also leaning bullish, including price holding above key short- and medium-term moving averages, a favorable higher-low structure, and improving volume on upward moves. This combination points to a stock that is still in a trend-friendly phase as long as support levels hold.
Recommendation
Buy Kotak Mahindra Bank at 405 with stoploss of 395 for targets of 411.55, 418.20, 425, 431.85, and 439.
This is a disciplined momentum-plus-quality banking trade with a tight risk profile and defined upside targets.
Disclosure
Disclosure: I am not a SEBI registered analyst or technical advisor. This post is for educational and informational purposes only and should not be considered investment advice.
In-depth trading ideas
KOTAK BANK | Intraday Analysis | 17 Jun 2026📉 Intraday Market Update
Kotak Bank has generated a fresh SELL signal after failing to sustain higher levels and breaking below short-term support. The recent price action shows increasing bearish momentum, with sellers maintaining control throughout the session.
Price is currently trading near the first objective, making the reaction around this level important for the next move.
Key Levels
🎯 Potential T-1: ₹403.05
🎯 Potential T-2: ₹400.15
🎯 Potential T-3: ₹397.30
🛑 Potential Risk Level (SL): ₹408.75
Price Action Observations
✅ Fresh SELL signal generated.
✅ Lower highs and lower lows continue to develop.
✅ Strong bearish candles indicate seller dominance.
✅ Price has approached the first target zone.
✅ Momentum remains negative while price stays below the recent swing resistance.
Intraday Trading View
• Sustaining below the sell signal zone keeps the bearish structure intact.
• A decisive break below T-1 may increase the probability of a move toward T-2.
• Continued selling pressure could extend toward T-3.
• Any recovery toward the stop-loss zone would require reassessment of the current bearish setup.
Market Structure
The current structure favors sellers, with price trading below recent intraday resistance levels. Unless buyers reclaim key resistance areas, the path of least resistance remains to the downside.
Risk Management
Every setup carries risk. Proper position sizing and disciplined stop-loss management are essential regardless of market direction.
⚠️ This analysis is based on current market structure and price action. Future price movements cannot be predicted with certainty.
#KotakBank #BankNiftyStocks #IntradayTrading #PriceAction #TechnicalAnalysis #NSE #MarketStructure #RiskManagement #TradingViewIndia #BKQuantDesk
KOTAKBANK: Reversing the Bear Trend🏦 🏦 🏦
The Thesis: Shaking Off the SlumpThe banking sector is finally pivoting from "restructuring anxiety" to "growth delivery."
While IT is currently suffering from "OpenAI disruption" fatigue, private banks like Kotak are finding a base.
Kotak’s Q4 results beat estimates by 10% with a profit of ₹4,027 crore, and its asset quality is remarkably clean with a Net NPA of just 0.25%.
Technical Analysis: The Rounding Bottom / Cup & Handle is forming a classic, a structural reversal.
The Launchpad: Support successfully held in the ₹343–₹348 zone.The Resistance: We are currently hammering against the ₹386.85 breakout level.
A daily close above this confirms the trend reversal.
The Gap Fill: The immediate high-velocity target is the orange line at ₹399.00. This is where May/Jun 400 CE position enters the "Gamma" zone.
The Trade Plan"Mahesh" Logic: We aren't just looking for a bounce; we are looking for the destruction of the 2-month downtrend.
LevelPrice PointActionEntry₹383.25 – ₹387.00Accumulate on the breakout of the purple resistance.
Stop Loss₹368.00Protect against a "fake-out" back into the rounding base.Linear Target₹428.00The structural recovery objective.
Log Target₹433.05
Short-Term Catalysts
RBI Resolution: The market is pricing in a resolution to the RBI's digital onboarding restrictions by June 2026, which would allow Kotak to restart its aggressive credit card growth.
Margin Stabilization: Net Interest Margins (NIM) showed a sequential recovery to 4.67% in Q4, proving the bank can defend its spreads even in a "persistent inflation" environment.
#KOTAKBANK #BankNifty #TradingView #Breakout #OptionsTrading #Finance2026
Kotak Bank Ready for a Momentum Move!Kotak Bank | 1-Hour Timeframe Analysis
Kotak Bank is currently trading within a well-defined parallel channel, indicating a healthy and structured price trend.
Support Zone: 360 – 370
Upside Target: Upper boundary of the channel near 400
As long as the stock sustains above the support zone, the bullish structure remains intact and a move towards the channel's upper boundary can be expected.
View Invalid Below: 340
Trade with proper risk management.
Thank you.
Kotak Bank at Key Short-Term Support ZoneKotak Bank: Trading Near Key Support Zone
This is the 1-hour timeframe chart of Kotak Bank. The stock is moving within a well-defined parallel channel, with strong support levels aligned with key Fibonacci retracement zones.
Support Zones:
Aggressive Traders: ₹372 – ₹375
Safe Traders: ₹360 – ₹365 (Parallel Channel Support + Fibonacci Golden Ratio)
Upside Targets:
Target 1: ₹400
Target 2: ₹405
As long as the stock remains within the channel structure, the overall setup stays positive. The upper boundary of the channel may act as a resistance zone near the target range.
Trade with proper risk management and wait for confirmation around support levels.
Thank You.
KOTAKBANK Technical Outlook: Bulls Eye ₹410 Post-EarningsQ4 Earnings Snapshot (FY24 Performance)
The bank recently reported strong Q4 results, significantly exceeding analyst expectations in several key areas.
Net Profit: Jumped 18% YoY to ₹4,133 crore (standalone), driven by robust loan growth and improved asset quality.
Net Interest Income (NII): Increased by 13% YoY to ₹6,909 crore
Asset Quality: Improved with Gross NPA at 1.39% (vs 1.78% last year) and Net NPA at a very healthy 0.34%.
Dividends: The board has recommended a dividend of ₹2.00 per share.
Current Price: ₹383.20
Trend: The stock is trading above its 20 DEMA (₹376.30), suggesting short-term bullish momentum.
Resistance: A "Resistance Break-out" level is identified at ₹386.45. A sustained move above this could trigger a sharp rally.
Key Hurdle: The 100 DEMA at ₹397.10 acts as a major psychological and technical barrier before the primary target.
Action Buy / Long
Stop Loss ₹367.65
Target 1 ₹397.10
Primary Target ₹410.30
Risk/Reward ~1:1.2
Wait for the Breakout: Ensure the price closes above ₹386.45 on a 1-day timeframe to avoid "fake-outs."
Monitor Volume: Look for a spike in trading volume during the breakout for confirmation.
Risk Management: If the stock slips below ₹375, the bullish thesis weakens as it breaks back below the 20 DEMA.
Disclaimer: aliceblueonline.com/legal-documentation/disclaimer/
Review and plan for 4th May 2028Nifty future and banknifty future analysis and intraday plan.
Quarterly results- analysed.
This video is for information/education purpose only. you are 100% responsible for any actions you take by reading/viewing this post.
please consult your financial advisor before taking any action.
----Vinaykumar hiremath, CMT
Kotak Mahindra Bank – Reversal & Breakout Setup Near ₹385 ZoneThe price has shown a recovery after a sharp downtrend and is currently trading around the ₹380–₹385 zone. The recent price action indicates strength with higher lows, suggesting a potential reversal if the price sustains above the current resistance.
The key demand/support zone lies near ₹362 – ₹371, which can act as a base on pullbacks.
Trade Plan
Entry Zone:
₹375 – ₹385 (on consolidation or breakout above ₹385)
Stop Loss:
₹362.95 (below key demand zone / invalidation level)
Primary Targets:
₹406.90 (near-term resistance level)
₹442.90 (major resistance level)
₹460.55 (extended target)
₹477.75 – ₹478.55 (final target if momentum continues)
Chart Observations
• Price has formed a higher low after a strong correction, indicating recovery.
• The ₹362 – ₹371 zone is acting as a strong demand area.
• Current price action near ₹385 suggests a breakout setup.
• ₹406 is the immediate resistance where price may face selling pressure.
• A breakout above ₹406 can push the price toward ₹442 and higher levels.
• Structure indicates a potential trend reversal from bearish to bullish.
Notes
• This is a reversal + breakout setup — confirmation above ₹385 is important.
• The stop loss at ₹362.95 helps manage downside risk effectively.
• Traders may consider partial profit booking near ₹406 and trail positions for higher targets.
Disclaimer
This idea is for educational purposes only and not financial or investment advice. Markets are volatile and conditions can change quickly. Always do your own analysis and apply proper risk management before taking any trades.
TradingView Professional DescriptionTitle: Kotak Bank (Monthly): Macro Structure Analysis & High-Conviction Execution Plan 🎯
Description:
This is a high-level structural analysis of Kotak Mahindra Bank Limited on the Monthly timeframe. Since this is a Macro view, patience and strict adherence to the entry/exit procedure are mandatory as the targets may take significant time to materialize.
1. Market Structure & Bias:
The stock is currently trading within a well-defined long-term ascending corridor. As long as the price respects the higher-low formation on the monthly close, the primary bias remains Structural Bullish.
2. The Entry Procedure (Patience is Key):
Primary Accumulation Zone: We are looking for price stabilization near the Primary Dynamic Support (Dotted Red Line).
Confirmation: Do not rush the entry. Wait for a bullish reversal candle (e.g., Hammer or Bullish Engulfing) on the Weekly or Monthly close to confirm that the support is holding.
3. Key Transition Levels:
Polarity Flip (Intermediate Target): The blue line acts as a critical pivot. Once this resistance is flipped into support, it confirms the strength for the next leg up.
Ultimate Objective: The final target is the Major Supply Zone at the top. Expect heavy volatility or a trend rejection at this peak.
4. Risk Management & Exit Strategy (Strict Rules):
Invalidation Point: If the price delivers a decisive monthly candle close below the Secondary Demand Zone (325-330), the bullish thesis is invalidated.
Profit Taking: Partial profits should be booked at the Polarity Flip Level to de-risk the trade, trailing the rest to the Ultimate Objective.
Summary:
This is a 'Marathon' trade, not a sprint. Proper position sizing and emotional discipline are required to ride this macro move.
Disclaimer: Educational research only. Technical structures can change; always follow your own risk-reward parameters
Kotak Mahindra Bank Bullish## Kotak Mahindra Bank
### Basic Information
* **Founded:** 1985 (as Kotak Mahindra Finance Ltd.)
* **Banking License:** 2003 (became a bank)
* **Headquarters:** Mumbai, India
* **Founder:** Uday Kotak
* **Type:** Private Sector Bank
### Business Segments
**1. Consumer Banking**
* Savings and current accounts
* Personal loans, home loans, auto loans
* Credit cards and debit cards
**2. Corporate Banking**
* Loans and financial services for companies
* Trade finance and working capital loans
**3. Investment Banking**
* IPO advisory
* Mergers & acquisitions advisory
* Capital market services
**4. Wealth & Asset Management**
* Mutual funds
* Portfolio management services
* Financial advisory for high-net-worth individuals
**5. Insurance**
* Life insurance and general insurance products through subsidiaries.
### Key Strengths
* Strong **digital banking platform**
* Focus on **high-quality loan portfolio**
* Large presence in **wealth management and investment banking**
### Subsidiaries
* Kotak Securities
* Kotak Mahindra Asset Management Company
* Kotak Life Insurance
### Simple Summary
Kotak Mahindra Bank operates as a **diversified financial services group**, offering everything from retail banking to investment banking and wealth management. It has grown from a finance company into one of India’s most prominent private banks.
---
If you want, I can also explain **Kotak Mahindra Bank Business Model (for stock market analysis)** in a simple way like you asked earlier for other companies.
NSE – NIFTY 750 | Kotak Mahindra Bank Ltd | Monthly Structure🧭 Structural Overview
Long-term rising structural base intact (post-2008 reset).
📊 Current Phase
Higher-range consolidation within established uptrend.
🏗 Structural Notes
• Base trendline intact
• No structural breakdown behaviour
• Monthly structure remains constructive
Structure precedes narrative.
⚠️ Educational structural analysis only.
Not investment advice.
#NIFTY750
#StructureCensus
#KotakMahindraBank
#EquityStructure
#MonthlyChart
#KotakBank - 1921 or 2434?Date: 26-10-2205
Kotak Bank Current Price: ₹ 2,187.00
Pivot Point: ₹ 2,177.90 Support: ₹ 2,130.49 Resistance: ₹ 2,225.67
Upside Levels:
L1: ₹ 2,275.19 L2: ₹ 2,324.70 L3: ₹ 2,379.75 L4: ₹ 2,434.80
Downside Levels:
L1: ₹ 2,080.80 L2: ₹ 2,031.10 L3: ₹ 1,976.05 L4: ₹ 1,921.00
#TradingView #Nifty #BankNifty #DJI #NDQ #SENSEX #DAX #USOIL #GOLD #SILVER
#BHEL #HUDCO #LT #LTF #ABB #DIXON #SIEMENS #BALKRISIND #MRF #DIVISLAB
#MARUTI #HAL #SHREECEM #JSWSTEEL #MPHASIS #NATIONALUM #BALRAMCHIN #TRIVENI
#USDINR #EURUSD #USDJPY #NIFTY_MID_SELECT #CNXFINANCE
#SOLANA #ETHEREUM #BTCUSD #MATICUSDT #XRPUSDT #PEPEUSDT #SHIBUSDT
#Crypto #Bitcoin #BTC #CryptoTA #TradingView #PivotPoints #SupportResistance
KOTAK BANKKotak Mahindra Bank Ltd., incorporated in the year 1985, is a banking company (having a market cap of Rs 4,26,771.84 Crore).
Kotak Mahindra Bank Ltd. key Products/Revenue Segments include Interest & Discount on Advances & Bills, Income From Investment, Interest On Balances with RBI and Other Inter-Bank Funds and Interest for the year ending 31-Mar-2025.
The Bank has reported Standalone Non Performing Assets (Gross NPAs) at .00 % of total assets and Standalone Net Non Performing Assets (Net NPAs) at .00% of total assets for the quarter ending 30-09-2025.
For the quarter ended 30-09-2025, the company has reported a Consolidated Total Income of Rs 24,901.39 Crore, down 6.75 % from last quarter Total Income of Rs 26,703.92 Crore and down 7.36 % from last year same quarter Total Income of Rs 26,880.02 Crore. The bank has reported net profit after tax of Rs 4,468.27 Crore in latest quarter.
The bank’s top management includes Mr.C S Rajan, Mr.Ashok Vaswani, Ms.Shanti Ekambaram, Mr.Jaideep Hansraj, Mr.Amit Desai, Mr.Uday Kotak, Dr.Ashok Gulati, Ms.Ashu Suyash, Mr.Eli Leenaars, Mr.Ketaki Bhagwati, Mr.Uday Shankar, Mr.Devang Gheewalla, Mr.Avan Doomasia. It has Deloitte Haskins & Sells as its auditoRs As on 30-09-2025, the company has a total of 198.86 Crore shares outstanding.
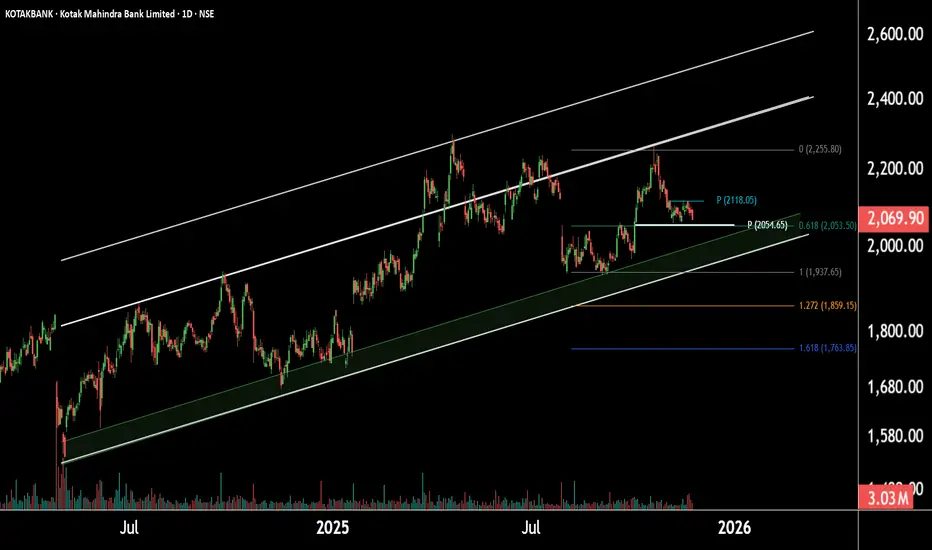
Kotak Near Crucial Support Zone — Opportunity AheadThis is the daily timeframe chart of Kotak Bank.
The stock is moving within a well-defined parallel channel, with a key support zone around 1950–2000.
When applying the Fibonacci retracement from the recent low to high, the 2050 level aligns as an important support area.
This 2050 zone is also confirmed by the pivot levels—whenever this level holds, the stock avoids further decline and maintains a range-bound movement. For the past month, Kotak Bank has been trading between two key pivot levels:
Quarterly Pivot: 2050
Monthly Pivot: 2120 (which will shift after monthly expiry)
A breakout above the monthly pivot can trigger further upside, with potential targets around 2330–2350.
If the support continues to hold, we may see higher levels in the stock.
Thank you.
Kotak Mahindra Bank Ltd for 29th Oct #KOTAKBANK Kotak Mahindra Bank Ltd for 29th Oct #KOTAKBANK
Resistance 2170 Watching above 2172 for upside momentum.
Support area 2130 Below 2130 gnoring upside momentum for intraday
Watching below 2127 for downside movement...
Above 2170 ignoring downside move for intraday
Charts for Educational purposes only.
Please follow strict stop loss and risk reward if you follow the level.
Thanks,
V Trade Point
Kotak Mahindra Bank Ltd for 28th Oct #KOTAKBANK Kotak Mahindra Bank Ltd for 28th Oct #KOTAKBANK
Resistance 2160-2165 Watching above 2167 for upside momentum.
Support area 2130 Below 2130 gnoring upside momentum for intraday
Watching below 2127 for downside movement...
Above 2160 ignoring downside move for intraday
Charts for Educational purposes only.
Please follow strict stop loss and risk reward if you follow the level.
Thanks,
V Trade Point
big dhulai candidate KOTAK BANKStrategy – Ichimoku Cloud Setup (Daily Timeframe)
🔍Current Setup
Price is below the cloud, indicating bearish bias.
Cloud ahead is red and thick, suggesting strong resistance and no immediate trend reversal.
Tenkan-sen is below Kijun-sen, confirming weak short-term momentum.
No bullish crossover or breakout candle yet.
📌 Action Plan
Avoid fresh long positions until price closes above the cloud and Tenkan crosses above Kijun.
Watch for rejection near cloud base or resistance zones for potential short setups.
Use RSI and volume confirmation before acting on any breakout or reversal.
✅ Verdict: Bearish – Avoid for Now
Trend is weak and below resistance cloud.
No bullish confirmation yet.
Wait for breakout above cloud with volume and RSI > 55 before considering a buy.