 Long
Long
Latent View Analytics Limited
No trades
No trades
In-depth trading ideas
Long Long
Long
Accumulate for 702At bottom of 52 months range. Good financials. Big move after 408. Good risk-reward now.
Long
LATENT VIEWLatent View Analytics Ltd. (currently trading near ₹485.45) – Overview Latent View Analytics Ltd., headquartered in Chennai, is one of India’s fastest-growing digital analytics firms. The company provides business analytics, consulting, data engineering, and digital solutions. Its offerings span: • Marketing & Customer Analytics – consumer behavior, retention, and campaign optimization • HR & Supply Chain Analytics – workforce planning, demand forecasting, and efficiency improvement • Finance & Risk Analytics – fraud detection, credit risk, and compliance solutions • Data Engineering & Visualization – platform modernization, migration, and predictive dashboards
Latent View serves clients in technology, industrials, consumer goods, retail, and financial services across India, the US, UK, Singapore, and the Netherlands.
FY22–FY25 Snapshot • Sales – ₹456 Cr → ₹520 Cr → ₹590 Cr → ₹650 Cr Growth driven by global digital transformation and analytics outsourcing
• Net Profit – ₹110 Cr → ₹125 Cr → ₹140 Cr → ₹160 Cr Earnings supported by scale, offshore delivery, and AI-led efficiencies
• Operating Performance – Strong → Strong → Very Strong → Very Strong EBITDA margins improving with higher-value consulting and repeat client contracts
• Dividend Yield (%) – Nil → Nil → Nil → Nil No payouts; reinvestment into expansion and R&D
• Equity Capital – ₹20.4 Cr (constant) No dilution; lean capital structure with promoter-led governance
• Total Debt – Nil → Nil → Nil → Nil Debt-free balance sheet ensures stability and scalability
• Fixed Assets – ₹210 Cr → ₹230 Cr → ₹250 Cr → ₹270 Cr Capex focused on digital platforms, AI innovation, and global expansion
Institutional Interest & Ownership Trends Promoter holding ~67% FIIs/DIIs actively accumulating due to strong analytics demand and global expansion Public float ~33%, with delivery volumes reflecting long-term positioning by tech-focused funds
Business Growth Verdict Latent View is scaling across AI-driven analytics, consulting, and platform modernization Margins improving via offshore leverage and high-value contracts Debt-free model ensures strong cash flows and reinvestment capacity Capex supports global expansion and AI innovation
Management Highlights • FY25: Expanded AI-driven fraud detection and supply chain analytics solutions • Strengthened presence in US and Europe, adding Fortune 500 clients • R&D spend increased for generative AI and predictive analytics • FY26 Outlook: 12–15% revenue growth, PAT expected to cross ₹180 Cr
Final Investment Verdict Latent View Analytics Ltd. offers a high-growth digital analytics story built on AI, consulting, and global expansion. Its debt-free balance sheet, strong profitability, and expanding client base make it suitable for accumulation by investors seeking exposure to India’s data analytics and AI transformation theme. With strong execution and global reach, Latent View remains a durable compounder in the mid-cap IT services space.
Long
Cup & Handle Pattern Breakout in Latent ViewLatent View given Cup & Handle Pattern Breakout from neckline arround 460 level on daily & weekly chart. Possible upside target will be 510 & 575 with a stoploss of 530 Rs. RSI & MACD also indicating positive momentum.
It's not a buy or sell call ..For education only
Long
Latentview (NSE) (W)- In Accumulation phase with VCP Price Action
The stock is showing signs of a potential recovery after a prolonged downtrend. It has formed a base structure and appears to be consolidating after a period of volatility. The price has recently tested resistance and is now stabilizing at slightly lower levels, which could indicate a potential breakout or further consolidation.
The price action suggests that the stock is consolidating just below resistance, which is typical before a potential continuation of the bullish trend.
Key Levels
Support Zones:
₹398.25 (immediate support).
₹447.70 (stronger support, crucial for maintaining the bullish outlook).
Resistance Zones / Upside Targets:
₹544.25 (minor resistance, likely to face a challenge here).
₹596.05 (key resistance, watch for breakout confirmation).
₹645.50 (higher resistance, major target).
Volume Analysis
Volume has been fluctuating, but the overall trend shows that the stock is not experiencing significant distribution at this point. The volume spikes during periods of higher price action and steady volume during consolidation suggest that the price movement is not driven by panic selling but rather by investor interest in the current range.
Trend & Momentum
Short-term trend: Sideways, with consolidation happening just below resistance.
Medium-term trend: Bullish, as the price is holding above the previous key support levels.
Momentum: Positive, as long as the price remains above ₹447.70, indicating that the bullish sentiment is still intact.
Possible Scenarios
Bullish Case:
A breakout above ₹544.25 could lead the stock toward ₹596.05, followed by a rally to ₹645.50. A strong volume increase would confirm a continuation of the bullish trend and suggest that the stock is ready to move towards the higher targets.
Bearish Case:
If the price fails to hold above ₹447.70 and breaks below ₹398.25, it may retrace further, potentially testing the lower support levels again. A close below ₹398.25 would invalidate the current bullish bias and suggest a deeper correction.
Overall Bias:
The stock is currently consolidating near resistance after a period of downward movement. As long as it holds above the key support level of ₹447.70, the overall bias remains bullish with a potential breakout to the upside towards ₹544.25 and higher targets.
⚠️ Disclaimer : This chart is for educational purposes only.
Regulatory Note: We are an independent development team. Our services are not registered or licensed by any regulatory body in India, the U.S., the U.K., or any global financial authority. Please consult a licensed advisor before making trading decisions.
Long
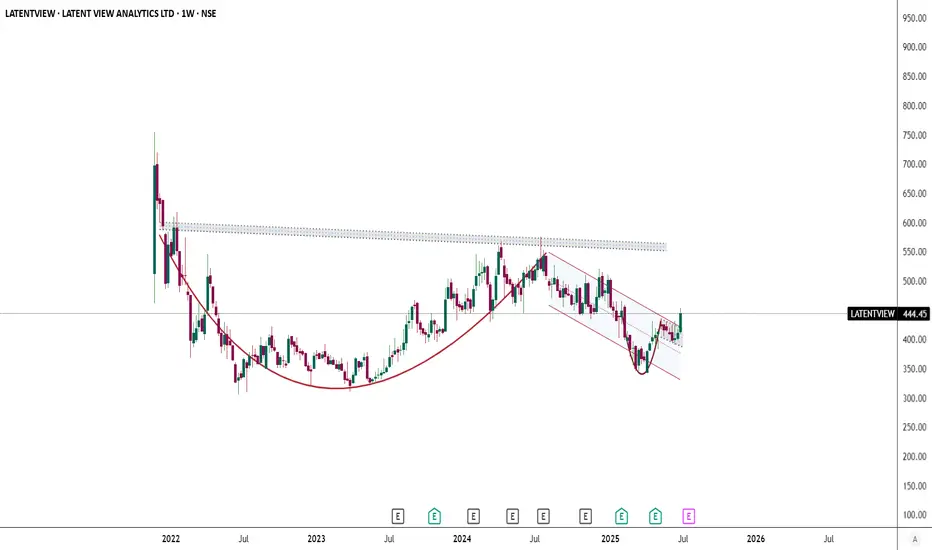
Immediate p.t.480Has crossed 15months falling channel and 3months parallel channel consolidation. Only for study purpose.
Long
LATENTVIEW long setupLATENT view long setup
Entry - 414.2
SL - 410.15
TGT - 434.2
Risk Reward - 1:4.94
Long
LATENTVIEW | Buy @LTP | SL below 380 | 1st Target 690Disclaimer:
This is not financial advice. Please do your own research or consult with a financial advisor before making any investment decisions. Investments in stocks can be risky and may result in loss of capital.
Long
LATENTVIEWLATENTVIEW
watch above levels. green line is our entry, redline is our SL.
DISCLAIMER : I am NOT a SEBI registered advisor or a financial adviser. All the views are for educational purpose only.
Long
Good order block momentum Zone Buy Cmp first target 560 if first target break next target 700
Stoploss 450
Holding period 5-15 days for first target
Holding period 2-3 months for second target
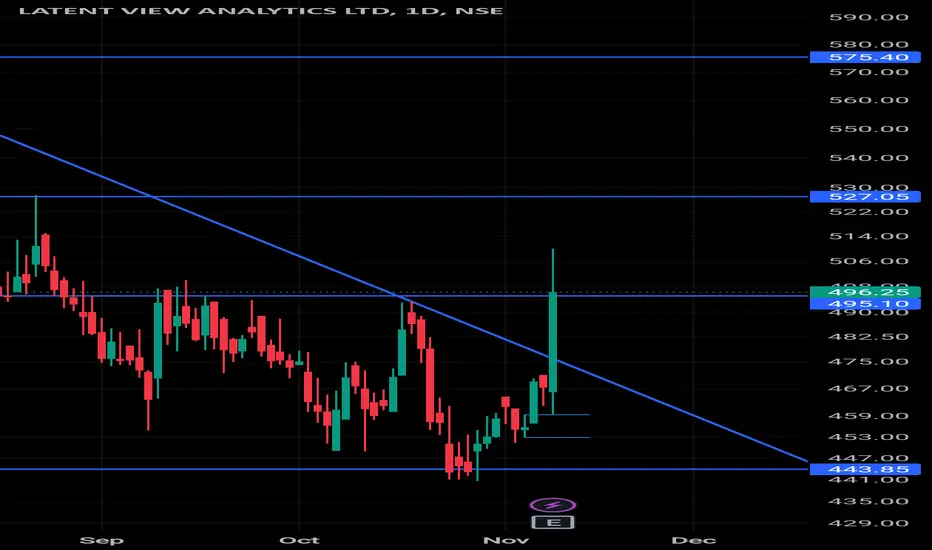
POTENTIAL LONG OPPORTUNITY IN LATENTVIEW AFTER GOOD RESULTSLATENTVIEW has reported a 34% rise in Y-o-Y Sales and 17% rise in Y-o-Y Profits.
PRICE ACTION:
WEEKLY: Stock is trading within a range.
DAILY: Stock has broken out of a downward trendline.
RATIONALE: The good quarterly results might act as trigger point in pushing the price up to the previous resistance. Not much of selling pressure is seen in the red candles. There are significant green candles in the range. This suggests that the stock is in the accumulation stage.
Targets and Stoploss are marked in the chart.
DISCLAIMER: This is shared for educational purposes only and not a recommendation to BUY/SELL. Please do your own research before taking a decision.
Happy Trading!
Long
LATENTVIEW Daily breakout Strong LATENTVIEW has given Daily breakout Strong with Volumes
Nearest Target 528/550 Expecting
Long
LAtent view looks gooodlatent view looks good above on buy 500 SL 430 target is 1st target is 600-640
Long
Watch Out for LATENTVIEWLATENT VIEW looks bullish from here, One's interested can open long positions above 485 and keep stoploss below previous swings.
Expecting All Time High from here.
Long
SWING IDEA - LATENT VIEW ANALYTICSIn the dynamic realm of market opportunities, Latent View Analytics emerges as a compelling prospect, poised for an upside rally.
Reasons are listed below :
After multiple tests at the crucial 500 level, Latent View Analytics is currently positioning for a decisive breakout.
Robust bullish marubozu candles, both on the weekly and daily timeframes, signal a strong upward momentum. Notably, the weekly candle engulfs the preceding six weeks, emphasizing sustained buying interest.
An upswing in volumes accompanies the bullish trend, indicating heightened market participation and conviction.
Breaking free from a solid two-year consolidation phase, Latent View Analytics signals a shift from stagnation to potential growth.
Target - 545 // 573 // 618
Stoploss - weekly close below 443
DISCLAIMER -
Decisions to buy, sell, hold or trade in securities, commodities and other investments involve risk and are best made based on the advice of qualified financial professionals. Any trading in securities or other investments involves a risk of substantial losses. The practice of "Day Trading" involves particularly high risks and can cause you to lose substantial sums of money. Before undertaking any trading program, you should consult a qualified financial professional. Please consider carefully whether such trading is suitable for you in light of your financial condition and ability to bear financial risks. Under no circumstances shall we be liable for any loss or damage you or anyone else incurs as a result of any trading or investment activity that you or anyone else engages in based on any information or material you receive through TradingView or our services.
@visionary.growth.insights
Long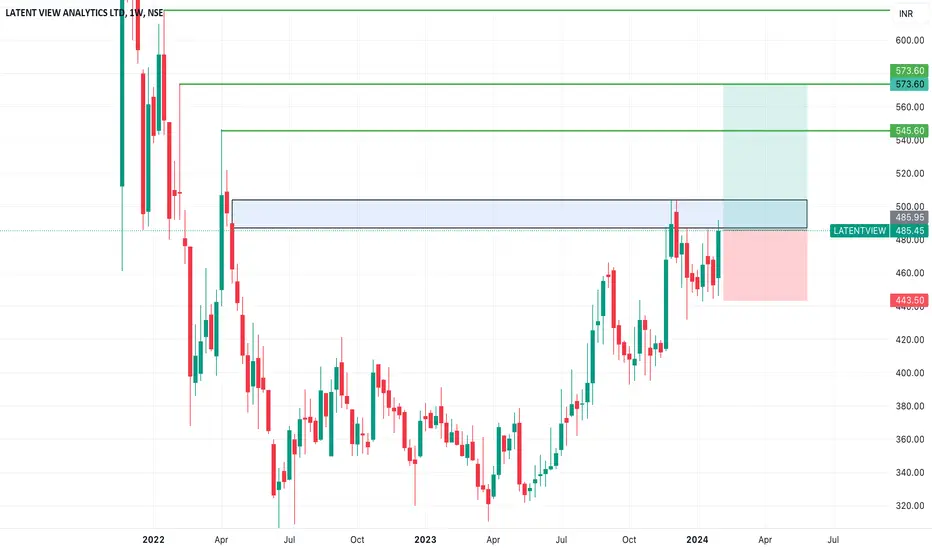 Long
Long Long
Long
Latent View Analytics LtdTarget and SL given in chart
Stock valuations are not cheap - Keep Strict SL
OLD CHART IDEA
FUNDAMENTALS
Market Cap
₹ 11,320 Cr.
Current Price
₹ 550
High / Low
₹ 561 / 322
Stock P/E
76.7
Book Value
₹ 62.1
Dividend Yield
0.00 %
ROCE
16.7 %
ROE
13.8 %
Face Value
₹ 1.00
Price to book value
8.85
Intrinsic Value
₹ 119
Price to Sales
18.6
Debt
₹ 24.8 Cr.
Debt to equity
0.02
Int Coverage
63.5
Reserves
₹ 1,259 Cr.
Promoter holding
65.4 %
Pledged percentage
0.00 %
EPS last year
₹ 7.59
Net CF
₹ -183 Cr.
Price to Cash Flow
116
Free Cash Flow
₹ 94.2 Cr.
OPM last year
26.9 %
Return on assets
13.0 %
Industry PE
35.3
Sales growth
18.4 %
Long
Latent view: Bears in disguise of Bulls?We may see an Invert H&S formation which looks like it has already broken out, but we still need a confirmation as this may be a fake out instead, currently we need a continue green candle which can take the RSI to 70.5 or above without falling. This will confirm the BO and counter may reach its all time high, if it fails to do so, we may see a sharp fall.
Long
Lantenview Weekly Chart IPO strategyRound bottom pattern
volume grwoth
bolinger band
rsi
ema
all are above (hold the breath adn long)
Long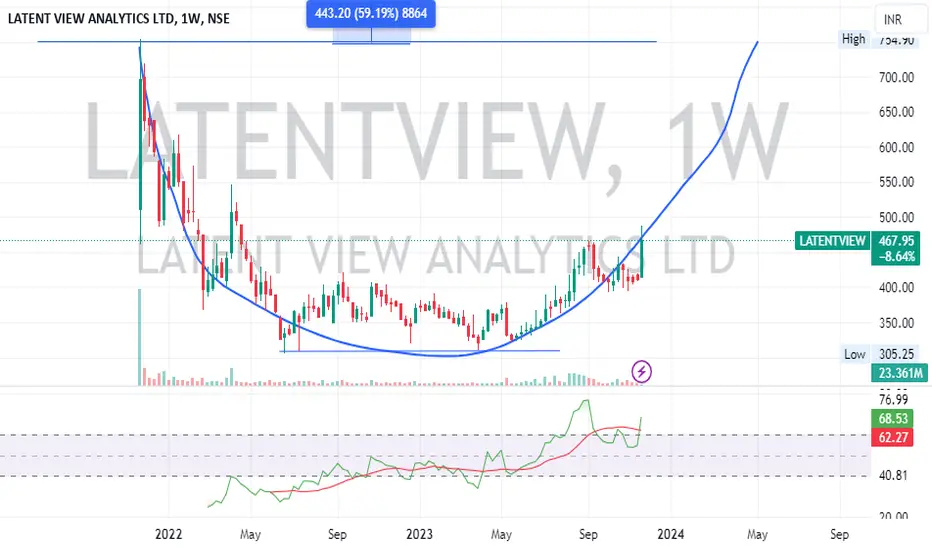
LATENTVIEW Cup & Handle Pattern on Weekly ChartLATENTVIEW has formed a Beautiful "Cup & Handle Pattern" on weekly chart its CMP is 512 expecting 620 mark in max 4-6 months. However the IT sector is near by to All Time High and mostly there is a probability to break ATH in this Feb 2024.
Long